 Open Access Article
Creative Commons Attribution 3.0 Unported Licence
Anisotropic crystallite size distributions in LiFePO4 powders†
Alexander Bobyl *a and
Igor Kasatkin
 b
b
aIoffe Institute, Politekhnicheskaya ul. 26, St. Petersburg, 194021, Russia. E-mail: bobyl@theory.ioffe.ru
bSt. Petersburg State University, Universitetskaya nab. 7–9, St. Petersburg, 199034, Russia
First published on 13th April 2021
Abstract
The anisotropic crystallite sizes in high-performance LiFePO4 powders were measured by XRD and compared with the particle sizes found by TEM image analysis. Lognormal particle size distribution functions were determined for all three main crystallographic axes. A procedure was developed to determine the fraction of the composite particles which consists of several crystallites and contains small- and large-angle boundaries. In a sample with the most anisotropic crystallites (ratio of volume-weighted mean crystallite sizes ![[L with combining macron]](https://www.rsc.org/images/entities/i_char_004c_0304.gif) V[001]/
V[001]/![[L with combining macron]](https://www.rsc.org/images/entities/i_char_004c_0304.gif) V[010] = 1.41) the number of the composite particles was at least 30%.
V[010] = 1.41) the number of the composite particles was at least 30%.
Introduction
The efficiency of LiFePO4 cathodes and oxides in general can be improved by controlling the size and morphology of particles.1–4 A decrease in the particle size shortens the Li diffusion length and the discharge–charge time.5,6 This time also depends on the mechanism of the new phase nucleation on the particle surface,7 on the nucleation rate8 and on the time of the LiFePO4/FePO4 phase boundary motion in the particle. The latter depends on the structural defects in the particles: intrinsic,9 impurity and isovalent1 defects, deformations and 3D structuring of the phase boundary, and stress/deformation relationships.10,11 Composite particles have mechanically stable non-coherent boundaries between misoriented mosaic blocks;12 conglomerates are formed by ordered13 or chaotically disordered nanocrystallites,14 secondary phase particles are segregated on larger LiFePO4 particles.15 The conglomerates, even as large as 100 μm, may disintegrate and completely disappear upon additional chemically active annealing.14 As a rule, a mosaic microstructure negatively affects the ionic conductivity.16 However, a higher coefficient of diffusion along the block boundary in the particles LiCoO2 (ref. 17) and LiMn2O44,18 was theoretically and experimentally studied.Currently, the emerging new technologies based on computer tomographic procedures using a synchrotron19 or an X-ray probe20 allow obtaining three-dimensional (3D) images of the particle distribution in the ready-made battery electrodes. Nevertheless, the methods for determining size distributions of anisotropic particles and crystallites along their crystallographic axes remain topical. These methods include X-ray diffraction (XRD) microstructure analysis and statistical analysis of transmission electron microscopy (TEM) images. Note that XRD determines a coherent length (volume- or area-weighted mean length of the elementary columns – along certain crystallographic directions in anisotropic case, or averaged over all directions), commonly called coherent domain size or crystallite size, while TEM gives the size of particles which may consist of several crystallites. When these sizes are compared, the following problems arise:
(1) Determining size distribution functions for anisotropic crystallites, such as LiFePO4, on the basis of XRD has not yet become a common practice, even though it was possible in isotropic case for crystallites with high lattice symmetry.21–25
(2) Microscopic studies provide two sets of sizes (Ls, the width, and Lb, the length) measured in ensembles of differently oriented particles. A procedure is required for sorting particles in those ensembles.
(3) Presence of mosaic blocks and fused particles is obvious in some cases,12–18,26–31 but detection of small-angle and other boundaries separating the coherent domains requires laborious (HR)TEM studies, which can hardly be compared in statistical reliability with XRD studies.
(4) The coherently scattering domain size determined with XRD is always smaller than the particle size measured with TEM, even in a perfect crystal: each shape of a 3D crystallite predefines a certain column length distribution function. The relation between the sizes is as simple as LXRD = 2/3DTEM or LXRD = 3/4DTEM (depending on the weighting scheme) for spherical particles only. Other microstructural features and defects can complicate the situation. Generalized scheme has been developed for converting the number, surface and volume weighted particle densities.25
In this work we combined TEM and XRD measurements to determine the size distribution functions of anisotropic LiFePO4 particles and crystallites along their crystallographic axes.
Experimental results
The following highly effective LiFePO4 powders were examined: no. 1, P2, Phostech Lithium;32 no. 2, P1, Phostech Lithium;32 no. 3, SPbGTI;33 no. 4, Golden Light Energy; no. 5, OCELL Technologies. The powders had specific capacities ranging from 145 to 170 mA h g−1 at 0.1C.34,35XRD studies
The methodology developed in ref. 36–38 and implemented in the MAUD software39,40 was used for anisotropic refinement of the crystallite size and strain values along the coordinate directions. X-Ray powder diffraction data were collected at 305 K with a Bruker D8 Discover diffractometer operating in a parallel-beam linear-focus mode at 2θ = 15–125°. The primary beam was conditioned with a double-bounce channel-cut Ge220 monochromator to provide CuKα1 radiation with a wavelength of 1.54056 Å. The specimens were prepared by dry compaction of the powders into a “zero-background” single-crystal silicon cuvette (Bruker). The data collection time was optimized to maximize StN ratio and ensure a stable refinement. The Caglioti coefficients of the instrumental profile function were refined by fitting the data for a LaB6 powder specimen (NIST SRM 660c) prepared and scanned under the same conditions. All of the samples were composed of phase-pure orthorhombic LiFePO4 with only trace amounts of impurities (<0.5%) ignored during the refinement. The refinements converged with Rwp < 9%. XRD scans of the samples are located in the ESI section.† The refinement was repeated several times from different starting conditions; the values of error reported in Table 1 (in parentheses) characterize the reproducibility. It contains the volume-averaged crystallite sizes along![[L with combining macron]](https://www.rsc.org/images/entities/i_char_004c_0304.gif) V[hkl] axes.
V[hkl] axes.
![[L with combining macron]](https://www.rsc.org/images/entities/i_char_004c_0304.gif) V[hkl] for the sample no. 1–5.
V[hkl] for the sample no. 1–5. ![[V with combining macron]](https://www.rsc.org/images/entities/i_char_0056_0304.gif) and
and ![[V with combining macron]](https://www.rsc.org/images/entities/i_char_0056_0304.gif) exp,
exp, ![[V with combining macron]](https://www.rsc.org/images/entities/i_char_0056_0304.gif) cal – average crystallite sizes and particle volumes, respectively;
cal – average crystallite sizes and particle volumes, respectively; ![[L with combining macron]](https://www.rsc.org/images/entities/i_char_004c_0304.gif) Ss,b and
Ss,b and ![[L with combining macron]](https://www.rsc.org/images/entities/i_char_004c_0304.gif) Vs,b, – surface- and volume-averaged sizes, respectively
Vs,b, – surface- and volume-averaged sizes, respectively  ;
; ![[L with combining macron]](https://www.rsc.org/images/entities/i_char_004c_0304.gif) Rs,b and
Rs,b and ![[L with combining macron]](https://www.rsc.org/images/entities/i_char_004c_0304.gif) Cs,b recalculated sizes from XRD studies (see Approach #2 and 3, respectively)
Cs,b recalculated sizes from XRD studies (see Approach #2 and 3, respectively)
| Sm. | ![[L with combining macron]](https://www.rsc.org/images/entities/i_char_004c_0304.gif) V[100], nm V[100], nm |
![[L with combining macron]](https://www.rsc.org/images/entities/i_char_004c_0304.gif) V[010], nm V[010], nm |
![[L with combining macron]](https://www.rsc.org/images/entities/i_char_004c_0304.gif) V[001], nm V[001], nm |
![[V with combining macron]](https://www.rsc.org/images/entities/i_char_0056_0304.gif) = = ![[L with combining macron]](https://www.rsc.org/images/entities/i_char_004c_0304.gif) V[100] × V[100] × ![[L with combining macron]](https://www.rsc.org/images/entities/i_char_004c_0304.gif) V[010] × V[010] × ![[L with combining macron]](https://www.rsc.org/images/entities/i_char_004c_0304.gif) V[001] × 106, nm3 V[001] × 106, nm3 |
![[V with combining macron]](https://www.rsc.org/images/entities/i_char_0056_0304.gif) exp = exp = ![[L with combining macron]](https://www.rsc.org/images/entities/i_char_004c_0304.gif) s2 × s2 × ![[L with combining macron]](https://www.rsc.org/images/entities/i_char_004c_0304.gif) b × 106, nm3 b × 106, nm3 |
![[V with combining macron]](https://www.rsc.org/images/entities/i_char_0056_0304.gif) exp = exp = ![[L with combining macron]](https://www.rsc.org/images/entities/i_char_004c_0304.gif) Ss2 × Ss2 × ![[L with combining macron]](https://www.rsc.org/images/entities/i_char_004c_0304.gif) Sb × 106, nm3 Sb × 106, nm3 |
![[V with combining macron]](https://www.rsc.org/images/entities/i_char_0056_0304.gif) exp = exp = ![[L with combining macron]](https://www.rsc.org/images/entities/i_char_004c_0304.gif) Vs2 × Vs2 × ![[L with combining macron]](https://www.rsc.org/images/entities/i_char_004c_0304.gif) Vb 106, nm3 Vb 106, nm3 |
![[V with combining macron]](https://www.rsc.org/images/entities/i_char_0056_0304.gif) cal = cal = ![[L with combining macron]](https://www.rsc.org/images/entities/i_char_004c_0304.gif) Rs2 × Rs2 × ![[L with combining macron]](https://www.rsc.org/images/entities/i_char_004c_0304.gif) Rb × 106, nm3 Rb × 106, nm3 |
![[V with combining macron]](https://www.rsc.org/images/entities/i_char_0056_0304.gif) cal = cal =![[L with combining macron]](https://www.rsc.org/images/entities/i_char_004c_0304.gif) Cs2 × Cs2 × ![[L with combining macron]](https://www.rsc.org/images/entities/i_char_004c_0304.gif) Cb × 106, nm3 Cb × 106, nm3 |
|---|---|---|---|---|---|---|---|---|---|
| 1 | 145(26) | 131(13) | 185(17) | 3.5 | 1.57 | 4.6 | 6.9 | 2.48 | 3.36 |
| 2 | 150(10) | 142(3) | 158(11) | 3.38 | 1.13 | 6.0 | 10.8 | 2.38 | 3.26 |
| 3 | 66(5) | 82(5) | 89(7) | 0.49 | 0.70 | 5.7 | 14.4 | 1.86 | 0.45 |
| 4 | 230(20) | 261(8) | 242(30) | 14.5 | 5.28 | 55 | 103 | 17.4 | 13.0 |
| 5 | 141(5) | 146(15) | 165(7) | 3.1 | 1.47 | 5.1 | 8.7 | 2.63 | 3.12 |
TEM studies
For TEM studies, the powders were sonicated in a mixture of distilled water and ethyl alcohol (∼5–10%) for 5–10 min to separate coalescent particles. The resulting suspension was deposited on a Cu supporting grid covered with a 2–3 nm thin amorphous carbon film. The samples were examined with a JEM TEM at an accelerating voltage of 200 kV. The images were recorded with a 2048 × 2048 pixels Gatan CCD camera. In high-resolution mode the point resolution was 0.14 nm. At least 20 non-overlapping images were recorded for each sample at a magnification of 5000×. The samples contained amorphous carbon and graphene layers covering the LiFePO4 particles. The ordered and amorphous carbon shells were 5 nm and up to 20 nm thick, respectively. Fig. 1 shows fragments of TEM images of LiFePO4 powders for the samples no. 1 and 2, which demonstrated the maximum and minimum size anisotropy, respectively (see Table 1). The quantitative data (Fig. 2) used to construct the particle size distribution histograms were obtained with the Image Tool 2.0 software. The standard errors of the mean particle size were in the range of 1–3 nm.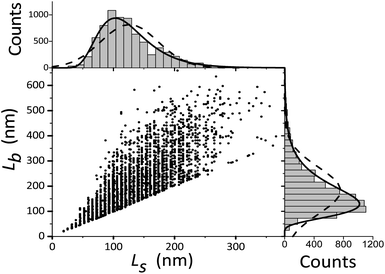 | ||
| Fig. 2 Width Ls and length Lb of LiFePO4 particles in sample no. 1. The corresponding frequency histograms are fitted with lognormal and Gaussian functions (solid and dashed lines, respectively). | ||
Analysis of experimental results
Determination of particle size distribution functions along the crystallographic axes [100], [010], [001] requires several steps of XRD and TEM data processing. For our measurements we used a series of powders with the largest differences in the mean particle sizes. First, the degrees of particle anisotropy and size variance were evaluated. The following 3 Approaches were tried.Approach #1
From both XRD and TEM the volume-averaged crystallite and particle sizes, respectively, can be extracted. If the fraction of mosaic particles is not large, we can assume that all particles have identical shapes, intermediate between that of a rectangular parallelepiped13,41 with truncated edges and of a 3-axis ellipsoid.29 In any case the axes are aligned with the main crystallographic directions. For simplicity, we consider them to be parallelepipeds. Then the mean volume of crystallites is easily obtained by![[V with combining macron]](https://www.rsc.org/images/entities/i_char_0056_0304.gif) =
= ![[L with combining macron]](https://www.rsc.org/images/entities/i_char_004c_0304.gif) V[100] ×
V[100] × ![[L with combining macron]](https://www.rsc.org/images/entities/i_char_004c_0304.gif) V[010] ×
V[010] × ![[L with combining macron]](https://www.rsc.org/images/entities/i_char_004c_0304.gif) V[001]. In Table 1 the arithmetic
V[001]. In Table 1 the arithmetic ![[L with combining macron]](https://www.rsc.org/images/entities/i_char_004c_0304.gif) s2 ×
s2 × ![[L with combining macron]](https://www.rsc.org/images/entities/i_char_004c_0304.gif) b, surface-
b, surface- ![[L with combining macron]](https://www.rsc.org/images/entities/i_char_004c_0304.gif) Ss2 ×
Ss2 × ![[L with combining macron]](https://www.rsc.org/images/entities/i_char_004c_0304.gif) Sb and volume-weighted
Sb and volume-weighted ![[L with combining macron]](https://www.rsc.org/images/entities/i_char_004c_0304.gif) Vs2 ×
Vs2 × ![[L with combining macron]](https://www.rsc.org/images/entities/i_char_004c_0304.gif) Vb mean values are listed. It was assumed that the smaller size of a particle seen in a TEM image was equal to its size along the viewing direction.
Vb mean values are listed. It was assumed that the smaller size of a particle seen in a TEM image was equal to its size along the viewing direction.
It can be seen in Table 1 that the sample no. 3 has the minimum crystallite volume of 0.49 × 10⁶ nm3, sample no. 1, 2, 5 have the medium values of about 3 × 10⁶ nm3; and the sample no. 4 has the largest volume of 14.5 × 10⁶ nm3. These values correlate with the arithmetic mean particle volumes. However, for comparability of TEM and XRD sizes, both should have the same weighting scheme – volume-averaged. In that case no correlation is observed. Even though this approach failed in our study, it can be applicable for particles with a plate-like and needle-like shape.42,43
Approach #2
Using TEM measurements, we first calculate the volume of each particle, Vi = Lis2 × Lib, and then determine the average volume![[V with combining macron]](https://www.rsc.org/images/entities/i_char_0056_0304.gif) . Further, by calculating the ratio
. Further, by calculating the ratio  we can determine the values of
 ![[L with combining macron]](https://www.rsc.org/images/entities/i_char_004c_0304.gif) Rs and
Rs and ![[L with combining macron]](https://www.rsc.org/images/entities/i_char_004c_0304.gif) Rb as
Rb as
 | (1) |
This improves the correlation, especially for the sample no. 3, as seen from Table 1. However, the volumes obtained for the rest of the samples appear smaller than the crystallite volume, which is obviously nonsense, since a coherent domain cannot be larger than a particle size.
Approach #3
To determine the parameters of the particle size distribution functions in LiFePO4 powders along the crystallographic axes [100], [010], [001], the results of XRD measurements are used to estimate the orientation fractions in the ensembles of Ls and Lb. Those fractions are further used to decompose Ls and Lb into components. We continue assuming a rectangular parallelepiped shape of particles (Fig. 3). Using the crystallite sizes measured along the main axes with XRD (Table 1) we estimate the fractions of particle orientations in the ensembles of Lb and Ls and use the recalculated values![[L with combining macron]](https://www.rsc.org/images/entities/i_char_004c_0304.gif) Cb and
Cb and ![[L with combining macron]](https://www.rsc.org/images/entities/i_char_004c_0304.gif) Cs (Table 1) to compare the particle volumes. To estimate
Cs (Table 1) to compare the particle volumes. To estimate ![[L with combining macron]](https://www.rsc.org/images/entities/i_char_004c_0304.gif) Cb and
Cb and ![[L with combining macron]](https://www.rsc.org/images/entities/i_char_004c_0304.gif) Cs we assume that the probability of a crystal facet to be aligned with the object plane of the microscope is proportional to its area. For example, the normalized probability for the (100) facet is given by
Cs we assume that the probability of a crystal facet to be aligned with the object plane of the microscope is proportional to its area. For example, the normalized probability for the (100) facet is given by
P(100) = ![[L with combining macron]](https://www.rsc.org/images/entities/i_char_004c_0304.gif) V[010] × V[010] × ![[L with combining macron]](https://www.rsc.org/images/entities/i_char_004c_0304.gif) V[001]/( V[001]/(![[L with combining macron]](https://www.rsc.org/images/entities/i_char_004c_0304.gif) V[010] × V[010] × ![[L with combining macron]](https://www.rsc.org/images/entities/i_char_004c_0304.gif) V[001] + V[001] + ![[L with combining macron]](https://www.rsc.org/images/entities/i_char_004c_0304.gif) V[100] × V[100] × ![[L with combining macron]](https://www.rsc.org/images/entities/i_char_004c_0304.gif) V[001] + V[001] + ![[L with combining macron]](https://www.rsc.org/images/entities/i_char_004c_0304.gif) V[100] × V[100] × ![[L with combining macron]](https://www.rsc.org/images/entities/i_char_004c_0304.gif) V[010]). V[010]).
| (2) |
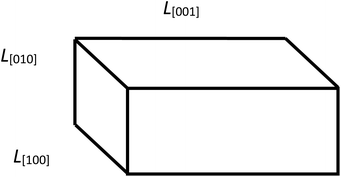 | ||
Fig. 3 Geometric model of a particle with its edge lengths approximately corresponding to those found in the sample no.1: ![[L with combining macron]](https://www.rsc.org/images/entities/i_char_004c_0304.gif) [001] > [001] > ![[L with combining macron]](https://www.rsc.org/images/entities/i_char_004c_0304.gif) [100] > [100] > ![[L with combining macron]](https://www.rsc.org/images/entities/i_char_004c_0304.gif) [010]. [010]. | ||
In the sample no. 1 the average crystallite sizes are unequal: ![[L with combining macron]](https://www.rsc.org/images/entities/i_char_004c_0304.gif) [001] >
[001] > ![[L with combining macron]](https://www.rsc.org/images/entities/i_char_004c_0304.gif) [100] >
[100] > ![[L with combining macron]](https://www.rsc.org/images/entities/i_char_004c_0304.gif) [010]. We assume that
[010]. We assume that ![[L with combining macron]](https://www.rsc.org/images/entities/i_char_004c_0304.gif) Cb for the particle length consists of two parts: one with the size
Cb for the particle length consists of two parts: one with the size ![[L with combining macron]](https://www.rsc.org/images/entities/i_char_004c_0304.gif) V[001] and the probability P(100) + P(010), and the other with the size
V[001] and the probability P(100) + P(010), and the other with the size ![[L with combining macron]](https://www.rsc.org/images/entities/i_char_004c_0304.gif) V[010] and probability P(001). Similarly, the
V[010] and probability P(001). Similarly, the ![[L with combining macron]](https://www.rsc.org/images/entities/i_char_004c_0304.gif) Cs for the particle width consists of two parts: with the size
Cs for the particle width consists of two parts: with the size ![[L with combining macron]](https://www.rsc.org/images/entities/i_char_004c_0304.gif) V[100] and the probability P(001) + P(010) and with the size
V[100] and the probability P(001) + P(010) and with the size ![[L with combining macron]](https://www.rsc.org/images/entities/i_char_004c_0304.gif) V[010] and probability P(100). The values of
V[010] and probability P(100). The values of ![[L with combining macron]](https://www.rsc.org/images/entities/i_char_004c_0304.gif) Cb,
Cb, ![[L with combining macron]](https://www.rsc.org/images/entities/i_char_004c_0304.gif) Cs and the relative fractions Rb, Rs are further used for decomposing the experimental size distribution functions. For the sample no. 1 we can obtain the following values:
Cs and the relative fractions Rb, Rs are further used for decomposing the experimental size distribution functions. For the sample no. 1 we can obtain the following values:
![[L with combining macron]](https://www.rsc.org/images/entities/i_char_004c_0304.gif) Cb = Cb = ![[L with combining macron]](https://www.rsc.org/images/entities/i_char_004c_0304.gif) V[001](P(100) + P(010)) + V[001](P(100) + P(010)) + ![[L with combining macron]](https://www.rsc.org/images/entities/i_char_004c_0304.gif) V[010] × P(001) = 184.7 × 0.727 + 145.4 × 0.273 = 174.1 nm, Rb = 0.727/0.273 = 2.66 V[010] × P(001) = 184.7 × 0.727 + 145.4 × 0.273 = 174.1 nm, Rb = 0.727/0.273 = 2.66
| (3) |
![[L with combining macron]](https://www.rsc.org/images/entities/i_char_004c_0304.gif) Cs = Cs = ![[L with combining macron]](https://www.rsc.org/images/entities/i_char_004c_0304.gif) V[100](P(001) +P(010)) + V[100](P(001) +P(010)) + ![[L with combining macron]](https://www.rsc.org/images/entities/i_char_004c_0304.gif) V[010] × P(100) = 131.3 × 0.619 + 145.4 × 0.320 = 136.7 nm, Rs = 0.619/0.320 = 1.934. V[010] × P(100) = 131.3 × 0.619 + 145.4 × 0.320 = 136.7 nm, Rs = 0.619/0.320 = 1.934.
| (4) |
It can be seen in Table 1 that the volumes calculated by using ![[L with combining macron]](https://www.rsc.org/images/entities/i_char_004c_0304.gif) Cb and
Cb and ![[L with combining macron]](https://www.rsc.org/images/entities/i_char_004c_0304.gif) Cs are close to those calculated from the XRD measurements: the difference is within 10%. Considering the errors of XRD crystallite size determination (Table 1) this can be seen as quite an acceptable agreement. It is essential that the volume-weighted XRD sizes are used here: this ultimately accounts for the rather small error in
Cs are close to those calculated from the XRD measurements: the difference is within 10%. Considering the errors of XRD crystallite size determination (Table 1) this can be seen as quite an acceptable agreement. It is essential that the volume-weighted XRD sizes are used here: this ultimately accounts for the rather small error in ![[L with combining macron]](https://www.rsc.org/images/entities/i_char_004c_0304.gif) Cb and
Cb and ![[L with combining macron]](https://www.rsc.org/images/entities/i_char_004c_0304.gif) Cs. It should be kept in mind that these values are not equal to the parameters of the distribution functions shown in Fig. 2. As discussed below, they are easily calculated from the experimental distributions of Lb, Ls.
Cs. It should be kept in mind that these values are not equal to the parameters of the distribution functions shown in Fig. 2. As discussed below, they are easily calculated from the experimental distributions of Lb, Ls.
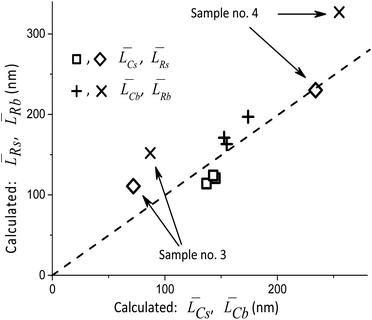
Thus, the main result of the Approach #1 is the validation of XRD measurements and simulations. Fig. 4 illustrates the results of the Approach #2. Although there are significant deviations for the samples with the minimum and maximum average particle sizes, the possibility to rapidly check the adequacy of TEM measurements is certainly useful. Finally, with the Approach #3 the results of XRD measurements are used to determine the fractions Rb and Rs of the orientations [010], [001] and [010], [100] in the distributions of Lb and Ls, respectively. Below we describe their decomposition into two components with the [010] direction being common for both. It should be noted that the types of the size distribution functions along the axes can only be obtained from TEM measurements.
Decomposition of the experimental distributions of Lb, Ls into the distributions of L[100], L[010], L[001]
Fig. 2 shows that the distribution histograms of Ls and Lb are well fitted by lognormal function with mean xc
 | (5) |
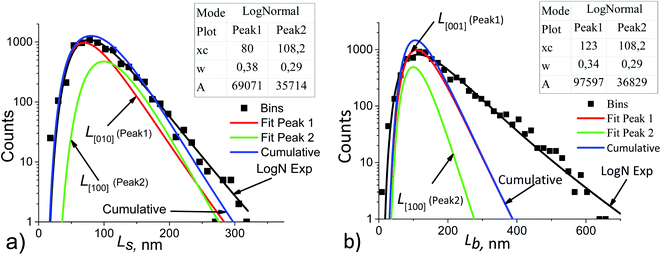 | ||
| Fig. 5 Ls (a) and Lb (b) particle size distribution histograms in sample no. 1 (black points) decomposed into the components. The basic parameters of the resulting LogNormal functions are shown in the insets using the notation of eqn (5). | ||
To make decomposition unique, the following assumptions were taken:
(1) if the Ls and Lb distributions follow lognormal functions, then their components are also lognormal;
(2) the particle growth rate is independent of its size, but depends on the facet orientation and on the technological conditions, e.g., on the stock composition.42 This allows using the averaged values of the fractions Rs and Rb for all points of the Ls and Lb distributions, respectively. For example, in Fig. 5a the following equation is satisfied:
| Rs = A1/A2 = 69071/35714 = 1.934, | (6) |
(3) the coherent domain size is strictly smaller than the particle size due to the possible existence of a mosaic substructure, coalescence of crystallites, internal boundaries with or without amorphous layers. Therefore, the cumulative curves (sums of the components) may not coincide with the functions which approximate the experimental histograms (log![[thin space (1/6-em)]](https://www.rsc.org/images/entities/char_2009.gif) N exp in Fig. 5);
N exp in Fig. 5);
(4) the volume-averaged sizes ![[L with combining macron]](https://www.rsc.org/images/entities/i_char_004c_0304.gif) V can be calculated using L[hkl] obtained from the decomposition of the TEM size distributions Ls и Lb. According to,22–24 the volume-averaged size is equal to the ratio of the fourth and the third moments of the distribution function of the linear (observed) size L
V can be calculated using L[hkl] obtained from the decomposition of the TEM size distributions Ls и Lb. According to,22–24 the volume-averaged size is equal to the ratio of the fourth and the third moments of the distribution function of the linear (observed) size L
 | (7) |
 | (8) |
Table 2 compares the calculation results with of XRD measurements. The similarity in the sizes indicates a satisfactory decomposition;
(5) for the component ![[L with combining macron]](https://www.rsc.org/images/entities/i_char_004c_0304.gif) V[100], the LogN function parameters obtained from decomposition of Ls and Lb, should be the same. This is seen from the comparison of Fig. 5a and b. Uniqueness of the decomposition into lognormal components can be checked as follows. From the properties of lognormal function30 it follows that
V[100], the LogN function parameters obtained from decomposition of Ls and Lb, should be the same. This is seen from the comparison of Fig. 5a and b. Uniqueness of the decomposition into lognormal components can be checked as follows. From the properties of lognormal function30 it follows that
 | (9) |
![[L with combining macron]](https://www.rsc.org/images/entities/i_char_004c_0304.gif) [hkl] and the volume-averaged values
[hkl] and the volume-averaged values ![[L with combining macron]](https://www.rsc.org/images/entities/i_char_004c_0304.gif) V[hkl] are collected in Fig. 6, which also shows a parametric family of the curves for the eqn (8). With the circles, the calculation results for the cumulative distributions are shown. It can be seen that they are closer to the larger contribution in accordance with the values of Rs, Rb;
V[hkl] are collected in Fig. 6, which also shows a parametric family of the curves for the eqn (8). With the circles, the calculation results for the cumulative distributions are shown. It can be seen that they are closer to the larger contribution in accordance with the values of Rs, Rb;
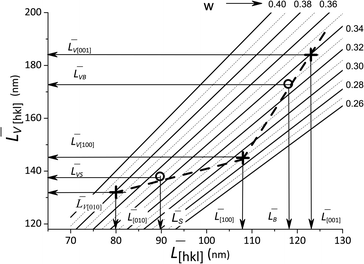 | ||
Fig. 6 Lognormal mean sizes ![[L with combining macron]](https://www.rsc.org/images/entities/i_char_004c_0304.gif) [hkl] obtained by decomposing the TEM histograms into components and the volume-averaged sizes [hkl] obtained by decomposing the TEM histograms into components and the volume-averaged sizes ![[L with combining macron]](https://www.rsc.org/images/entities/i_char_004c_0304.gif) V[hkl] obtained directly from the XRD measurements. The family of straight lines is plotted for different w values (standard deviation of the lognormal function) in eqn (9). V[hkl] obtained directly from the XRD measurements. The family of straight lines is plotted for different w values (standard deviation of the lognormal function) in eqn (9). | ||
(6) boundaries should preferably subdivide particles into mosaic blocks along the [001] direction, since the size ![[L with combining macron]](https://www.rsc.org/images/entities/i_char_004c_0304.gif) [001] is larger than
[001] is larger than ![[L with combining macron]](https://www.rsc.org/images/entities/i_char_004c_0304.gif) [010],
[010], ![[L with combining macron]](https://www.rsc.org/images/entities/i_char_004c_0304.gif) [100]. This explains a larger deviation of the cumulative curve from the experimental one for large particles in the decomposition of Lb, as seen in Fig. 6. However, Table 2 also shows significant deviations for Ls. A detailed quantitative analysis is shown in Fig. 7. Three regions and types of particles are identified: those with a mosaic substructure; with additional crystallites and X-ray-inactive ones, only observed in TEM.
[100]. This explains a larger deviation of the cumulative curve from the experimental one for large particles in the decomposition of Lb, as seen in Fig. 6. However, Table 2 also shows significant deviations for Ls. A detailed quantitative analysis is shown in Fig. 7. Three regions and types of particles are identified: those with a mosaic substructure; with additional crystallites and X-ray-inactive ones, only observed in TEM.
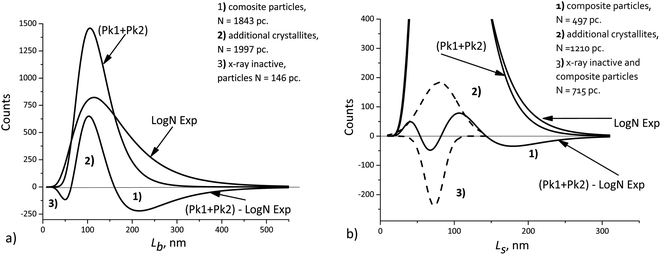 | ||
| Fig. 7 Deviations of the cumulative curve from the experimental ones (LogN Exp): (a) Lb, (b) Ls. The dashed curves – decomposition of the difference curve. | ||
Theoretical studies demonstrated that the mosaic block sizes change in LiFePO4 and FePO4 during cycling due to the motion of edge dislocations,26 and the energy of a boundary depends on the degree of its coherence27 and lithium vacancy fraction.4 A special case is represented by coherent boundaries with superstructures.28 Highly symmetric coherent twin boundaries were found in LiCoO2 (ref. 17), and it was shown that the energies of Li diffusion along and across the boundary were 0.2 eV and 0.4 eV, respectively. Degradation of the LiCoO2 particles associated with the appearance of voids and cracks at the twin boundaries was studied in details in ref. 46.
Finally, we should keep in mind that the accuracy of XRD domain size measurements can typically be limited by anything but the number of particles. At the same time, TEM measurements, even those performed with the use image processing software, seldom involve more than 104 particles. Nevertheless, such a number can be sufficient, because the errors of both methods become comparable in magnitude. This allows detecting small differences, such as those shown in Fig. 7, when the average crystallite sizes obtained from XRD measurements are compared with the sizes obtained from TEM measurements. The interpretation is based on the assumptions about the possible mosaic substructure of particles, and the quantities indicated in Fig. 7 are statistically significant.
Conclusions
XRD and TEM data were combined to obtain the size distribution functions of LiFePO4 particles along the [100], [010] and [001] crystallographic directions.Information on the anisotropy of size-distribution functions can be used to analyze the relations between the battery capacity and the charge–discharge rate.5,6 The fraction of composite (fused) particles consisting of several crystallites can be used to estimate the ion diffusion length along the block boundaries; the activation energy of such diffusion may differ significantly from the bulk values.4,16,27,47
The frequency distribution functions of different particle dimensions Ls and Lb can be decomposed into the components L[hkl] by careful accounting for the anisotropy of crystallites extracted from XRD measurements.
The cumulative L[hkl] curves obtained by summation of the components do not coincide with the experimental curves. The difference between these curves (Fig. 7) can be used to estimate quantitatively the percentage of mosaic particles. In our case large composite particles of LiFePO4 powders registered by TEM with at least 30% amount are recorded by XRD as smaller crystallites with at least 45% amount.
Possible ways of using the obtained results are described in the ESI section,† available from the article site or from the author.
Conflicts of interest
There are no conflicts to declare.Acknowledgements
We express our sincere gratitude to R. A. Suris for his advice and helpful discussions at his seminar. XRD studies were carried in X-ray diffraction Resource Center of St. Petersburg State University. TEM studies were performed with the equipment of the Center for Collective Use “Materials Science and Diagnostics in Advanced Technologies” at the Omsk Regional Center for Collective Use.References
- Z. Ahsan, B. Ding, Z. Cai, C. Wen, W. Yang, Y. Ma and S. Zhang, J. Electrochem. Energy Convers. Storage, 2021, 18, 010801 CrossRef CAS.
- H. Dong and G. M. Koenig, CrystEngComm, 2020, 22, 1514 RSC.
- W. Jiang, M. Wu, F. Liu, J. Yang and T. Feng, RSC Adv., 2017, 7, 44296 RSC.
- C. Schwab, A. Höweling, A. Windmüller, J. Gonzalez-Julian, S. Möller, J. R. Binder, S. Uhlenbruck, O. Guillon and M. Martin, Phys. Chem. Chem. Phys., 2019, 21, 26066 RSC.
- R. Tian, S. H. Park, P. J. King, G. Cunningham, J. Coelho, V. Nicolosi and J. N. Coleman, Nat. Commun., 2019, 10, 1933 CrossRef PubMed.
- N. E. Galushkin, N. N. Yazvinskaya and D. N. Galushkin, J. Electrochem. Soc., 2020, 167, 120516 CrossRef CAS.
- D. A. Cogswell and M. Z. Bazant, Electrochem. Commun., 2018, 95, 33 CrossRef CAS.
- S. Y. Vassiliev, E. E. Levin, D. E. Presnov and V. A. Nikitina, J. Electrochem. Soc., 2019, 66, A829 CrossRef.
- L. Hong, K. Yang and M. Tang, Comput. Mater. Sci., 2019, 5, 118 CAS.
- K. Yang and M. Tang, J. Mater. Chem., 2020, A8, 3060 RSC.
- L. Hong, L. Liang, S. Bhattacharyya, W. Xinga and L. Q. Chena, Phys. Chem. Chem. Phys., 2016, 18, 9537 RSC.
- X. Mu, A. Kobler, D. Wang, V. S. K. Chakravadhanula, S. Schlabach, D. V. Szabo, P. Norby and C. Kubel, Ultramicroscopy, 2016, 170, 10 CrossRef CAS PubMed.
- J. Zhu, J. Fiore, D. Li, N. M. Kinsinger, Q. Wang, E. DiMasi, J. Guo and D. Kisailus, Cryst. Growth Des., 2013, 13, 4659 CrossRef CAS.
- M. Lachal, R. Bouchet, A. Boulineau, S. Surble, C. Rossignol, F. Alloin and S. Obbade, Solid State Ionics, 2017, 300, 187 CrossRef CAS.
- N. V. Kosova and O. A. Podgornova, Chim. Techno Acta, 2015, 4, 326 CrossRef.
- A. M. Abakumov, S. S. Fedotov, E. V. Antipov and J. M. Tarascon, Nat. Commun., 2020, 11, 4976 CrossRef CAS PubMed.
- H. Moriwake, A. Kuwabara, C. A. J. Fisher, R. Huang, T. Hitosugi, Y. H. Ikuhara, H. Oki and Y. Ikuhara, Adv. Mater., 2013, 25, 618 CrossRef CAS PubMed.
- S. Han, J. Park, W. Lu and A. M. Sastry, J. Power Sources, 2013, 240, 155 CrossRef CAS.
- Z. Jiang, J. Li, Y. Yang, L. Mu, C. Wei, X. Yu, P. Pianetta, K. Zhao, P. Cloetens, F. Lin and Y. Liu, Nat. Commun., 2020, 11, 2310 CrossRef CAS PubMed.
- X. Lu, A. Bertei, D. P. Finegan, C. Tan, S. R. Daemi, J. S. Weaving, K. B. O'Regan, T. M. M. Heenan, G. Hinds, E. Kendrick, D. J. L. Brett and P. R. Shearing, Nat. Commun., 2020, 11, 2079 CrossRef CAS PubMed.
- L. Lutterotti and P. Scardi, J. Appl. Crystallogr., 1990, 23, 246 CrossRef CAS.
- J. I. J. Langford and A. J. C. Wilson, J. Appl. Crystallogr., 1978, 11, 102 CrossRef CAS.
- M. Leoni and P. Scardi, J. Appl. Crystallogr., 2004, 37, 629 CrossRef CAS.
- M. Leoni, Int. Tables Crystallogr., 2019, 524 Search PubMed.
- U. Frank, S. E. Wawra, L. Pflug and W. Peukert, Part. Part. Syst. Charact., 2019, 36, 1800554 CrossRef.
- A. R. Balakrishna, Y. M. Chiang and W. C. Carter, Phys. Rev. Mater., 2019, 3, 065404 CrossRef.
- J. Kuriplach, A. Pulkkinen and B. Barbiellini, Condens. Matter, 2019, 4, 80 CrossRef CAS.
- Y. Wen, D. Xiao, X. Liu and L. Gu, NPG Asia Mater., 2017, 9, e360 CrossRef CAS.
- T. Azib, S. Ammara, S. Nowak, S. Lau-Truing, H. Groult, K. Zaghib, A. Mauger and C. M. Julien, J. Power Sources, 2012, 217, 220 CrossRef CAS.
- C. E. Kril and R. Birringer, Philos. Mag. A, 1998, 77, 621 Search PubMed.
- I. A. Ivanishcheva, A. V. Ivanishchev and A. Dixit, Monatsh. Chem., 2019, 150, 489 CrossRef CAS.
- T. Lahrs, International power supply conference and exhibition, French Riviera 2009, pp.1–27 Search PubMed.
- E. N. Kudryavtsev, R. V. Sibiryakov, D. V. Agafonov, V. N. Naraev and A. V. Bobyl, Russ. J. Appl. Chem., 2012, 85, 879 CrossRef CAS.
- A. S. Kamzin, A. V. Bobyl, E. M. Ershenko, E. I. Terukov, D. V. Agafonov and E. N. Kudryavtsev, Phys. Solid State, 2013, 55, 1385 CrossRef CAS.
- E. Ershenko, A. Bobyl, M. Boiko, Y. Zubavichus, V. Runov, M. Trenikhin and M. Sharkov, Ionics, 2017, 23, 2293, DOI:10.1007/s11581-017-2068-z.
- N. C. Popa, J. Appl. Crystallogr., 1998, 31, 176 CrossRef CAS.
- D. Balzar and N. C. Popa, Crystallite size and residual strain/stress modeling in Rietveld refinement. p 125-146, Diffraction analysis of the microstructure of materials, ed. E. J. Mittemeijer and P. Scardi. Springer-Verlag Berlin Heidelberg, 2004, p. 549 Search PubMed.
- N. C. Popa and G. A. Lungu, J. Appl. Crystallogr., 2013, 46, 391 CrossRef CAS.
- L. Lutterotti, S. Matthies and H. R. Wenk, Newsletter, 1999, 21, 14 Search PubMed.
- P. Boullay, L. Lutterotti, D. Chateignera and L. Sicard, Acta Crystallogr., Sect. A: Found. Adv., 2014, 70, 448 CrossRef CAS PubMed.
- D. Jugović, M. Mitrić, M. Kuzmanović, N. Cvjetićanin, S. Marković, S. Škapin and D. Uskoković, Powder Technol., 2012, 219, 128 CrossRef.
- Y. Zhang, J. A. Alarco, A. S. Best, G. A. Snook, P. C. Talbota and J. Y. Nerkara, RSC Adv., 2019, 9, 1134 RSC.
- J. Song and M. Z. Bazant, J. Electrochem. Soc., 2013, 160, A15 CrossRef CAS.
- A. N. Kolmogorov, Dokl. Akad. Nauk SSSR, 1941, 31, 99 Search PubMed.
- R. B. Bergmann and A. Bill, J. Cryst. Growth, 2008, 310, 3135 CrossRef CAS.
- Y. Jiang, P. Yan, M. Yu, J. Li, H. Jiao, B. Zhou and M. Sui, Nano Energy, 2020, 78, 105364 CrossRef CAS.
- A. V. Bobyl, M. E. Gaevski, S. F. Karmanenko, R. N. Kutt, R. A. Suris, I. A. Khrebtov, A. D. Tkachenko and A. I. Morosov, J. Appl. Phys., 1997, 82, 1274 CrossRef CAS.
Footnote |
| † Electronic supplementary information (ESI) available. See DOI: 10.1039/d1ra02102h |
| This journal is © The Royal Society of Chemistry 2021 |


