 Open Access Article
Electrostatic interaction mechanism of visible light absorption broadening in ion-doped graphitic carbon nitride†
Zengyu Cen,
Yuna Kang,
Rong Lu * and
Anchi Yu
 *
*
Department of Chemistry, Renmin University of China, Beijing 100872, P. R. China. E-mail: lurong@ruc.edu.cn; yuac@ruc.edu.cn; Fax: +86-10-6251-6444
First published on 28th June 2021
Abstract
Broadening the light response of graphitic carbon nitride (CN) is helpful to improve its solar energy utilization efficiency in photocatalytic reaction. In this work, a facile synthesis method was developed via the treatment of potassium-doped CN (CN–K) with H2O2 in isopropanol solvent. Various characterizations indicate the basic structure of CN–K treated with H2O2 (CN–K–OOH) resembles that of CN–K, while it presents light absorption up to 650 nm. A series of control experiments and TGA-MS measurements suggest the weak electrostatic attraction between potassium ions and hydroperoxyl groups inside CN–K–OOH is responsible for its enhanced visible light absorption. As a consequence, compared to pristine CN, the photodegradation organic pollutant ability of CN–K–OOH is obviously improved under visible light irradiation (>470 nm). The current synthesis strategy might be universal and it could be applied to other cations.
1. Introduction
Graphitic carbon nitride (CN) has become an important layered semiconductor photocatalyst due to its potential application in photocatalytic fields.1–5 Pristine CN shows light absorption with an absorbance edge up to 460 nm,6 which limits its effective utilization of solar energy. Thus, expanding the visible light absorption range of CN is beneficial to improve its photocatalytic performance.Up to now, there have been several strategies to tune the electronic structure of CN to achieve higher visible light photoactivity.7–14 Among them, doping metal or nonmetal elements into CN has been frequently utilized to prepare modified CN with extended visible light response.12–14 In the case of O-doping, a H2O2 hydrothermal treatment of pristine CN was usually carried out, where H2O2 is used to generate oxygen-containing groups so as to modulate the electronic configuration of O-doped CN.15–21 In 2019, Ge et al. reported a simple H2O2 treatment of Li-doped CN, and the obtained product shows a light absorption extending up to 650 nm.22 However, Li atom doping into CN was suggested to be responsible for the optical property change.22 In 2020, Vu et al. applied H2O2 post-treatment of Fe-doped CN, and they thought that H2O2 not only generated oxygen-functional group but also affected the oxidation state of iron in modified CN.23 The treatment of H2O2 on pristine CN or metal-doped CN could cause the extended visible light absorption of the obtained product, whereas the role of H2O2 in these two cases might be different. Especially, as for the metal-doped CN system treated by H2O2, the role of H2O2 still remains unclear, and the effect of metal ion needs further investigation.
In this work, H2O2 treated K-doped graphitic carbon nitride (CN–K–OOH) was synthesized and the obtained CN–K–OOH presents a visible light absorption up to 650 nm, which is proved be due to the electrostatic attraction between K+ and OOH− inside CN–K–OOH. In detail, K-doped graphitic carbon nitride (CN–K) was firstly prepared through the simple thermal polymerization of melamine and a certain amount of KCl. Then, the as-prepared CN–K was further treated with a little amount of H2O2 in isopropanol (IPA) solvent and the brown product (CN–K–OOH) was finally obtained. The product was characterized by SEM, XRD, FTIR, Raman, XPS, TGA-MS, BET, and electronic as well as electrochemical spectroscopy. Furthermore, a series of control experiments were performed to explore the possible mechanism of visible light absorption broadening in CN–K–OOH. In the end, the photocatalytic performance of CN–K–OOH was evaluated by the photodegradation of methylene blue (MB) under the visible light irradiation (>420 nm and >470 nm). In addition, the characterization data of CN and CN–K are also displayed in all Figures and Tables for comparisons.
2. Experimental
2.1. Materials
Melamine (>99.0%) was purchased from Sigma-Aldrich. Potassium chloride (KCl, ≥ 99.0%) was purchased from Alfa Aesar. Isopropanol (IPA, ≥ 99.5%) was purchased from Aladdin. H2O2 (≥30 wt%) was purchased from Sinopharm Chemical Reagent Co., Ltd. Pure water (18 MΩ cm) was obtained through a Milli-Q water purification system (Millipore, Billerica, MA, USA). All other reagents used in this work were analytically pure and used as received without further purification.2.2. Synthesis of graphitic carbon nitride (CN)
The pristine CN was synthesized according to the literature for ref. 24. Typically, 1.5 g melamine was placed in an alumina crucible with a cover within a muffle furnace, heated to 550 °C with a 2 °C min−1 ramping rate, held for 4 h in an open air atmosphere, and then cooled naturally to room temperature. The as-prepared product was ground into fine powder for further use.2.3. Synthesis of K-doped carbon nitride treated with H2O2 (CN–K–OOH)
Melamine (1.5 g) and KCl (1.5 g) were fully dissolved in 100 mL H2O at 80 °C and then the mixture solution was dried at 100 °C to evaporate water. The as-prepared powder was then placed in an alumina crucible with a cover, heated to 550 °C with a 2 °C min−1 ramping rate in a muffle furnace and held for 4 h. The obtained sample was washed several times with boiling water, dried at 60 °C in a vacuum oven for 24 h, and the yellow powder was obtained, which is denoted as CN–K. 100 mg CN–K together with 0.25 mL H2O2 were dispersed in 50 mL IPA under an oil bath at 80 °C (near the boiling point of IPA 83 °C), and then stirred for 50 min with a water reflux condenser. The obtained precipitation was separated by centrifugation, washed with pure water for several times, and then dried at 60 °C in a vacuum oven for 24 h. The brown final product was labeled as CN–K–OOH.2.4. Characterizations
Powder X-ray diffraction (XRD) was measured on a Shimadzu XRD-7000 diffractometer with Cu radiation (λ = 1.54056 Å). The Fourier transformed-infrared (FTIR) spectra were collected on a Bruker Tensor 27 spectrometer. Raman spectra were obtained using a Fourier-transformed Raman spectrometer (laser source 1064 nm, Vertex 70v&RAM II, Bruker). X-ray photoelectron spectroscopy (XPS) was adopted by a Thermo ESCALab250Xi electron spectrometer (Thermo Scientific) with Al radiation source. The C 1s peak (284.8 eV) was referenced for all binding energy. Scanning electron microscopy (SEM) images were obtained using a Hitachi SU8010 scanning electron microscope to characterize the morphologies of the synthesized samples, and their element mappings as well as chemical compositions were measured by a SEM energy dispersive spectrometer (SEM-EDS). The UV-Vis diffuse reflectance spectra (UVDRS) of the samples were recorded on a Shimadzu UV-2600 spectrophotometer. A UV-Vis near infrared spectrophotometer (FLS980, Edinburgh) was used to measure the fluorescence spectra and fluorescence lifetimes (375 nm excitation and 470 nm detection) of the samples. The Brunauer–Emmett–Teller (BET) surface areas of the samples were determined with a MicrotracBEL Belsorp-Mini II equipment through measuring its N2 adsorption–desorption isotherm at 77 K.Electrochemical Mott–Schottky measurement was performed on an electrochemical workstation (CHI-660D, Shanghai Chenhua) with a conventional three-electrode cell. A Pt wire was used as a counter electrode, and Ag/AgCl (3 M KCl) was used as a reference electrode. To fabricate the working electrode, 10 mg of sample was dispersed in a 200 μL Nafion solution (5%) to get slurry, and the as-prepared slurry was dropped onto the platinum-carbon electrode, and subsequently dried under an infrared lamp. Na2SO4 aqueous solution (0.5 M) was used as the electrolyte solution.
2.5. Thermogravimetric analysis-mass measurement
Thermogravimetric analysis-mass spectrometer (TGA-MS) was utilized to record the TGA-MS profiles of the samples on a thermogravimetric analyzer (STA449F3, Netzsch) connected to a quadrupole mass spectrometer (QMS403-C, Netzsch). The pyrolysis procedure is as the following: under a argon atmosphere, the initial heating rate was set at 20.00 °C min−1 up to a temperature of 340.00 °C with a hold time of 1 min; then the heating rate was changed to 0.50 °C min−1 up to a temperature of 360.00 °C; and finally, the heating rate was again set at 20 °C min−1 up to a temperature of 800.00 °C. The gaseous phase volatiles released from the thermal decomposition of the sample in TGA were introduced into the MS. The MS was operated under a vacuum to detect the intensity of the characteristic fragment species from the volatiles according to their respective mass to charge ratios (m/z).2.6. Photocatalytic test for methylene blue photodegradation
The photocatalytic degradation of aqueous methylene blue (MB) solution was carried out in a Pyrex double-jacket reactor. The irradiation light source was supplied by a 300 W PLS-SXE300 xenon lamp with a long wavelength band-pass filter (λ ≥ 420 nm or λ ≥ 470 nm). A water bath connected with a pump was used to maintain the reaction temperature at 25 °C, and a magnetic stirrer was used to keep the photocatalyst dispersed homogeneously in the reaction solution. Typically, 20 mg as-prepared photocatalyst was added into 100 mL of MB solution (10 mg L−1) and stirred for 30 min in the dark for adsorption desorption equilibrium, after that the light irradiation was immediately switched on. The clear solution of MB was measured at a particular time interval on the Shimadzu UV-3600 spectrophotometer. The MB photodegradation was monitored as the decrease of the dye concentration over irradiation time. I and I0 are the measured at 665 nm absorbance of the dye in the solution, which are proportional to the dye concentrations in the solution (C and C0).3. Results and discussion
Fig. 1a shows the UVDRS spectra of CN, CN–K and CN–K–OOH, and their respective photographs are also presented in the inset. CN and CN–K present similar UVDRS plots and colors (Fig. 1a), which implying no obvious electronic spectral change after K doping. Compared to CN and CN–K, the absorption spectrum of CN–K–OOH exhibits an obvious Urbach tail25,26 extending till 650 nm, which is consistent with its digital photos as shown in the inset of Fig. 1a. In order to know whether there is any morphology change after H2O2 treatment or not, CN–K–OOH together with CN and CN–K were investigated with SEM as shown in Fig. 1b–d. It is clear that both CN–K–OOH and CN–K exhibit less condensed lamellar structure than that of CN.15 Furthermore, it can be seen that the morphology of CN–K–OOH is almost as same as that of CN–K, which means H2O2 treatment has negligible influence on the morphology of CN–K. The SEM C, N, O and K element mapping images of CN–K–OOH are shown in Fig. S1,† indicating that the four elements uniformly coexist in the entire sample region. We also try to obtain the Cl element mapping image, but it is undetected. The chemical compositions of CN, CN–K and CN–K–OOH are listed in Table S1.† From the data listed in Table S1,† it is found that K content of CN–K–OOH is close to that of CN–K, which indicates H2O2 treatment will not cause the loss of K element.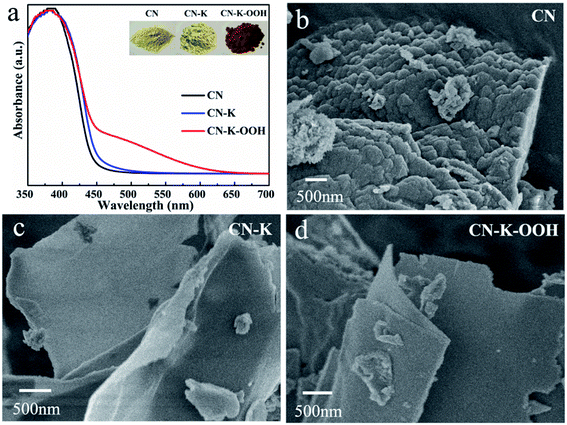 | ||
| Fig. 1 UVDRS spectra (a) and SEM images (b–d) of CN, CN–K and CN–K–OOH. Inset of (a) shows the photographs of CN, CN–K and CN–K–OOH. | ||
The crystal structures of CN, CN–K and CN–K–OOH were examined by XRD spectroscopy as shown in Fig. 2a. There are two diffraction peaks at around 13.1° and 27.4° for CN, representing the intralayer long-range order packing (100) and interlayer stacking (002), respectively.3 The intensities of both peaks heavily decrease for either CN–K or CN–K–OOH, suggesting the reduced crystallinity after K doping. And the (002) peak shifts to 27.9°, while the (100) peak is almost disappeared, indicating the interlayer distance of the (002) plane is reduced and the intralayer structure is destroyed after K doping.27 Furthermore, as shown in Fig. 2a, it is clear that the XRD pattern of CN–K–OOH is almost identical to that of CN–K, implying H2O2 treatment has no effect on the crystal structure of CN–K–OOH.
The chemical structures of CN, CN–K and CN–K–OOH were further examined by FTIR (Fig. 2b) and Raman (Fig. 2c) spectroscopy. In Fig. 2b, the bands at 808 cm−1 and 1200–1800 cm−1 respectively correspond to the triazine units and the aromatic CN heterocycles of CN.28 Compared to pristine CN, there are four extra peaks at 573 cm−1, 998 cm−1, 1150 cm−1 and 2177 cm−1 appearing in the FTIR spectra of CN–K and CN–K–OOH, and their appearance are ascribed to the K doping in CN–K and CN–K–OOH. The peak at 573 cm−1 is assigned to K–N bond,29 and the peaks at 998 cm−1 and 1150 cm−1 are assigned as C–O vibrations, and the peak at 2177 cm−1 originates from cyano group (–C![[triple bond, length as m-dash]](https://www.rsc.org/images/entities/char_e002.gif) N).28 Besides, the N–H stretching mode locates at 3000–3300 cm−1, and O–H stretching mode locates at 3300–3600 cm−1.28 Compared to CN, CN–K and CN–K–OOH both present increasing intensity of O–H vibration, while the intensity of the O–H mode for CN–K–OOH changes little after H2O2 treatment.
N).28 Besides, the N–H stretching mode locates at 3000–3300 cm−1, and O–H stretching mode locates at 3300–3600 cm−1.28 Compared to CN, CN–K and CN–K–OOH both present increasing intensity of O–H vibration, while the intensity of the O–H mode for CN–K–OOH changes little after H2O2 treatment.
As for the Raman spectra of CN, CN–K and CN–K–OOH shown in Fig. 2c, the bands at 478 cm−1, 708 cm−1, 726 cm−1, 752 cm−1, 980 cm−1 and 1030–1700 cm−1 are respectively related to the triazine units and the aromatic CN heterocycles of CN.30,31 Compared to CN, there are two extra peaks locating at 432 cm−1 and 2177 cm−1 in the Raman spectra of CN–K and CN–K–OOH. The peak at 2177 cm−1 is arising from cyano group, which is consistent to the FTIR data in Fig. 2b. As shown in Fig. 2b and c, the FTIR spectra of CN–K and CN–K–OOH show almost no differences before and after H2O2 treatment, as similarly as the Raman spectra of CN–K and CN–K–OOH do, which again verify that H2O2 treatment of CN–K has no impact on the chemical structure variation of CN–K–OOH.
In order to further check the effect of H2O2 on CN–K–OOH, the element chemical states of CN, CN–K and CN–K–OOH are also analyzed by XPS spectroscopy as shown in Fig. 3. In Fig. 3, each plot is normalized with the area of the respective N 1s 398.9 eV band.32 The C 1s spectrum (Fig. 3a) for CN contains three components at 284.8, 286.1 and 288.3 eV, corresponding to the adventitious carbon, C–NHx (amino group), N–C![[double bond, length as m-dash]](https://www.rsc.org/images/entities/char_e001.gif) N coordination, respectively.33 The N 1s spectrum (Fig. 3b) can be deconvoluted into three peaks at 398.8 eV, 400.1 eV, 401.2 eV, which are assigned to the N species in C
N coordination, respectively.33 The N 1s spectrum (Fig. 3b) can be deconvoluted into three peaks at 398.8 eV, 400.1 eV, 401.2 eV, which are assigned to the N species in C![[double bond, length as m-dash]](https://www.rsc.org/images/entities/char_e001.gif) N–C, N–(C)3 and N–H in CN.33 As shown in Fig. 3a and b, both C 1s and N 1s XPS spectra of CN–K–OOH exhibit little change when compared to that of CN–K, which suggests the main chemical structure of CN–K–OOH is still kept after H2O2 modification. Furthermore, Fig. 3c presents the O 1s spectrum with binding energy at 530.9, 532.5 eV and 533.9 eV.15 The 533.9 eV peak is ascribed to the adsorbed O2, the 532.5 eV peak is ascribed to the adsorbed H2O or H2O2, and the 530.8 eV peak might be related to C–OH group,15,28 which is in agreement with the presence of C–OH vibration in the FTIR spectrum of CN–K or CN–K–OOH (Fig. 2b). Besides, as shown in Fig. 3c, it is obvious that the area of 532.5 eV peak in O 1s XPS spectrum for CN–K–OOH is larger than that of CN–K, suggesting more O content in CN–K–OOH. The element composition from XPS displayed in Table S2† shows K content has no obvious change after H2O2 treatment, which is consistent to the results of the above SEM-EDS displayed in Table S1.† In addition, Fig. 3d presents a typical K 2p XPS spectrum with two peaks at 293.0 and 295.7 eV for CN–K as well as CN–K–OOH, and it is found the K 2p XPS spectrum of CN–K–OOH is almost identical to of CN–K, which suggests there is no big change for the chemical environment surrounding K+ after H2O2 treatment.
N–C, N–(C)3 and N–H in CN.33 As shown in Fig. 3a and b, both C 1s and N 1s XPS spectra of CN–K–OOH exhibit little change when compared to that of CN–K, which suggests the main chemical structure of CN–K–OOH is still kept after H2O2 modification. Furthermore, Fig. 3c presents the O 1s spectrum with binding energy at 530.9, 532.5 eV and 533.9 eV.15 The 533.9 eV peak is ascribed to the adsorbed O2, the 532.5 eV peak is ascribed to the adsorbed H2O or H2O2, and the 530.8 eV peak might be related to C–OH group,15,28 which is in agreement with the presence of C–OH vibration in the FTIR spectrum of CN–K or CN–K–OOH (Fig. 2b). Besides, as shown in Fig. 3c, it is obvious that the area of 532.5 eV peak in O 1s XPS spectrum for CN–K–OOH is larger than that of CN–K, suggesting more O content in CN–K–OOH. The element composition from XPS displayed in Table S2† shows K content has no obvious change after H2O2 treatment, which is consistent to the results of the above SEM-EDS displayed in Table S1.† In addition, Fig. 3d presents a typical K 2p XPS spectrum with two peaks at 293.0 and 295.7 eV for CN–K as well as CN–K–OOH, and it is found the K 2p XPS spectrum of CN–K–OOH is almost identical to of CN–K, which suggests there is no big change for the chemical environment surrounding K+ after H2O2 treatment.
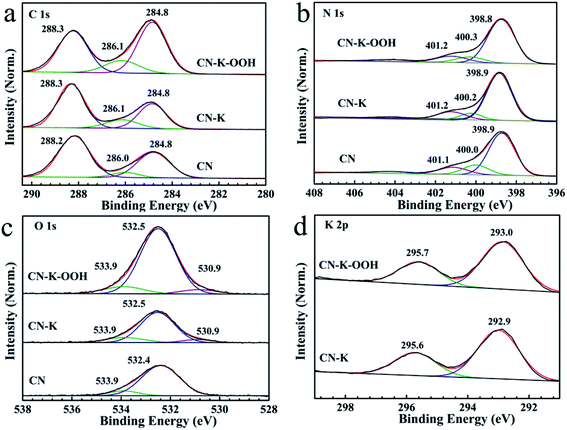 | ||
| Fig. 3 XPS spectra of C 1s (a), N 1s (b), O 1s (c), and K 2p (d) for CN, CN–K and CN–K–OOH. All XPS spectra are normalized with the area of the respective N 1s 398.9 eV band. | ||
From above characterizations, it is known that CN–K–OOH still maintains the structure after H2O2 treatment, while it presents significantly enhanced visible light absorption. To investigate the mechanism causing the optical property change after H2O2 treatment, a series of control experiments including TGA-MS were carried out. Fig. S2† shows the photographs of CN–K–OOH, the heated CN–K–OOH at 350 °C and the retreated CN–K–OOH. It is found that CN–K–OOH faded after heating at 350 °C, whereas its color restored when treated with H2O2 again in IPA solvent, which suggests a reversible process during heating and retreating process. The similar reversible process was also reported in layered TiO2 where the H2O2 treated layered TiO2 presents yellow color.34 Then a TGA-MS measurement was performed to explore the heating reversible characteristic occurring in CN–K–OOH.
Fig. 4(a, b) shows the TGA thermogram, the derivative weight loss curve and TGA-MS spectrogram of CN–K–OOH. For comparison, the TGA thermogram, the derivative weight loss curve and TGA-MS spectrogram of CN–K are also displayed in Fig. 4(c, d). As shown in Fig. 4a and b, both TGA profiles of CN–K and CN–K–OOH present an initial about 8% weight loss before 200 °C due to the desorption of water.35 Furthermore, as shown in Fig. 4a, there is another obviously thermal event occurring at 340–360 °C with a corresponding 1% weight loss for CN–K–OOH, indicating a thermal decomposition at the temperature range of 340–360 °C. The thermal decomposition temperature of 340–360 °C is consistent to the fading temperature of 350 °C in the above heating control experiment (Fig. S2†). But the thermal decomposition at 340–360 °C is negligible for CN–K as shown in Fig. 4c. To analysis the thermal decomposition products, mass spectrogram in Fig. 4b presents the fragment species of the volatiles produced from CN–K–OOH during pyrolysis. It is found that a major amount of species with m/z = 17 and a much minor amount of species with m/z = 33 appear in the mass spectrogram of CN–K–OOH.
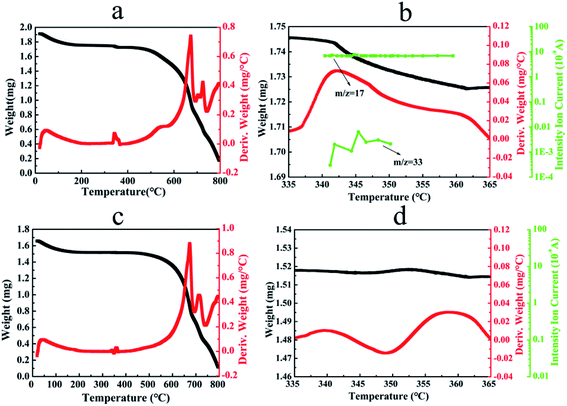 | ||
| Fig. 4 TGA thermograms (black line), the derivative weight loss profiles (red line) and TGA-MS spectrograms (green line) of CN–K–OOH (a, b) and CN–K (c, d). | ||
As for m/z = 17 species, they might be OH ion or NH3 species. Since there are negligible volatiles from CN–K during pyrolysis at 340–360 °C as shown in Fig. 4c and d, and no structure change happens for CN–K–OOH after H2O2 treatment from above measurements, indicating that the m/z = 17 species are not NH3, which is the released gas during the polymerization of CN. Then the m/z = 17 species is assigned as OH ions. In addition, since H2O molecules are very stable, H2O species (m/z = 18) would be the main contribution to the fragment species from TGA-MS measurement. However, there is no detectable H2O species from the mass spectrogram of CN–K–OOH as shown in Fig. 4b. Thus, the OH ions should originate from H2O2 molecules releasing from CN–K–OOH. Besides, the minor amount species with m/z = 33 might be assigned as OOH ion which also arises from H2O2. Therefore, combined with the above heating and retreating experiments, it is concluded that H2O2 plays a key role in determining the optical property of CN–K–OOH.
Next, another control experiment was done. Fig. S3† shows the photographs of the prepared CN–K–OOH at pH = 2, 4, 7 and 9, respectively. It is obvious that CN–K–OOH presents brown color when treated with alkaline H2O2 solution and no color variation when treated with acidic H2O2 solution. Under alkaline condition, OOH− are the major species in H2O2 solution (H2O2 + OH− → OOH− + H2O),36 which would insert into CN–K and cause the absorption enhancement of CN–K–OOH in the visible light region. In addition, the experiment in aqueous H2O2 solution without IPA was tested, and the obtained sample presents no color change compared to pristine CN, which implying lots of water molecules are not helpful to generate CN–K–OOH. Furthermore, the H2O2 treatment of CN instead of CN–K was also tested, and the obtained sample presents no extended visible light absorption, which implying K+ is necessary to obtain CN–K–OOH. This observation is inconsistent with the phenomenon of H2O2 hydrothermal treatment of CN in literatures,15–21 possibly because hydrothermal treatment is more intense than the simple H2O2 treatment applied in the current work.
Combined with the above control experiments and the TGA-MS measurements, a schematic representation of the formation and retreatment process of CN–K–OOH is proposed as shown in Scheme 1. Firstly, the adsorbed H2O molecules of the prepared CN–K are captured by IPA molecules, and then OOH− in H2O2 solution inserts into CN–K under the electrostatic attraction force of K cations, and the brown color CN–K–OOH forms. Upon heating CN–K–OOH at 350 °C, OOH− releases from CN–K–OOH as a neutral H2O2 form, and CN–K–OOH fades and restores to CN–K. When retreat the heated CN–K–OOH with H2O2 in IPA solvent, CN–K–OOH recovers.
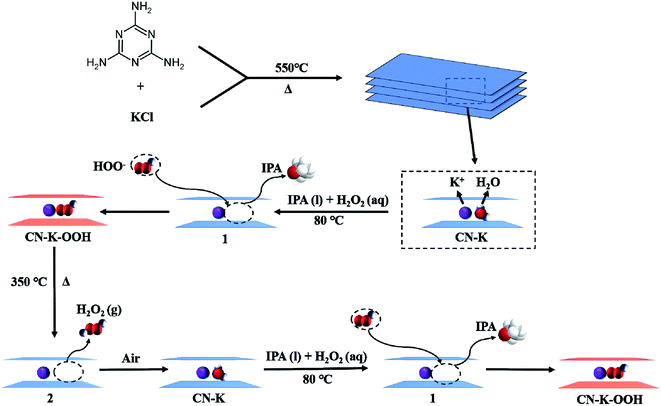 | ||
| Scheme 1 Schematic representation of the formation and retreatment process of CN–K–OOH. 1 and 2 denote the proposed intermediates. | ||
The FTIR spectra of the heated CN–K–OOH and the retreated CN–K–OOH together with CN, CN–K and CN–K–OOH are displayed in Fig. S4.† Here 1150 cm−1 peak has been assigned as C–O vibration. It is found that the 1150 cm−1 peak becomes stronger for CN–K and the heated CN–K–OOH compared to CN–K–OOH and the retreated CN–K–OOH. Thus, it is suggested that the intermolecular hydrogen bonds are formed between OOH− and C–O, and C–O vibration will become stronger when OOH− releasing from CN–K–OOH during heating. Thus, according to TGA-MS data, the control experiments and the FTIR results, a proposed structure of CN–K–OOH is displayed in Scheme 2 from both top and side view. It is suggested that the electrostatic attraction between K+ and OOH− as well as the intermolecular hydrogen bond inside CN–K–OOH would cause the charge redistribution of CN–K–OOH to enhance its visible light absorption, which is different from the proposed O-doping mechanism in H2O2 hydrothermal treatment of pristine CN,15–21 and also different from the suggested cation-determining mechanism in previous reports.22,23 The present experimental results call for support from theoretical simulation work.
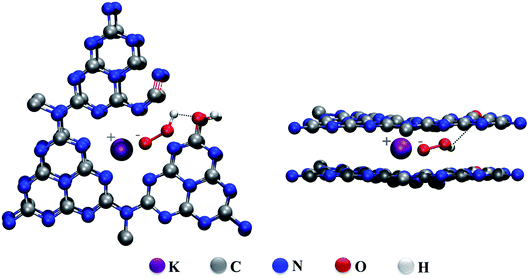 | ||
| Scheme 2 Illustration of the proposed structures for CN–K–OOH from side view (left) and top view (right). | ||
Since OOH− species exist inside CN–K–OOH from the above conclusion, its O–O vibrations would present in the Raman spectrum of CN–K–OOH. However, there are no O–O vibrations at 870 cm−1 (ref. 37) appearing in the Raman spectrum of CN–K–OOH as shown in Fig. 3c. Then we designed a control experiment to examine the reason. Through mixing 10 mg CN–K and 0.2 mg H2O2 as well as 10 mg CN–K and 3 mg H2O2, and then drying the mixtures at room temperature, CN–K + 2% H2O2 and CN–K + 30% H2O2 were obtained. Fig. S5† presents the Raman spectra of CN–K–OOH, CN–K + 2% H2O2 and CN–K + 30% H2O2. It can be seen that the O–O vibrations appear in the Raman spectrum of CN–K + 30% H2O2 but not in the Raman spectrum of CN–K + 2% H2O2. Therefore, the absence of O–O vibrations in the Raman spectrum of CN–K–OOH might be due to too low amount of OOH− to be detectable, which is also consistent to the above result about 1% weight loss from TGA data of CN–K–OOH as shown in Fig. 4a.
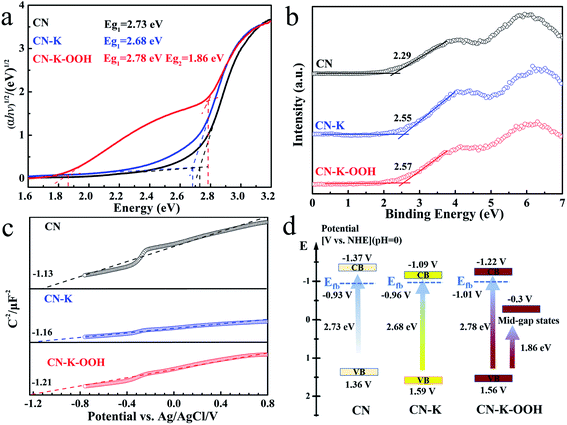
From above analysis, it is known that the inserted OOH− causes the charge redistribution of CN–K–OOH which promoting its absorption in the visible light region. The electronic band structure of CN–K–OOH was explored through combining the optical bandgap, the flat band potential, and the valence band of CN–K–OOH as shown in Fig. 5. Fig. 5a shows the Tauc plots of CN, CN–K and CN–K–OOH transformed from their respective UVDRS in Fig. 1,38 and the estimated band-gap widths are also presented. It is found that CN–K and CN–K–OOH possess the similar intrinsic absorption bandgap as that of CN, while CN–K–OOH presents an extra bandgap around 1.86 eV. Fig. 5b presents the valence band XPS plots and the derived VB values of CN, CN–K and CN–K–OOH. Fig. 5c presents the Mott–Schotty plots of CN, CN–K and CN–K–OOH and the derived flat band potentials are also displayed. Combining the flat band potentials and VB values of each sample, the corresponding valence band maximum of each sample is deduced. Further combining the respective optical bandgap width in Fig. 5a, the valence band minimum of each sample is also derived.39,40 Then a schematic illustration of the electronic band structure is drawn as shown in Fig. 5d. As shown in Fig. 5d, unlike CN and CN–K, CN–K–OOH possesses a mid-gap state appearing in its electronic band structure, which correlates to the Urbach tail shown in the UVDRS spectrum of CN–K–OOH in Fig. 1a.
The fluorescence emissions and fluorescence decays of CN, CN–K and CN–K–OOH were also measured as shown in Fig. S6,† and the fluorescence decay fitting parameters are listed in Table S3.† Here the fluorescence decay lifetime of CN is consistent with the previous report.41,42 Compared to CN–K, CN–K–OOH presents less fluorescence emission and shorter fluorescence decay lifetime, which indicates an extra interaction existing in CN–K–OOH, and also consistent with the FTIR measurement (Fig. S4†).
More importantly, the adjustment of the amount of KCl (0.3 g) to prepare CN–K (0.3 g KCl)–OOH with pale brown color and the replacement of KCl with NaCl or CaCl2 to prepare CN–Na–OOH or CN–Ca–OOH were also investigated (Fig. S7 and S8†). All results imply that the current synthesis route might be universal and it could be applied to other cations.
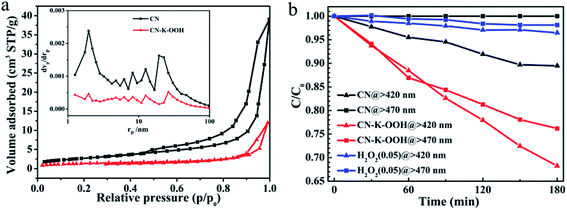
In the end, BET measurements are performed to obtain the specific surface area and pore structure of CN and CN–K–OOH as shown in Fig. 6a, and the extracted data are displayed in Table S4.† The BET measurement shows that the specific surface area of CN–K–OOH is around 5 m2 g−1, which is a little less than that of CN (9.97 m2 g−1). The specific surface area of CN is consistent with the previous report.24,42 The photocatalytic activity of CN and CN–K–OOH was evaluated by degradation of MB under λ > 420 nm as well as λ > 470 nm illumination as shown in Fig. 6b. Since H2O2 has the ability to photo-decompose organic compound,43 the residual H2O2 in CN–K–OOH contributed to the degradation of MB was tested as shown in Fig. 6b, which indicating the negligible effect of the residual H2O2 in CN–K–OOH. As for the specific surface area of CN–K–OOH is comparable to that of CN, the specific surface area effect on their respective photodegradation activity is excluded. Then, as shown in Fig. 6b, compared to pristine CN, CN–K–OOH has higher photodegradation ability under λ > 420 nm light irradiation, and moreover, it is even able to degrade MB under λ > 470 nm light irradiation.
4. Conclusions
In summary, we have developed a facial method to prepare K-doped carbon nitride (CN–K) treated with H2O2 (CN–K–OOH), which maintains the basic structure of CN–K while presents a broader light absorption up to 650 nm. Control experiments and TGA-MS measurements reveal that there exists weak electrostatic attraction between K+ and OOH− inside CN–K–OOH which causes a mid-gap state for CN–K–OOH. As a result, compared to pristine CN, the as-prepared CN–K–OOH is able to degrade MB even under visible light >470 nm irradiation. The current synthesis method would be applied to other cations, and hence our finding will open a new avenue to synthesize efficient CN for photocatalytic application.Conflicts of interest
There are no conflicts to declare.Acknowledgements
This work was supported by the National Natural Science Foundation of China (21773306). R. Lu thanks Prof. Zili Chen for the helpful discussion about the formation mechanism.References
- Y. Wang, X. C. Wang and M. Antonietti, Angew. Chem., Int. Ed., 2012, 51, 68–89 CrossRef CAS PubMed.
- Y. Zheng, J. Liu, J. Liang, M. Jaroniec and S. Z. Qiao, Energy Environ. Sci., 2012, 5, 6717–6731 RSC.
- S. W. Cao, J. X. Low, J. G. Yu and M. Jaroniec, Adv. Mater., 2015, 27, 2150–2176 CrossRef CAS PubMed.
- T. S. Miller, A. B. Jorge, T. M. Suter, A. Sella, F. Cora and P. F. McMillan, Phys. Chem. Chem. Phys., 2017, 19, 15613–15638 RSC.
- W. J. Ong, L. L. Tan, Y. H. Ng, S. T. Yong and S. P. Chai, Chem. Rev., 2016, 116, 7159–7329 CrossRef CAS PubMed.
- X. C. Wang, K. Maeda, A. Thomas, K. Takanabe, G. Xin, J. M. Carlsson, K. Domen and M. Antonietti, Nat. Mater., 2009, 8, 76–80 CrossRef CAS PubMed.
- N. N. Zhang, L. Wen, J. Y. Yan and Y. Liu, Chem. Pap., 2020, 74, 389–406 CrossRef CAS.
- A. Y. Meng, Z. Y. Teng, Q. T. Zhang and C. L. Su, Chem.–Asian J., 2020, 15, 3405–3415 CrossRef CAS PubMed.
- A. Kumar, P. Raizada, A. Hosseini-Bandegharaei, V. K. Thakur, V. Nguyen and P. Singh, J. Mater. Chem. A, 2021, 9, 111–153 RSC.
- S. J. A. Moniz, S. A. Shevlin, D. J. Martin, Z. X. Guo and J. W. Tang, Energy Environ. Sci., 2015, 8, 731–759 RSC.
- M. Z. Rahman, K. Davey and C. B. Mullins, Adv. Sci., 2018, 5, 1800820 CrossRef PubMed.
- L. Zhou, H. Zhang, H. Sun, S. Liu, M. O. Tade, S. Wang and W. Jin, Catal.: Sci. Technol., 2016, 6, 7002–7023 RSC.
- L. Jiang, X. Yuan, Y. Pan, J. Liang, G. Zeng, Z. Wu and H. Wang, Appl. Catal., B, 2017, 217, 388–406 CrossRef CAS.
- X. Liu, R. Ma, L. Zhuang, B. Hu, J. Chen, X. Liu and X. Wang, Crit. Rev. Environ. Sci. Technol., 2020, 173443 Search PubMed.
- J. Li, B. Shen, Z. Hong, B. Lin, B. Gao and Y. Chen, Chem. Commun., 2012, 48, 12017–12019 RSC.
- G. H. Dong, Z. H. Ai and L. Z. Zhang, RSC Adv., 2014, 4, 5553–5560 RSC.
- Y. Guan, S. Hu, G. Gu, G. Lu, X. Yuan and J. Bai, Nano, 2020, 15, 2050083 CrossRef CAS.
- P. Praus, A. Smykalova, K. Foniok and V. Matejka, Nanomater, 2020, 10, 1747 CrossRef CAS PubMed.
- S. Liu, D. Li, H. Sun, H. M. Ang, M. O. Tade and S. Wang, J. Colloid Interface Sci., 2016, 468, 176–182 CrossRef CAS PubMed.
- G. Marci, E. I. Garcia-Lopez, F. R. Pomilla, L. Palmisano, A. Zaffora, M. Santamaria, I. Krivtsov, M. Ilkaeva, Z. Barbierikova and V. Brezova, Catal. Today, 2019, 328, 21–28 CrossRef CAS.
- Q. Li, S. C. Wang, Z. X. Sun, Q. J. Tang, Y. Q. Liu, L. Z. Wang, H. Q. Wang and Z. B. Wu, Nano Res., 2019, 12, 2749–2759 CrossRef CAS.
- Z. T. Ge, A. C. Yu and R. Lu, Mater. Lett., 2019, 250, 9–11 CrossRef CAS.
- V. Viet Thang, S. Bartling, T. Peppel, H. Lund, C. Kreyenschulte, J. Rabeah, N. G. Moustakas, A. E. Surkus, T. Hong Duc and N. Steinfeldt, Colloids Surf., A, 2020, 589, 124383 CrossRef.
- H. H. Ou, L. H. Lin, Y. Zheng, P. J. Yang, Y. X. Fang and X. C. Wang, Adv. Mater., 2017, 29, 1700008 CrossRef PubMed.
- F. Urbach, Phys. Rev., 1953, 92, 1324 CrossRef CAS.
- W. G. Tu, Y. Xu, J. J. Wang, B. W. Zhang, T. H. Zhou, S. M. Yin, S. Y. Wu, C. M. Li, Y. Z. Huang, Y. Zhou, Z. G. Zou, J. Robertson, M. Kraft and R. Xu, ACS Sustainable Chem. Eng., 2017, 5, 7260–7268 CrossRef CAS.
- Y. L. Yang, S. C. Wang, Y. L. Jiao, Z. L. Wang, M. Xiao, A. J. Du, Y. L. Li, J. S. Wang and L. Z. Wang, Adv. Funct. Mater., 2018, 28, 1805698 CrossRef.
- Y. X. Li, H. Xu, S. X. Ouyang, D. Lu, X. Wang, D. F. Wang and J. H. Ye, J. Mater. Chem. A, 2016, 4, 2943–2950 RSC.
- T. Xiong, W. L. Cen, Y. X. Zhang and F. Dong, ACS Catal., 2016, 6, 2462–2472 CrossRef CAS.
- I. Papailias, T. Giannakopoulou, N. Todorova, D. Demotikali, T. Vaimakis and C. Trapalis, Appl. Surf. Sci., 2015, 358, 278–286 CrossRef CAS.
- Y. Shiraishi, S. Kanazawa, Y. Sugano, D. Tsukamoto, H. Sakamoto, S. Ichikawa and T. Hirai, ACS Catal., 2014, 4, 774–780 CrossRef CAS.
- Q. Tay, P. Kanhere, C. F. Ng, S. Chen, S. Chakraborty, A. C. H. Huan, T. C. Sum, R. Ahuja and Z. Chen, Chem. Mater., 2015, 27, 4930–4933 CrossRef CAS.
- J. Zhang, J. Chen, Y. Wan, H. Liu, W. Chen, G. Wang and R. Wang, ACS Appl. Mater. Interfaces, 2020, 12, 13805–13812 CrossRef CAS PubMed.
- X. Kong, C. Zeng, X. Wang, J. Huang, C. Li, J. Fei, J. Li and Q. Feng, Sci. Rep., 2016, 6, 29049 CrossRef CAS PubMed.
- J. J. He, H. Q. Sun, S. Indrawirawan, X. G. Duan, M. O. Tade and S. B. Wang, J. Colloid Interface Sci., 2015, 456, 15–21 CrossRef CAS PubMed.
- D. S. Argyropoulos, H. Li, A. R. Gaspar, K. Smith, L. A. Lucia and O. J. Rojas, Bioorg. Med. Chem., 2006, 14, 4017–4028 CrossRef CAS PubMed.
- K. Sobanska, P. Pietrzyk and Z. Sojka, ACS Catal., 2017, 7, 2935–2947 CrossRef CAS.
- J. Tauc, R. Grigorovici and A. Vancu, Phys. Status Solidi B, 1966, 15, 627–637 CrossRef CAS.
- H. W. Huang, K. Xiao, N. Tian, F. Dong, T. R. Zhang, X. Du and Y. H. Zhang, J. Mater. Chem. A, 2017, 5, 17452–17463 RSC.
- W. J. Wang, P. Xu, M. Chen, G. M. Zeng, C. Zhang, C. Y. Zhou, Y. Yang, D. L. Huang, C. Lai, M. Cheng, L. Hu, W. P. Xiong, H. Guo and M. Zhou, ACS Sustainable Chem. Eng., 2018, 6, 15503–15516 CrossRef CAS.
- H. Y. Zhang, S. Li, R. Lu and A. C. Yu, ACS Appl. Mater. Interfaces, 2015, 7, 21868–21874 CrossRef CAS PubMed.
- H. Y. Zhang and A. C. Yu, J. Phys. Chem. C, 2014, 118, 11628–11635 CrossRef CAS.
- H. Zhao, Z. L. Li and J. Jin, New J. Chem., 2019, 43, 12533–12537 RSC.
Footnote |
| † Electronic supplementary information (ESI) available. See DOI: 10.1039/d1ra02617h |
| This journal is © The Royal Society of Chemistry 2021 |


