 Open Access Article
Prospective application of diethylaminoethyl cellulose (DEAE-cellulose) with a high adsorption capacity toward the detoxification of 2,4-dichlorophenoxyacetic acid (2,4-D) from water†
Jagadeesh Kodalia,
Balasubramanian Arunraja,
T. Sathvikaa,
A. Santhana Krishna Kumar b and
Rajesh Nagarathnam
 *a
*a
aDepartment of Chemistry, Birla Institute of Technology and Science, Pilani-Hyderabad Campus, Jawahar Nagar, Shameerpet Mandal, Hyderabad 500 078, India. E-mail: nrajesh@hyderabad.bits-pilani.ac.in; Fax: +91 40 66303998; Tel: +91 40 66303503
bDepartment of Chemistry, National Sun Yat-sen University, No. 70, Lien-hai Road, Gushan District, Kaohsiung 80424, Taiwan
First published on 28th June 2021
Abstract
Detoxification of pesticide residues requires effective methods. In this regard, the adsorption efficiency of diethylaminoethyl cellulose (DEAE-cellulose) as an adsorbent material for the removal of 2,4-dichlorophenoxyacetic acid (2,4-D) from water at different concentrations, times, pH and temperature was evaluated comprehensively. The obtained results showed that DEAE-cellulose has greater efficacy to eliminate 2,4-D from water with a high Langmuir maximum adsorption capacity of 429.18 mg g−1 at pH 7.0. Kinetic models and thermodynamics were investigated at length. The adsorption mechanism was understood by way of electrostatic, hydrogen bonding, and Lewis acid–base type interactions. Extensive analytical characterization of the DEAE-cellulose adsorbent before and after 2,4-D adsorption was performed and liquid chromatography with a tandem mass spectrometer (LC-MS/MS) was used for the quantification of 2,4-D. The regeneration of DEAE-cellulose was achievable using dilute formic acid and the DEAE-cellulose adsorbent showed high ability in the removal of 2,4-D from the agriculture run-off water.
Introduction
2,4-Dichlorophenoxyacetic acid commonly known as 2,4-D is a widely used pesticide.1 Application of 2,4-D and its derivatives as herbicides in agriculture increased due to their effectiveness at low concentrations, solubility in water, and relatively low price.2 2,4-D and its derivatives possess similar chemical properties to natural Plant Growth Regulators (PGR) including auxin, indole-3-acetic acid and they can be used to protect crops from weeds. Major derivatives include 2,4-D dimethylamine salt and 2,4-D butyl ester. Several reports showed that 2,4-D reduces nitrogen-fixing bacterial growth on leguminous plants by impeding the transformation of ammonia to nitrates.3,4 Due to its enormous usage considerably in agriculture, the accumulation of 2,4-D and its derivatives in the environment increased rapidly over a few decades. According to the European Food Safety Authority (EFSA), the sum of the levels of 2,4-D, its salts, esters, and conjugates, are expressed as a total 2,4-D.5 The United States Environmental Protection Agency (US-EPA) categorized 2,4-D and its metabolites as unsafe environmental pollutants resulting in adverse effects on biological pathways6 and carcinogenicity.7 World Health Organization (WHO) specified 0.03 mg L−1 as the maximum limit for 2,4-D to be present in drinking water8 whereas EPA specified 0.07 mg L−1 as Maximum Contamination Level.9 Bureau of Indian Standards (BIS) prescribed the tolerable limit10 in drinking water at 0.03 mg L−1.Due to the unavailability of an antidote to the 2,4-D poisoning and the growing risk of exposure as an environmental pollutant, it is necessary to detoxify 2,4-D from agricultural water as well as drinking water.11,12 Several methods encompassing electrodegradation,13 biodegradation,14,15 photodegradation,16 catalytic ozonation,17 and advanced oxidation18 are well recognized for removal of 2,4-D from water and these processes have advantages as well as disadvantages. Few studies are reported using carbon nanotubes,19 activated carbon20 as adsorbents to remove 2,4-D and its derivatives effectively from water. Biosorption is another technique to remove pesticides that involves physicochemical and ion exchange interactions.21,22 The application of cost-effective materials in the removal of pesticides from water using clay complex23 was also studied in recent years. Though there are multifarious adsorbents for removal of 2,4-D from water, the reported adsorption capacities are low i.e. less than 200 mg g−1. Several factors impact the adsorption efficiency of pesticides including temperature, equilibration time, pH, quantity of adsorbent, and ionic strength. Adsorption isotherms are useful to quantify the extent of adsorption with a particular adsorbent. DEAE-cellulose is a positively charged resin that could prove to be a viable option to remove the pesticides. Although DEAE-cellulose is used in the separation of proteins and nucleic acids,24,25 it was not explored in removing pesticides especially 2,4-D from the water. The objective of the present study is to explore the utility of DEAE-cellulose as a prospective adsorbent towards removing 2,4-D from the water and run-off water from agricultural soils.
Materials and methods
Chemicals and reagents
The 2,4-dichlorophenoxyaceticacid (2,4-D (99.93%)) was obtained from Dr. Erhenstorfer, Germany. The diethylaminoethyl cellulose adsorbent was purchased from Sisco Research Laboratories, India. Mobile phase ammonium formate as mobile phase for LC-MS/MS was procured from Sigma, Aldrich. Spectroscopy grade KBr was obtained from Merck. Methanol was procured from J. T. Baker. The aqueous solutions were prepared using Millipore water. The quality of other chemicals/reagents used was of analytical grade.A working concentration of 100 μg L−1 2,4-D for batch adsorption studies was prepared from the stock solution of 1000 mg L−1. The DEAE-cellulose was characterized before and after adsorption through various physicochemical characterization techniques. The vibrational spectrum of the DEAE-cellulose adsorbent was recorded by pelletizing approximately 2 mg of the sample with 100 mg KBr (spectroscopy grade) over the frequency range 400–4000 cm−1 using JASCO-4200 model IR Spectrometer. The concentration of 2,4-D was analytically quantified using a Triple quadrupole LC-MS/MS AB Sciex API 3200 mass spectrometer. Surface analytical data (pore volume, surface area) were determined by Brunauer–Emmett–Teller analysis using a Quantachrome instrument supported by ASiQwin software. Surface morphology and elemental composition were studied with Field Emission Scanning electron microscope (Carl Zeiss Supra 55) coupled with EDX (Oxford) system. PANalytical Epsilon 1 spectrometer was used for X-ray fluorescence measurement. A Metrohm 867 pH module was used for pH adjustments and the thermogravimetric profile was recorded in a nitrogen atmosphere (Shimadzu DTA 60) covering the temperature range 35–800 °C. The X-ray diffraction (XRD) pattern of DEAE-cellulose was recorded on a Rigaku Ultima IV X-ray diffractometer using Cu-Kα radiation (1.5405 Å). The XPS measurement of the DEAE-cellulose was performed in Thermo Scientific K-Alpha XPS instrument. The UV-Vis spectrum analysis of 2,4-D was recorded using 10 mm path length quartz cuvettes over the range 200–400 nm wavelength using a Shimadzu UV-1800 spectrophotometer.
Adsorption experiments and analysis of 2,4-D
The adsorption experiments were carried out at controlled room temperature 25 °C (±2.0 °C). A known quantity of DEAE-cellulose (0.1 g) was added to a glass flask containing a 50 mL volume of 2,4-D solution at 100 μg L−1 and the pH was maintained at 7.0 using 1.0 mol L−1 NaOH and HCl solution. The contents were equilibrated on a magnetic stirrer for 120 min. The equilibrium adsorption capacity (qe) was calculated from the difference between the initial concentration (Co) and the equilibrium concentration (Ce) of 2,4 D remaining in the solution as
 | (1) |
The effect of adsorbent dosage was studied by taking 50 mL of 2,4-D solution at 100 μg L−1 in the range 1.0–8.0 g L−1 of DEAE-cellulose. The aqueous medium pH was maintained at 7.0 and the solution was equilibrated on a magnetic stirrer for 120 min at controlled room temperature 25 ± 2.0 °C.
For the Langmuir and Freundlich isotherm studies, 0.1 g of DEAE-cellulose was taken, with 50 mL of 2, 4-D concentration range 50–1000 mg L−1. The pH of aqueous medium was fixed at 7.0 and the contents were stirred magnetically for 120 min at controlled room temperature 25 ± 2.0 °C.
Toward the thermodynamic studies, 50 mL of 2,4-D solution at 100 μg L−1 was added to 0.1 g of DEAE-cellulose at different temperatures (10–60 °C). The pH was maintained at 7.0 and equilibrated for 120 min.
In order to study the adsorption kinetics, 50 mL of 2,4-D solution at 100 μg L−1 was added to 0.1 g of DEAE-cellulose adsorbent and stirred at different time intervals over the range 1–120 min respectively. The pH was maintained at 7.0 and it was equilibrated at controlled room temperature.
In summary, the adsorption experiments were performed by optimizing the various experimental variables namely, pH (3.0–11.0), adsorbent dosage (1–8 g L−1), 2,4-D concentration (50–1000 mg L−1), contact time (1–120 min), and temperature (10–60 °C) respectively.
Also, a representative concentration of 2,4-D was taken in the absence of DEAE-cellulose in order to check the adsorption of 2,4-D to the glass surface and for plausible degradation. Indeed, this provided the reference to match with samples while obtaining specific adsorption data. Preliminary results from blank and control solutions indicated that the adsorption of 2,4-D onto the glass walls was negligible.
For each analysis, the aqueous supernatant was collected and filtered through a 0.45 μm nylon 66 membrane filter paper. The clear solution was transferred to a 2 mL LC vial and 5 μL was injected into LC-MS/MS system analyzed for the 2,4-D concentration.
A validated analytical method as per SANTE/11945 was adopted for quantifying 2,4-D levels. The calibration curve was obtained from standards of 5, 10, 50, 100, 200, 500, 1000 μg L−1 (Fig. S1(a)†). The mobile phase employed was a mixture of methanol and 5 mM ammonium formate in water in a ratio of 90![[thin space (1/6-em)]](https://www.rsc.org/images/entities/char_2009.gif) :
:![[thin space (1/6-em)]](https://www.rsc.org/images/entities/char_2009.gif) 10. The flow rate of 0.55 mL min−1 was maintained on the Inertsil ODS3 C18 column with dimensions of 50 mm × 4.6 mm, 5 μ thickness, with flow directed towards mass spectrometer source. Electro Spray Ionization (ESI) mode served the purpose to ionize 2,4-D in negative mode. Ion spray voltage (ISV) of −4500 V, heater temperature (TEM) of 500 °C, nebulizer gas (GS1) 45, heater gas (GS2) 55 were used in the ionization source. Deprotonated mass (M − H+) of 219 m/z is a characteristic precursor ion for 2,4-D pesticide. Fragmentation of precursor ion was accomplished with nitrogen as collision gas and various product ions of m/z 125 and 161 were obtained. Refer to Fig. S1(b) and (c)† for precursor ion and product ion spectra respectively. The m/z 161 stable product ion was chosen for subsequent quantitation. Curtain gas and CAD (Collision Assisted Dissociation) was fixed at 35 psi and 10 psi respectively. Entrance Potential (EP), Declusturing Potential (DP), Collision energy (CE), Collision Cell Exit Potential (CXP) was set to −10 V, −21 V, −18 V, −13 V respectively. The sample concentrations were calculated from the peak area using the linear equation of the standard curve. Customary to any analytical method, the blank and 2,4-D sample peaks (Fig. S1(d)†) were obtained and the proportionality of peak area against concentration quantified the concentration of 2,4-D in an aqueous solution.
10. The flow rate of 0.55 mL min−1 was maintained on the Inertsil ODS3 C18 column with dimensions of 50 mm × 4.6 mm, 5 μ thickness, with flow directed towards mass spectrometer source. Electro Spray Ionization (ESI) mode served the purpose to ionize 2,4-D in negative mode. Ion spray voltage (ISV) of −4500 V, heater temperature (TEM) of 500 °C, nebulizer gas (GS1) 45, heater gas (GS2) 55 were used in the ionization source. Deprotonated mass (M − H+) of 219 m/z is a characteristic precursor ion for 2,4-D pesticide. Fragmentation of precursor ion was accomplished with nitrogen as collision gas and various product ions of m/z 125 and 161 were obtained. Refer to Fig. S1(b) and (c)† for precursor ion and product ion spectra respectively. The m/z 161 stable product ion was chosen for subsequent quantitation. Curtain gas and CAD (Collision Assisted Dissociation) was fixed at 35 psi and 10 psi respectively. Entrance Potential (EP), Declusturing Potential (DP), Collision energy (CE), Collision Cell Exit Potential (CXP) was set to −10 V, −21 V, −18 V, −13 V respectively. The sample concentrations were calculated from the peak area using the linear equation of the standard curve. Customary to any analytical method, the blank and 2,4-D sample peaks (Fig. S1(d)†) were obtained and the proportionality of peak area against concentration quantified the concentration of 2,4-D in an aqueous solution.
Results and discussion
Morphological features and surface analysis of DEAE-cellulose
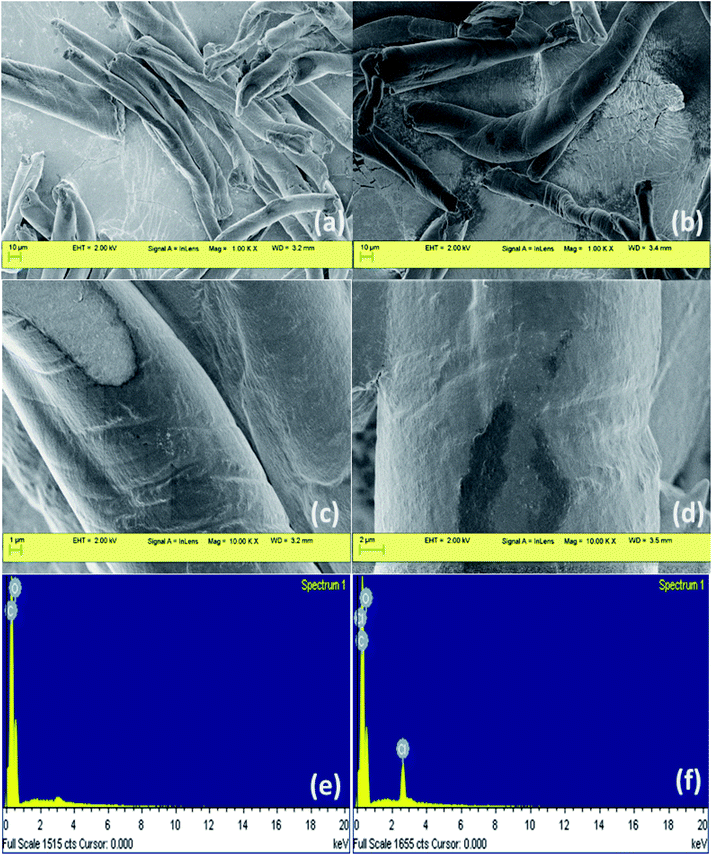
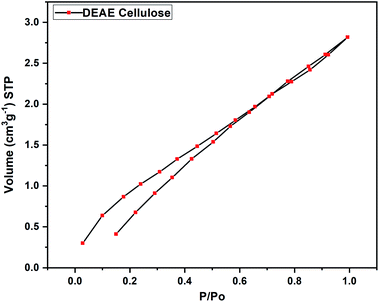
Morphological features of DEAE-cellulose before and after adsorption of 2,4-D were investigated through scanning electron microscopy (Fig. 1). Images magnified 1000× revealed fibrous strands with a sort of deformed linear manifestation. Higher-resolution revealed a smooth surface and specific patches interspersed with micro and mesoporous structure. The SEM images of DEAE-cellulose that were obtained after adsorption with 2,4-D shows a smoother surface and furthermore, the coarse patches were laden with dark-colored spots. In order to validate the elemental composition of 2,4-D on the DEAE-cellulose, energy dispersive X-ray spectroscopy (EDX) was employed, and as expected after adsorption the presence of chlorine along with other elements were obvious in EDX spectra (Fig. 1). The fact that chlorine peak is evident in the energy dispersive X-ray spectrum confirms the adsorption of 2,4-D onto the DEAE-cellulose surface.The nitrogen adsorption/desorption curves obtained through the BET isotherm (Fig. 2) gave the surface area of DEAE-cellulose as 6.067 m2 g−1 with an average pore volume and pore diameter as 0.006 cm3 g−1 and 1.988 nm respectively indicating a microporous nature for DEAE-cellulose.26 The N2 adsorption isotherm indicates that the structural features are preserved with micropores in the DEAE-cellulose adsorbent surface.
The X-ray fluorescence (XRF) spectrum was recorded for DEAE-cellulose before and after adsorption (Fig. 3). A distinct peak at 2.62 keV after adsorption of 2,4-D onto the DEAE-cellulose corresponds to Cl in 2,4-D which corroborates the anchoring of 2,4-D onto the sorbent DEAE-cellulose. The vibrational spectroscopic study was used in the identification of functional groups of 2,4-D on DEAE-cellulose before and after adsorption (Fig. 4). The FT-IR spectrum of DEAE-cellulose showed characteristic bands at 3413 cm−1 (broad) and 2917 cm−1 that could be attributed to O–H and C–H stretching vibrations.27 Further, the peak corresponding C![[double bond, length as m-dash]](https://www.rsc.org/images/entities/char_e001.gif) O of the carboxylic acid group with a wavenumber of 1622 cm−1 was detected in the adsorbent after the adsorption of 2,4-D. Other characteristic peaks such as aromatic C
O of the carboxylic acid group with a wavenumber of 1622 cm−1 was detected in the adsorbent after the adsorption of 2,4-D. Other characteristic peaks such as aromatic C![[double bond, length as m-dash]](https://www.rsc.org/images/entities/char_e001.gif) C at 1481 cm−1 and C–O peak at 1065 cm−1 are also evident in the spectrum. Distinct changes in the FT-IR spectral pattern after adsorption in the range 850–550 cm−1 testifies the C–Cl group present in 2,4 dichlorophenoxyacetic acid.
C at 1481 cm−1 and C–O peak at 1065 cm−1 are also evident in the spectrum. Distinct changes in the FT-IR spectral pattern after adsorption in the range 850–550 cm−1 testifies the C–Cl group present in 2,4 dichlorophenoxyacetic acid.
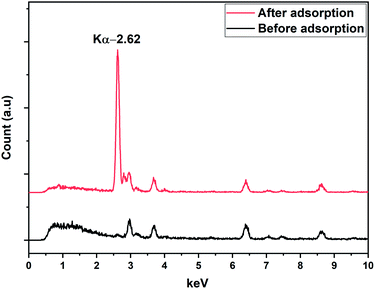 | ||
| Fig. 3 XRF spectra of DEAE-cellulose, a working concentration of 2,4-D (100 μg L−1, 50 mL, pH 7.0) equilibrated with adsorbent dosage (0.1 g), contact time 120 min and temperature 25 ± 2.0 °C. | ||
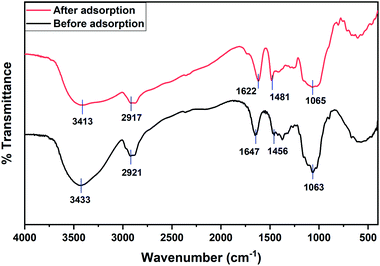 | ||
| Fig. 4 FT-IR spectra of DEAE-cellulose, a working concentration of 2,4-D (100 μg L−1, 50 mL, pH 7.0) equilibrated with adsorbent dosage (0.1 g), contact time 120 min and temperature 25 ± 2.0 °C. | ||
Thermogravimetric analysis (TGA) (Fig. S2†) is quite essential to realize the stability of the DEAE-cellulose. After the initial water evaporation from DEAE-cellulose, the second step involves swift pyrolysis of approximately 60% weight loss in the temperature range 250–350 °C attributed to heterolytic depolymerization, and between 350–800 °C there is the decomposition of cellulose and whole loss of carbon.28 2,4-D was dissolved in water and the UV spectrum (200–400 nm) was recorded before and after its adsorption onto DEAE-cellulose. Before adsorption, the spectrum indicates characteristic absorptions at wavelengths maximum 235 nm and 280 nm corresponding to 2,4-D in the solution.29 After 2,4-D adsorption onto DEAE-cellulose the UV spectrum shows the disappearance of these peaks with negligible absorbance thereby confirming the adsorption on the sorbent DEAE-cellulose (Fig. S3†). Powder XRD studies give information about the amorphous or crystalline nature of the as-prepared adsorbent of DEAE-cellulose before and after the adsorption of 2,4-D, as displayed in Fig. S4.† The two XRD profiles did not show substantial alterations, and the broader diffraction peaks are characteristic of amorphous cellulose materials.30 The enlarged peak that is evident around 2θ = 20.5° is ascribed to the diffraction plane (002) corresponding to the DEAE-cellulose. Similar XRD patterns were also corroborated for cellulose nanocrystals derived from rejected fibers.31
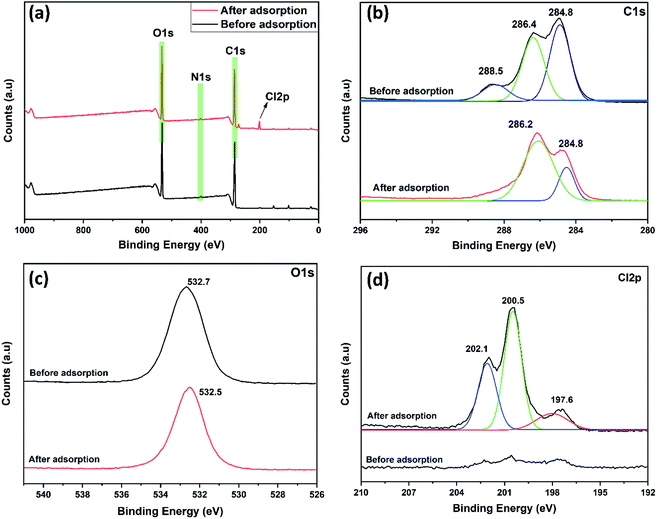
The total survey spectrum of XPS analysis illustrates the presence of various elements, carbon, nitrogen, oxygen onto the DEAE-cellulose as shown in Fig. 5(a). The noteworthy peaks at 284.8, 401.7, and 532.5 eV are related to C 1s, N 1s, and O 1s as identified on the adsorbent, and further, the C 1s spectrum can be further de-convoluted into double peaks at 284.8 (C–C), 286.2 (C![[double bond, length as m-dash]](https://www.rsc.org/images/entities/char_e001.gif) O) (Fig. 5(b)), similarly, the N 1s spectrum of can be divided into two components 399.5, and 401.7 eV, attributed to sp2 hybridized nitrogen atoms in the (C
O) (Fig. 5(b)), similarly, the N 1s spectrum of can be divided into two components 399.5, and 401.7 eV, attributed to sp2 hybridized nitrogen atoms in the (C![[double bond, length as m-dash]](https://www.rsc.org/images/entities/char_e001.gif) N+, 399.5 eV) and protonated amino group (+N–H, 401.7 eV) respectively32 as shown in Fig. S5.† Furthermore, oxygen spectrum can be assigned to 532.5 eV (–OH) (Fig. 5(c)) indicates the oxygen atoms from the DEAE-cellulose and the adsorbed water molecules. Besides, adsorption of 2,4-D carbon, nitrogen, oxygen along with Cl elemental peaks were also present and these would further strengthen the fact that 2,4-D is anchored onto the porous surface of DEAE-cellulose as shown in Fig. 5(a). These characteristic peak position sillustrate that the DEAE-cellulose surface of the adsorbent has abundant functional groups and active sites for efficient adsorption of 2,4-D in an aqueous medium. Furthermore, de-convolution of Cl 2p spectra reveals three major peaks positions identifiable at 197.6 eV (Cl 2p3/2), and 200.5 eV (Cl 2p1/2) (Fig. 5(d)). The third peak at 202.1 eV shows the existence of C–Cl bonds33 and indeed this also correlates with the C–Cl vibrational frequency shift observed with the corresponding FT-IR results.
N+, 399.5 eV) and protonated amino group (+N–H, 401.7 eV) respectively32 as shown in Fig. S5.† Furthermore, oxygen spectrum can be assigned to 532.5 eV (–OH) (Fig. 5(c)) indicates the oxygen atoms from the DEAE-cellulose and the adsorbed water molecules. Besides, adsorption of 2,4-D carbon, nitrogen, oxygen along with Cl elemental peaks were also present and these would further strengthen the fact that 2,4-D is anchored onto the porous surface of DEAE-cellulose as shown in Fig. 5(a). These characteristic peak position sillustrate that the DEAE-cellulose surface of the adsorbent has abundant functional groups and active sites for efficient adsorption of 2,4-D in an aqueous medium. Furthermore, de-convolution of Cl 2p spectra reveals three major peaks positions identifiable at 197.6 eV (Cl 2p3/2), and 200.5 eV (Cl 2p1/2) (Fig. 5(d)). The third peak at 202.1 eV shows the existence of C–Cl bonds33 and indeed this also correlates with the C–Cl vibrational frequency shift observed with the corresponding FT-IR results.
Analytical parameters-validation
The above quantification method was validated including specificity, linearity, accuracy, precision, within-lab reproducibility, and matrix effect.34 Specificity was checked from the emergence of any interference peak that could coincide with the retention time value for 2,4-D. Indeed, it was evident that is no such interference thereby augmenting more selectivity for the analysis of 2,4-D. Calibration standards of 2,4-D corresponding to 5, 20, 100, 500, 1000 μg L−1 were prepared and the regression coefficient was close to 1 (0.99). Spiking a specified concentration of 10 μg L−1 of 2,4-D was done to check the recovery by injecting in LC-MS/MS together with the other standards. A recovery of 94% was attainable with a precision of 3.8% for the LC-MS/MS method. The coefficient of variation was found to be 6.4%. The other analytical parameters such as LOD and LOQ were calculated as per the below formula cited in the ICH validation guideline. The obtained LOD for the method is 0.6 μg L−1 (LOD = 3.3 × σ/S, where σ is the standard deviation of the response and S is the slope of the calibration curve). The signal-to-noise ratio (S/N) was acquired through the software. The obtained LOQ for the method is 2.0 μg L−1 (LOD = 10 × σ/S, where σ is the standard deviation of the response and S is the slope of the calibration curve).Chemistry of interaction and amount of DEAE-cellulose
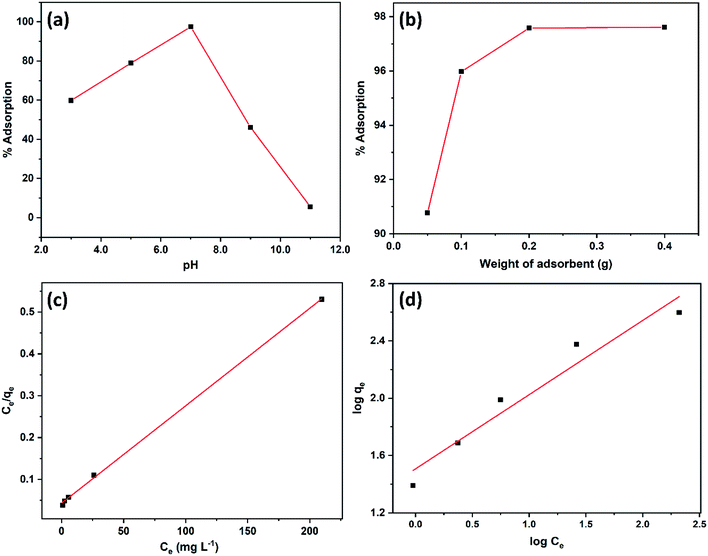
The adsorption of 2,4-D on DEAE-cellulose at various initial pH levels were studied and illustrated in Fig. 6(a). Obtained results showed that the adsorption increases with pH and reaches a maximum at pH 7.0 and decreases rapidly beyond pH 7.0. At pH 7.0, 97.4% adsorption occurred while at pH 3.0, 59.8% adsorption and at pH 9.0, 46.1% adsorption of 2,4-D. These results indicate that neutral pH favours maximum adsorption. The pKa of 2,4-D is approx. 2.8, and under the experimental pH condition, it would prevail as anionic species (i.e. pH > 3).32 When the solution pH is varied from 4.0 to 7.0, more of the anionic species (COO−) exist and further this would augment the electrostatic interaction with positively charged protonated amine +NH, and protonated hydroxyl groups (+OH2) on the DEAE-cellulose, leading to maximum adsorption as observed experimentally (Fig. 7(A)). In an acidic pH environment the DEAE-cellulose would easily be protonated (+NH and +OH2), the protonated functional group would also favour strong interaction with the aromatic-π moiety of 2,4-D as a result of cation-π bonding interaction.35 At neutral pH 7.0, maximum adsorption is achieved and this could also be attributed to the hydrogen bonding interaction between hydrogen (H) atom and electronegative atom oxygen (O) as depicted in interaction mechanism (Fig. 7(A)) hydroxyl groups on the surface of adsorbent (DEAE-OH) could also act electron donor (Lewis base) and the Cl atom on 2,4-D is influenced by electronegativity (Lewis acid) as represented in Fig. 7(B). As a result, Lewis acid–base interactions could also be envisaged in the mechanism. At higher pH, the decrease in adsorption is due to the DEAE-cellulose surface being negatively charged thereby resulting in electrostatic repulsion.36 In essence, the major driving factors behind the interaction of the proposed adsorbent (DEAE-cellulose) towards 2,4-D could be regarded as a blend of electrostatic, hydrogen bonding, cation-π, and ion exchange interactions which results in the high adsorption efficacy for 2,4-D.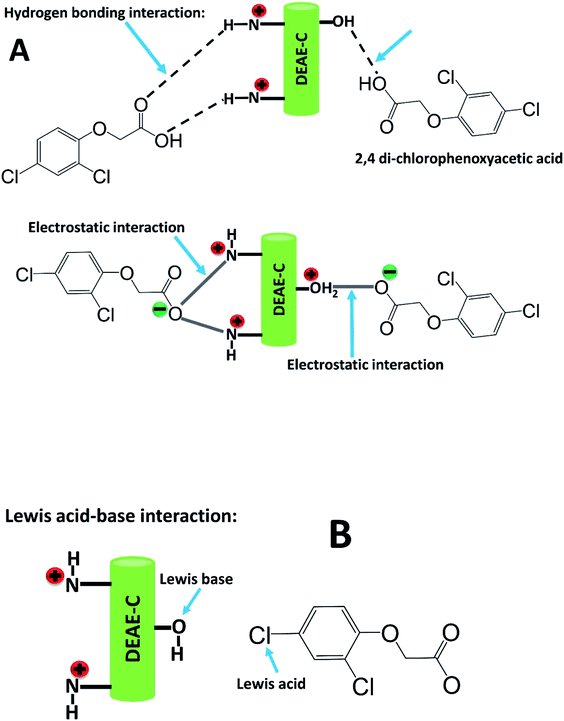 | ||
| Fig. 7 (A). Plausible mechanism depicting hydrogen bonding and electrostatic interaction of 2,4-D with DEAE-cellulose. (B) Lewis acid–base interaction of 2,4-D and DEAE-cellulose. | ||
The amount of DEAE-cellulose is an important parameter as it influences the capacity of an adsorbent for a given initial concentration of 2,4-D. Fig. 6(b) depicts the effect of adsorbent DEAE-cellulose dosage on the adsorption of 2,4-D. As expected, the percent adsorption of 2,4-D rises with the increasing amount of DEAE-cellulose. The increase in percentage removal can be attributed to the accessible active adsorption sites for 2,4-D.
Adsorption isotherms, thermodynamics and kinetic models
The distribution of 2,4-D between the liquid phase and the DEAE-cellulose surface at equilibrium at a particular temperature is described by adsorption isotherms.The linear expression of the Langmuir model is given by the following equation37
 | (2) |
 | (3) |
![[thin space (1/6-em)]](https://www.rsc.org/images/entities/char_2009.gif) Ce gives KF and n as the Freundlich isotherm parameters. The Langmuir and Freundlich isotherm models were employed and Fig. 6(c) is the plot of the Ce/qe versus equilibrium concentration (Ce) of 2,4-D in solution. Fig. 6(d) is the logarithmic plot (log
Ce gives KF and n as the Freundlich isotherm parameters. The Langmuir and Freundlich isotherm models were employed and Fig. 6(c) is the plot of the Ce/qe versus equilibrium concentration (Ce) of 2,4-D in solution. Fig. 6(d) is the logarithmic plot (log![[thin space (1/6-em)]](https://www.rsc.org/images/entities/char_2009.gif) qe) vs. equilibrium concentration of 2,4-D (log
qe) vs. equilibrium concentration of 2,4-D (log![[thin space (1/6-em)]](https://www.rsc.org/images/entities/char_2009.gif) Ce). The parameters of the Langmuir and Freundlich adsorption isotherms, evaluated from the linear plots37 are presented in Table 1 along with the regression coefficient. The maximum Langmuir adsorption capacity was found to be as high as 429.18 mg g−1 and from the correlation coefficients data of linear regression, it can be seen that the adsorption process follows the Langmuir adsorption model (R2 = 0.999) in preference to Freundlich adsorption model (R2 = 0.929).
Ce). The parameters of the Langmuir and Freundlich adsorption isotherms, evaluated from the linear plots37 are presented in Table 1 along with the regression coefficient. The maximum Langmuir adsorption capacity was found to be as high as 429.18 mg g−1 and from the correlation coefficients data of linear regression, it can be seen that the adsorption process follows the Langmuir adsorption model (R2 = 0.999) in preference to Freundlich adsorption model (R2 = 0.929).
| Langmuir | qmax (mg g−1) | b (L mg−1) | RL | R2 |
| 429.18 | 0.053 | 0.270 | 0.999 | |
| Freundlich | KF (mg1−1/n g−1 L1/n) | n | — | R2 |
| 32.06 | 1.934 | — | 0.929 |
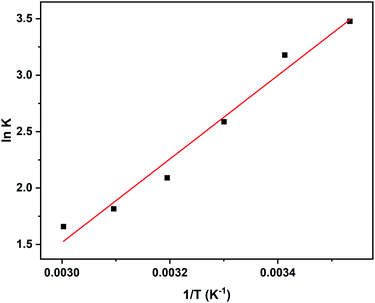
The effect of temperature on adsorption of 2,4-D revealed that the adsorption of 2,4-D is favourable at room temperature and the percentage adsorption gradually decreases with an increase in the temperature until 60 °C. The results corroborate the fact that at 30 °C, 96% adsorption was observed as against 84% at 60 °C. At higher temperature, it is more probable that the interaction between the 2,4-D and DEAE-cellulose weakens resulting in desorption. An increase in the temperature reduced the adsorption capacity of DEAE-cellulose. This suggests that adsorption between 2,4-D and DEAE-cellulose is physisorption. Thermodynamic extensive variables like free energy change, enthalpy, and entropy changes are more useful to substantiate the above qualitative claims. Under conditions of thermodynamic equilibrium, the reaction Gibbs energy, ΔGr = 0 and ΔGro = −RT![[thin space (1/6-em)]](https://www.rsc.org/images/entities/char_2009.gif) ln
ln![[thin space (1/6-em)]](https://www.rsc.org/images/entities/char_2009.gif) Keq. The Keq was acquired by measuring the concentration ratio of 2,4-D in the DEAE-cellulose surface to that in water medium at different temperatures.
Keq. The Keq was acquired by measuring the concentration ratio of 2,4-D in the DEAE-cellulose surface to that in water medium at different temperatures.
 | (4) |
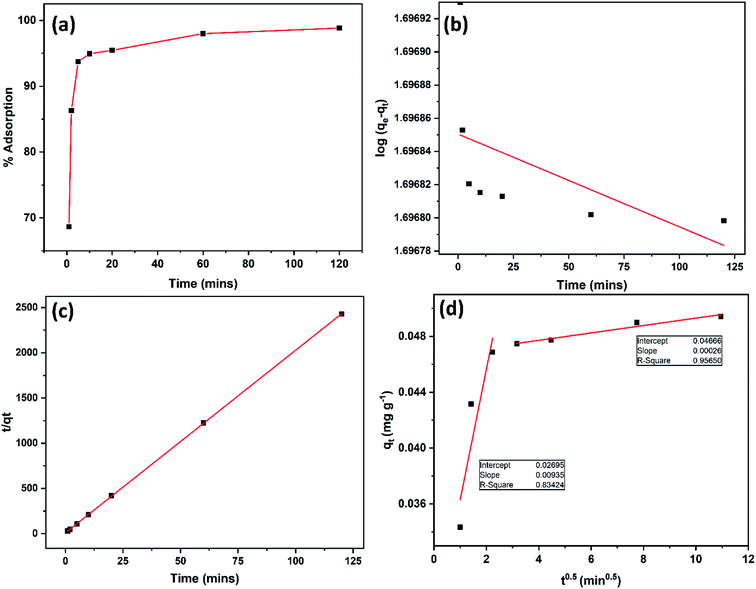
![[thin space (1/6-em)]](https://www.rsc.org/images/entities/char_2009.gif) Keq against 1/T can be used to acquire the other extensive variables namely, enthalpy and entropy (slope and intercept) associated with the adsorption of 2,4-D onto the DEAE-cellulose.38 The adsorption of 2,4-D is spontaneous (with negative free energy change) and accompanied by lesser randomness (−79.674 J mol−1 K−1) on the DEAE-cellulose surface. The exothermic adsorption of 2,4-D (−30.763 kJ mol−1) and a large negative entropy make the process more favourable with the release of heat in the process of adsorption39,40 (Table 2). The effect of equilibration time on the adsorption of 2,4-D was studied over a range 1–120 min and the amount of 2,4-D transferred into DEAE-cellulose was analyzed. The equilibrium concentrations of 2,4-D in the solution phase were measured and the adsorption behaviour of 2,4-D onto the DEAE-cellulose was ascertained at different time intervals (Fig. 9). From the data, it is evident that adsorption was rapid during the first 5 min of equilibration and within 20 min pseudo adsorption equilibrium was reached for 2,4-D. Thereafter, the percentage adsorption was fairly constant indicating the rapid uptake of 2,4-D by the DEAE-cellulose. The kinetics involving the uptake of 2,4-D from the adsorbent surface was corroborated through the well-recognized first and second-order kinetic models37 as given below,
Keq against 1/T can be used to acquire the other extensive variables namely, enthalpy and entropy (slope and intercept) associated with the adsorption of 2,4-D onto the DEAE-cellulose.38 The adsorption of 2,4-D is spontaneous (with negative free energy change) and accompanied by lesser randomness (−79.674 J mol−1 K−1) on the DEAE-cellulose surface. The exothermic adsorption of 2,4-D (−30.763 kJ mol−1) and a large negative entropy make the process more favourable with the release of heat in the process of adsorption39,40 (Table 2). The effect of equilibration time on the adsorption of 2,4-D was studied over a range 1–120 min and the amount of 2,4-D transferred into DEAE-cellulose was analyzed. The equilibrium concentrations of 2,4-D in the solution phase were measured and the adsorption behaviour of 2,4-D onto the DEAE-cellulose was ascertained at different time intervals (Fig. 9). From the data, it is evident that adsorption was rapid during the first 5 min of equilibration and within 20 min pseudo adsorption equilibrium was reached for 2,4-D. Thereafter, the percentage adsorption was fairly constant indicating the rapid uptake of 2,4-D by the DEAE-cellulose. The kinetics involving the uptake of 2,4-D from the adsorbent surface was corroborated through the well-recognized first and second-order kinetic models37 as given below,
 | (5) |
 | (6) |
| qt = kit1/2 + C | (7) |
| Temperature (kelvin) | ΔG0 (kJ mol−1) | ΔSo (J K −1 mol−1) | ΔHo (kJ mol−1) |
|---|---|---|---|
| 283 | −8.179 | −79.674 | −30.763 |
| 293 | −7.742 | ||
| 303 | −6.516 | ||
| 313 | −5.441 | ||
| 323 | −4.875 | ||
| 333 | −4.591 |
| Co (mg L−1) | qe (mg g−1) | k2 (g mg−1 min−1) | R22 | k1 (min−1) | R12 | kint (mg g−1 min−0.5) |
|---|---|---|---|---|---|---|
| 0.1 | 0.049 | 44.176 | 0.999 | 1.286 × 10⁻⁶ | 0.142 | 49.756 |
Recyclability of the adsorbent
Recycling or reusability of the adsorbent is relatively important when used to scale up the adsorption process. Dilute formic acid was explored as a potential reagent for desorption since in dilute concentrations it relatively innocuous as compared to other chlorinated or aromatic organic solvents. 2,4-D was adsorbed onto the DEAE-cellulose surface as outlined in the adsorption experiments section. After adsorption, the solution was vacuum filtered through 0.45 μm nylon-66 membrane filter paper. Subsequently, a 5 mL volume of 0.1% of formic acid in methanol was added to the DEAE-cellulose adsorbent without applying vacuum or positive pressure to favour the desorption of 2,4-D at room temperature 25 °C (±2.0 °C). Further, the adsorbent was washed with water then air-dried sorbent was utilized for batch adsorption studies as mentioned before. The efficacy of regeneration of the adsorbent was examined over 3 adsorption–desorption cycles. The DEAE-cellulose could be reused without any ostensible reduction in its performance for atleast 3 adsorption–desorption cycles (Table S1†). Regeneration efficiencies of 99%, 97%, and 96% for I, II and III cycles respectively were obtained and attempts toward further repetitive regeneration of the DEAE-cellulose surface resulted in reduction after three cycles. Adsorbed 2,4-D was desorbed using formic acid in methanol and the ensuing solution when subjected to LC-MS analysis yielded a precursor ion of m/z 219 indicating protonated 2,4-D and additional fragmentation (Fig. S6†) was in accordance with the fragmentation pattern observed for 2,4-D (Fig. S7†). This further validates the fact that 2,4-D is effectively adsorbed onto the DEAE-cellulose surface.Diverse pesticide effect on adsorption
The effect of commonly associated competing pesticides (which are structurally similar to 2,4-D) on the adsorption of 2,4-D onto DEAE-cellulose was evaluated by spiking 1 mg L−1 of 2,4-DP (dichlorprop/2,4-dichlorophenoxybutyric acid), 2,4-DB (2,4-dichlorophenoxy butyric acid), 2,4,5-T (2,4,5-Trichlorophenoxyacetic acid), MCPA (2-methyl-4-chlorophenoxyacetic acid),MCPB {4-(2-methyl-4-chlorophenoxy) butyric acid}, and MCPP (methylchlorophenoxy propionic acid). The 2,4-DP, 2,4-DB, 2,4,5-T, MCPA, MCPB, and MCPP stock solutions were prepared in an aqueous medium at a concentration of 1000 mg L−1 each. Water was spiked with 1.0 mg L−1 each of these competing pesticides at various concentration of 2,4-D. Batch adsorption studies were performed and the experimental data presented in Table S2† reveals that the presence of competitor pesticides does not impact the adsorption of 2,4-D onto DEAE-cellulose and the adsorption of 2,4-D was found to be greater than 98%.Application of DEAE-cellulose for 2,4-D adsorption in runoff water
Subsequently, the adsorption capacity of DEAE-cellulose for 2,4-D was tested on the real runoff water samples brought from a farm canal (Location: Guntur District, India).38 An appropriate amount of runoff water (∼20 litres) was transferred to glass bottles and brought to the research laboratory and preserved at ambient temperature. The pH of the collected water sample was 6.9 with an appreciably high total hardness of above 1000 mg L−1. The pesticide 2,4-D was not detectable in the water sample and therefore the adsorption study was carried out by spiking 2,4-D to the sample at various concentrations. After adsorption, supernatant water was filtered through 0.45 μm nylon 66 membrane filter paper and the clear solution was taken in a 2 mL LC vial, and a 5 μL volume was injected into LC-MS/MS system. It was found that the adsorption of 2,4-D onto DEAE-cellulose in agriculture runoff water was greater than 85% and results are presented in Table S3.† These results indicate that DEAE-cellulose has the potential to remove the 2,4-D pesticide from real farm runoff water samples.Conclusions
In conclusion, this work has indeed showcased the solid-phase extraction of a noxious herbicidal pesticide, 2,4-D using DEAE-cellulose as an adsorbent. The adsorption was very effective at neutral pH with a very high Langmuir maximum adsorption capacity of 429 mg g−1. Thermodynamic spontaneity endowed with an enthalpically favourable exothermic adsorption and fast sorption kinetics (pseudo-second-order) is the traits that were observed in the adsorption of 2,4-D onto the DEAE-cellulose surface. The extensive analytical characterizations also highlighted the electrostatic, hydrogen bonding, and Lewis-acid–base interaction mechanisms in the process. The adsorbent could be regenerated using acidified formic acid in methanol coupled with the high recovery (>98%) of 2,4-D in presence of other pesticides such as 2,4-DP, 2,4-DB, 2,4,5-T, MCPA, MCPB, and MCPP, etc. The mass spectrum confirmed all these feature through the distinct fragmentation patterns. In comparison with other related pesticides and adsorbents (Table 4)19–22,30,32,35,41–51 it is evident that DEAE-cellulose has superlative ability to remove 2,4-D with high adsorption capacity. DEAE-cellulose could adsorb 2,4-D as high as 88% when tested in spiked run-off water from agriculture land. Hence, the bottom line is that cellulosic adsorbent materials possess better ability to detoxify pesticide residues at ppb levels. Through this simple and meticulous study, DEAE-cellulose has proved to be noteworthy in the detoxification of 2,4-D from water.![[thin space (1/6-em)]](https://www.rsc.org/images/entities/char_2009.gif) capacities of various adsorbents for 2,4-D pesticide removal
capacities of various adsorbents for 2,4-D pesticide removal
| Adsorbent | Adsorption capacity (mg g−1) | Reference |
|---|---|---|
| Granular activated carbon | 27.1 | 19 |
| Rice husk Biochar | 24.6 | 19 |
| Multi-walled carbon nanotubes | 21.9 | 19 |
| Granular activated carbon | 182 | 20 |
| MIEX resin | 47 | 21 |
| Magnetic ion-exchange resin | 61 | 22 |
| Physalisperuviana chalice | 244 | 30 |
| UiO-66-NMe3+ | 279 | 32 |
| Corn cob biochar | 37.4 | 35 |
| Polypyrrole-Fe3O4 magnetic NPs | 96.1 | 41 |
| Magnetic graphene | 32 | 42 |
| Neemoil–phenolic resin treated lignocellulosic jute | 39 | 43 |
| H3PO4-activated carbon | 261 | 44 |
| SBA-15 templated carbon C100 | 136 | 45 |
| Chitosan | 11 | 46 |
| Biochar from Switch grass (Panicumvirgatum) | 133 | 47 |
| Amino-functionalized poly (glycidyl methacrylate) | 99.4 | 48 |
| Graphene oxide coated with porous iron oxide ribbons | 67.2 | 49 |
| Oil palm frond activated carbon | 45.0 | 50 |
| Metal hydroxides | 42.1 | 51 |
| DEAE-cellulose | 429.8 | Present study |
Conflicts of interest
The authors declare no competing interest.Acknowledgements
Thanks to the Central Analytical Laboratory, Birla Institute of Technology and Science (BITS) Pilani, Hyderabad campus, India for analytical characterization. Thanks to Vimta Labs Ltd, Hyderabad, India for the support extended in LC-MS measurement experiments in their sophisticated laboratory and also we acknowledge Sprint testing solutions, Mumbai, India, for their further technical assistance in the characterization of the DEAE-cellulose.References
- A. Qurratu and A. Reehan, Int. J. Appl. Eng. Res., 2016, 11, 9946–9955 Search PubMed.
- K. Kusmierek, M. Szala and A. Swiatkowski, J. Taiwan Inst. Chem. Eng., 2016, 63, 371–378 CrossRef CAS.
- R. N. Arias and A. Fabra de Peretti, Toxicol. Lett., 1993, 68, 267–273 CrossRef CAS PubMed.
- D. A. Martens and J. M. Bremner, J. Environ. Sci. Health B., 1993, 28, 377–395 CrossRef.
- EFSA (European Food Safety Authority), 2014, Conclusion on the peer review of the pesticide risk assessment of the active substance 2,4-D, EFSA J, 2014, 12, 3812 Search PubMed.
- U.S. EPA, Office of pesticide and toxic substances office of pesticide programs. Pesticide fact sheet: 2, 4-dichlorophenoxyacetic acid, Washington D.C., 1989 Search PubMed.
- A. Chaparadza and J. M. Hossenlopp, J. Colloid Interface Sci., 2011, 363, 92–97 CrossRef CAS PubMed.
- World Health Organization, http://www.who.int/water_sanitation_health/dwq/chemicals/24D.pdf, accessed on March 2021.
- United States Environmental Protection Agency, http://archive.epa.gov/pesticides/reregistration/web/pdf/24d_red.pdf, accessed on March 2021.
- Indian standard: Drinking water – Specification IS 10500-2012.
- S. M. Bradberry, B. E. Watt, A. T. Proudfoot and J. A. Vale, J. Toxicol. Clin. Toxicol., 2000, 38, 111–122 CrossRef CAS PubMed.
- S. Hiran and S. Kumar, Asia Pac. J. Med. Toxicol., 2017, 6, 29–33 Search PubMed.
- A. Dargahi, D. Nematollahi, G. Asgari, R. Shokoohi, A. Ansari and M. R. Samarghandi, RSC Adv., 2018, 8, 39256–39268 RSC.
- K. K. Shimabuku, T. L. Zearley, K. S. Dowdell and R. S. Summers, Environ Sci.: Water Res. Technol., 2019, 5, 849–860 RSC.
- X. Wu, W. Wang, J. Liu, D. Pan, X. Tu, P. Lv, Y. Wang, H. Cao, Y. Wang and R. Hua, J. Agric. Food Chem., 2017, 65, 3711–3720 CrossRef CAS PubMed.
- S. P. Kamble, S. P. Deosarkar, S. B. Sawant, J. A. Moulijn and V. G. Pangarkar, Ind. Eng. Chem. Res., 2004, 43, 8178–8187 CrossRef CAS.
- C. Hu, S. Xing, J. Qu and H. He, J. Phys. Chem. C, 2008, 112, 5978–5983 CrossRef CAS.
- J. Peller, O. Wiest and P. V. Kamat, J. Phys. Chem. A, 2004, 108, 10925–10933 CrossRef CAS.
- M. Bahrami, M. J. Amiri and B. Beigzadeh, Water Sci. Technol., 2018, 78, 1812–1821 CrossRef CAS PubMed.
- M. Dehghani, S. Nasseri and M. Karamimanesh, J. Environ. Health Sci. Eng., 2014, 12, 28–37 CrossRef PubMed.
- L. Ding, X. Lu, H. Deng and X. Zhang, Ind. Eng. Chem. Res., 2012, 51, 11226–11235 CrossRef CAS.
- X. Lu, Y. Shao, N. Gao and L. Ding, J. Chem. Eng. Data, 2015, 60, 1259–1269 CrossRef CAS.
- S. U. Khan, Environ. Sci. Technol., 1974, 8, 236–238 CrossRef CAS.
- S. Bakhtiary, M. Shirvani and H. Shariatmadari, Microp. Mesop. Mat., 2013, 168, 30–36 CrossRef CAS.
- N. Padashi, M. Arjmand, S. Rajaei and A. Dabbagh, J. Cellular & Molecular Anesthesia., 2016, 1, 158–162 Search PubMed.
- V. O. Njokuand and B. H. Hameed, Chem. Eng. J., 2011, 173, 391–399 CrossRef.
- O. Singh, P. S. Panesar and H. K. Chopra, Biosci., Biotechnol. Res. Asia, 2017, 14, 373–380 CrossRef.
- N. Phinichka and S. Kaenthong, J. Mat. Res. Technol., 2018, 7, 55–65 CrossRef CAS.
- M. Abdennouri, A. Elhalil, M. Farnane, H. Tounsadi, F. Z. Mahjoubi, R. Elmoubarki, M. Sadiq, L. Khamar, A. Galadi, M. Baalala, M. Bensital, Y. E. Hafiane, A. Smith and N. Barka, J. Saudi Chem. Soc., 2015, 19, 485–493 CrossRef.
- J. Georgin, D. S. P. Franco, M. S. Netto, D. Allasia, E. L. Foletto, L. F. S. Oliveira and G. L. Dotto, J. Environ. Chem. Eng., 2021, 9, 104574 CrossRef CAS.
- M. G. Aguayo, A. F. Perez, G. Reyes, C. Oviedo, W. Gacitua, R. Gonzalez and O. Uyarte, Polymers, 2018, 10, 1145 CrossRef PubMed.
- G. Wu, J. Ma, S. Li, S. Wang, B. Jiang, S. Luo, J. Li, X. Wang, Y. Guan and L. Chen, Environ. Res., 2020, 186, 109542 CrossRef CAS PubMed.
- Q. Guo, K. Kim, S. Li, A. M. Scida, P. Yu, S. K. Sandstrom, L. Zhang, S. Sun, H. Jiang, Q. Ni, D. Yu, M. M. Lerner, H. Xia and X. Ji, ACS Energy Lett, 2021, 6, 459–467 CrossRef CAS.
- Q. Li, J. Sun, T. Ren, L. Guo, Z. Yang, Q. Yang and H. Chen, Environ. Technol., 2018, 39, 895–906 CrossRef CAS PubMed.
- Q. A. Binh and H. H. Nguyen, Bioresour. Technol. Rep., 2020, 11, 100520 CrossRef.
- D. D. Clark and D. J. Edwards, Biochem. Mol. Biol. Edu., 2017, 46, 91–97 CrossRef PubMed.
- B. Arunraj, T. Sathvika, V. Rajesh and N. Rajesh, ACS Omega, 2019, 4, 940–952 CrossRef CAS.
- J. Kodali, S. Talasila, B. Arunraj and R. Nagarathnam, Case Studies. Chem. Environ. Eng., 2021, 3, 100099 CrossRef.
- M. Yamada, M. R. Gandhi, Y. Kondo, K. Haga, A. Shibayama and F. Hamada, RSC Adv., 2015, 5, 60506–60517 RSC.
- X. Tang, Z. Li and Y. Chen, J. Hazard. Mater., 2009, 161, 824–834 CrossRef CAS PubMed.
- B. Goswami and D. Mahanta, J. Environ. Chem. Eng., 2020, 8, 103919 CrossRef CAS.
- W. Liu, Q. Yang, Z. L. Yang and W. J. Wang, Colloid. Surface. Physicochem. Eng. Aspect, 2016, 509, 367–375 CrossRef CAS.
- S. Manna, P. Saha, D. Roy, R. Sen and B. Adhikari, J. Taiwan. Inst. Chem. Eng., 2016, 67, 292–299 CrossRef CAS.
- V. O. Njoku, M. A. Islam, M. Asif and B. H. Hameed, J. Environ. Manag., 2015, 154, 138–144 CrossRef CAS PubMed.
- M. Z. Momcilovic, M. S. Rand-elovic, A. R. Zarubica, A. E. Onjia, M. Kokunesoski and B. Z. Matovic, Chem. Eng. J., 2013, 220, 276–283 CrossRef CAS.
- H. E. Harmoudi, L. E. Gaini, E. Daoud, M. Rhazi, Y. Boughaleb, M. A. E. Mhammedi, A. M. Zalas and M. Bakasse, Opt. Mater., 2014, 36, 1471–1477 CrossRef.
- M. Essandoh, D. Wolgemuth, C. U. Pittman, D. Mohan and T. Mlsna, Chemosphere, 2017, 174, 49–57 CrossRef CAS PubMed.
- S. Sahin and S. Emik, J. Mol. Liq., 2018, 260, 195–202 CrossRef CAS.
- S. Nethaji and A. Sivasamy, Ecotoxicol. Environ. Saf., 2017, 138, 292–297 CrossRef CAS PubMed.
- J. M. Salman, V. O. Njoku and B. H. Hameed, Chem. Eng. J., 2011, 174, 33–40 CrossRef CAS.
- R. Kamaraj, D. J. Davidson, G. Sozhan and S. Vasudevan, J. Taiwan Institute Chem. Eng., 2014, 45, 2943–2949 CrossRef CAS.
Footnote |
| † Electronic supplementary information (ESI) available: Figures: analytical calibration curve for 2,4-D, precursor and product ion spectral features, blank/sample peaks, thermogravimetric analysis, UV spectra of 2,4-D, XRD of DEAE-cellulose adsorbent, XPS-N 1s spectra of DEAE-cellulose adsorbent, MS-spectra, fragments of 2,4-D. Tables: regeneration of adsorbent, diverse (competing) pesticides, farm water samples. See DOI: 10.1039/d1ra03037j |
| This journal is © The Royal Society of Chemistry 2021 |

