 Open Access Article
Dual-ion substituted (MeY)3(AlSi)5O12:Eu garnet phosphors: combinatorial screening, reductive annealing, and luminescence property
Zhehan Zhengab,
Mingxue Deng ac,
Caiyan Wangac,
Xiang Zhangac,
Qian Liu*ac,
Xiaoke Xua and
Le Gaoa
aThe State Key Laboratory of High Performance Ceramics and Superfine Microstructure, Shanghai Institute of Ceramics, Chinese Academy of Sciences, Shanghai 200050, China. E-mail: qianliu@mail.sic.ac.cn
bCollege of Materials Science and Engineering, Fuzhou University, Fuzhou, Fujian 350116, China
cCenter of Materials Science and Optoelectronics Engineering, University of Chinese Academy of Science, Beijing 100049, China
First published on 22nd June 2021
Abstract
In recent years, the efficiency of combinatorial methods has been utilized to accelerate the finding or screening of inorganic materials. In this work, based on the double substitution strategy of the cation ions Me2+/Si4+, a series of MeyY3−yAl5−ySiyO12:Eux garnet phosphors (MeYASG:Eu, Me = Mg, Ca, Sr, Ba) were rapidly prepared and screened by a combinatorial method in microreactor arrays. Through parallel experiments of solid-state synthesis, the reliability of the combinatorial screening was verified and an optimal composition of CaY2Al4SiO12:Eu0.03 (CYASG:Eu) with advanced luminous intensity was obtained. Annealing experiments under air and reductive atmospheres were performed and demonstrated the controllability and reversibility of the Eu3+ ↔ Eu2+ valence transition process, thus realizing the tuning of the dominant emission from divalent Eu2+ or trivalent Eu3+. The optimal CYASG:Eu sample showed excellent thermal quenching resistance after annealing at 800 °C for 1 h in a reducing atmosphere. The abnormal intensity of PL increased by 10% in the 50–100 °C region, and retained 63% of the initial value at 250 °C. With the assistance of thermoluminescence characterization, the complementary effect of the release of captured electrons or charge carriers in trap levels on the abnormal increase of PL intensity during the high-temperature luminescence process was revealed. By combination of the double substitution strategy of cations and annealing, a new approach is proposed to creating the coexistence of activator Eu ions with a mixed-valence state. Also, the prepared CYASG:Eu phosphors have promising applications in fields such as plant light supplements in greenhouses and plant factories and as luminescent materials for energy-saving light sources.
1. Introduction
Yttrium aluminum garnet (YAG, Y3Al5O12)-based phosphors are among the most common fluorescent materials. With a cubic phase structure, YAG-based phosphors have demonstrated isotropic thermal expansion, stable optical properties, and no birefringence effect.1–5 Rare-earth ions, as activators or substitution elements in the main lattice of YAG, can enrich the luminescent composition by colorful emissions from 5d–4f and 4f–4f transitions under blue or ultraviolet light excitation.6–8 Therefore, rare-earth-ion-doped YAG phosphors, such as cerium-doped yttrium aluminum garnet (YAG:Ce) phosphors, are widely applied in white-light-emitting diodes (WLEDs) by encapsulating them on blue-emitting LED chips. Due to its irreplaceable performance in various optics applications, in recent years, many researchers have focused on enriching the emission properties of YAG systems.Taking YAG:Ce as an example, it could be summarized as enriching the emission of YAG-based phosphors in two ways. One is to change the crystal field strength of the host lattice by cation substitution;9–12 for instance, Y3+ or Al3+ sites replaced by other cations will change the crystal field environment around activator ions and then result in a red or blue shift of its emission peak. For example, occupying Y3+ (1.159 Å, ligand number VIII) sites with the larger radius ion Gd3+ (1.193 Å, ligand number VIII) can tune the emission peak of Ce3+ from the normal 530 nm to 565 nm.13,14 Also, the dual-ion Mg2+ (0.86 Å, ligand number VI)/Si4+ (0.4 Å, ligand number IV) replacement for Al3+ (0.675 Å, ligand number VI)/Al3+ (0.53 Å, ligand number IV) cation pair can make the emission peak shift from 530 nm to 615 nm.15 However, as the Ce3+ emission peak is shifted, these cation-substitution strategies inevitably encounter the situation of reduced emission intensity. Another strategy is the co-doping of activator ions such as Cr3+, Pr3+, and Sm3+.2,3,16 In general, co-doped activator ions tend to have weak absorption in the blue-light region. Nevertheless, the energy transfer between activator ions will also cause an emission decrease owing to the transfer efficiency between different donor–receiver pairs.
As another activator ion that has been studied in the YAG system, the Eu ion has a broad emission ranging from blue to red in various substrates.17 Additionally, Eu ions can be efficiently excited by deep ultraviolet (especially 254 nm), near ultraviolet (365 nm, 380 nm), and even visible light. The promising photoluminescence spectrum (PL) and excitation spectrum (PLE) distribution greatly expand its potential applications.18–21 Further, it has become a new research direction to obtain emissions from mixed-valence Eu ions in a single substrate. So far, many efforts have been made to realize the doping of divalent Eu ions in the YAG system, such as by means of charge compensation, crystal engineering and other specific approaches.22–27 However up to now, the coexistence of mixed-valence Eu ions has rarely been reported in the YAG system, and most of the existing research can only induce Eu2+-ion doping through routes involving a high heating temperature or long sintering time with a reducing agent or reducing atmosphere assistance. It was not until 2017 that Pan et al. first reported a series of YAG-based hosts suitable for divalent activator ions stabilization in a YAG system by combining a double substitution and charge-compensation strategy that was achieved with Ce3+ and Mn2+ co-doping.28
We combined the helpful concepts above and tried to further find a substituted YAG garnet matrix suitable for the coexistence of Eu ions with mixed valence. This idea brought difficulties in designing the composition and in the screening due to the introduction of substitution ions and valence transitions within the YAG system. Hence, a combinatorial approach was employed for the rapid preparation and screening of material libraries with various YAG-based compositions.
Considering that the formula of YAG-based phosphors can be simplified as A3B2C3O12, where A, B, and C represent dodecahedral, octahedral, and tetrahedral-coordinated sites, respectively, in our research, a series of alkaline earth metal ions (Me) were designed to enter the A sites to replace the Y3+, providing sites that could be occupied by the reduced Eu2+ ions. Also, Si4+ ions were designed to enter the C sites to replace Al3+ as charge compensators for substituting divalent ions (Me) and reduced Eu2+ ions after annealing. Further, phosphor libraries with the formula of MeyY3−yAl5−ySiyO12:Eux (MeYASG:Eu, Me = Mg, Ca, Sr, Ba; x = 0.001–0.05; y = 0, 0.5, 1) were synthesized by a combinatorial method in parallel microreactors and then fluorescent screening was carried out to search for the optimal compositions showing strong emission. Large-scale powder samples with the screened optimal compositions CaY2Al4SiO12:Eu0.03 were prepared by multi-step solid-state reactions in air and also with the assistance of a weak reducing atmosphere to realize Eu doping with mixed valence. The spectral characterization results further verified the reliability of the combinatorial screening of the optimal compositions. The stability, controllability, and reversibility of Eu2+ formation in the host were investigated by annealing under different conditions. Additionally, the luminescence properties, spectral tuning, and thermoluminescence of the optimized compositions were systematically investigated.
2. Experiment
2.1 Combinatorial preparation and screening of the MeYASG:Eu material libraries
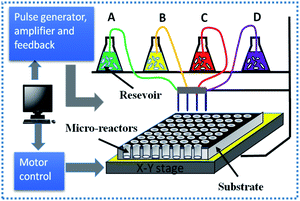
First, a dual-ion substituted MeYASG:Eu (Me = Mg, Ca, Sr, Ba) phosphor library, a {9 × 12} array, was designed and prepared, whose chemical composition could be described as Eux:MeyY3−yAl5−ySiyO12 (x = 0.001–0.05 and y = 0, 0.5, 1). Based on the designed composition map, the library was rapidly dripped through a home-designed combinatorial synthesizer, with a schematic diagram of the combinatorial synthesizer shown in Fig. 1. The motor-controlled injection system could transfer the calculated amount of different liquid precursors onto the arrayed microreactors in the sintered alumina substrate. The capacity of each microreactor was 550 μL, and the tolerance of the injection module could be controlled in the range of 1–15 μL.The needed precursor solutions of Eu ions or Y ions were prepared by dissolving the oxide Eu2O3 or Y2O3 in nitric acid, while the precursor solutions of Mg, Ca, Sr, Ba alkaline earth metal ions, and Al ions were prepared by dissolving their corresponding nitrates (Mg(NO3)2·6H2O, Ca(NO3)2·4H2O, Sr(NO3)2, Ba(NO3)2, and Al(NO3)3·9H2O) in deionized water, and the Si4+-ion precursor solution was prepared by dissolving TEOS (C8H20O4Si) in the mixture of alcohol and deionized water. After the on-demand injection of all the designed compositions, the liquid mixtures in microreactors were agitated in an in situ ultrasonic bath for 30 min and then in situ heated up to 80 °C for 3 h to vaporize water and alcohol. Finally, the mixed solution in each microreactor was dried to a gel state. The prepared library was further calcined at 600 °C for 2 h in an air atmosphere to realize nitrate pyrolysis. After the first calcination, the powder precursors within the microreactors were thoroughly ground and further calcined at 1300 °C for 2 h in an air atmosphere to obtain the expected library of MeYASG:Eu phosphors with a series of composition variations.
The prepared library was entirely irradiated by a Hg lamp with a 254 nm broadband filter and the corresponding emitting image was recorded using a digital camera (Canon EOS 600D) to evaluate the emission intensity for all the samples in the library. Based on the captured luminous image, optimal compositions showing higher emission intensities were selected as the “clue values” in the composition map. Then the “clue values” in the first library of a {9 × 6} array was subsequently utilized to design a further screening in the second library (9 × 6 array, 54 compositions) with a narrower Eu-doping content of 0.02–0.07 mol, which went through the same preparation procedures as above.
Through the above-mentioned two-step combinatorial screening process, two groups of optimized compositions with high luminescence intensity were obtained: CayY3−yAl5−ySiyO12:Eu0.03 (y = 0.5, 1, 1.5) and SryY3−yAl5−ySiyO12:Eu0.02 (y = 0.1, 0.3, 0.5). Therefore, larger scale powder phosphors with the optimal compositions were optioned and synthesized by conventional solid-state reaction methods for further heat treatment and characterization.
2.2 Synthesis of powders with optimal compositions
To verify the effectiveness of the screened optimal compositions and to carry out further spectral experiments and characterizations, larger scale powder samples with optimal compositions were prepared by a multi-step solid-state reaction. The raw materials CaO (AR), SrO (AR), Y2O3 (4N), Al2O3 (AR), SiO2 (AR), and Eu2O3 (4N) were weighed according to the stoichiometric ratio of the optimal compositions CaxY3−xAl4SiO12:Eu0.03 (x = 0.5, 1.0, 1.5) and SryY3−yAl5−ySiyO12:Eu0.02 (y = 0.1, 0.3, 0.5). The starting powders were thoroughly ground and mixed in an agate mortar with alcohol as a medium. Thereafter, the powder mixture was placed in corundum crucibles and calcined at 900 °C for 4 h in an air atmosphere, ground again, and then calcined at 1400 °C for 5 h in an air atmosphere to obtain powder samples. A part of the obtained powders was further annealed at 600–1300 °C for 1 h in a weak reducing atmosphere (RA, 5% H2 + 95% Ar) to fabricate phosphor samples Eu-doped with mixed-valence states, because the Eu2+ and Eu3+ ions can emit light at different wavelengths, to help realize spectral tuning. Moreover, to prove the reversibility of the Eu3+ ↔ Eu2+ valence state transition process, the reductively annealed phosphors were divided into several parts and further annealed several times in an air atmosphere as oxidation treatment. Additionally, a pure YAG sample without Eu doping was also prepared with the same heat treatment parameters for comparison.2.3 Materials characterization
The phase formation and crystal structure of the prepared samples were characterized by a Bruker D8 ADVANCE X-ray diffractometer with Cu Kα radiation. The XRD patterns were recorded in the 10°–90° 2θ range with 5° min−1 scanning speed and 0.02° intervals. The photoluminescence (PL) and photoluminescence excitation (PLE) spectra were measured using an F-4600 fluorescence spectrometer from Hitachi with a 150 W xenon light source (the monitoring wavelength ranged from 200 to 900 nm). Temperature-dependent fluorescence spectrum analysis was carried out on a TAP-02 type high-temperature fluorescence controller (Orient KOJI instrument Co., Ltd, temperature range: room temperature–300 °C). The thermoluminescence (TL) data of the samples were recorded using an SL08 thermoluminescence spectrometer with a 3 W mercury lamp (wavelength: 253.7 nm) as the radiation source (Guangzhou Radiation Company, China). The TL spectra were measured from room temperature to 300 °C at a heating rate of 1 °C s−1 and the photomultiplier tube voltage was 300 V.3. Results and discussion
3.1 Combinatorial screening of the composition
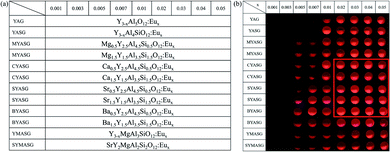
Fig. 2(a) illustrates the designed composition map of the initial {9 × 12} array library, containing 108 compositions. Eu ions with 9 increasing contents (x = 0.001–0.05 mol) were doped into 12 different matrices as indicated in the first row and first column, respectively. The compositions in rows 1–2 were designed for comparison, only including Eu doping without dual-ion substitution and Eu doping with single Si4+ substitution in the YAG matrix. In rows 3–10, considering that the valence state, ligand number, or radius of the substituted divalent ions of Me2+ and also Y3+ ion, that is Mg2+ (0.89 Å, ligand number VIII), Ca2+ (1.12 Å, ligand number VIII), Sr2+ (1.26 Å, ligand number VIII), Ba2+ (1.42 Å, ligand number VIII) and Y3+ (1.02 Å, ligand number VIII), were close to Eu ions (1.01 Å for Eu3+ and 1.25 Å for Eu2+, ligand number VIII), it was difficult to predict the final occupancy situation of the doped Eu ions, therefore, the corresponding Eu-doping content (x) was designed as an extra component in the matrix. In rows 11–12, two special cases were designed for comparison: one for Mg2+ substituting Al3+ and one for tri-ion substitution of Sr2+ for Y3+, Mg2+ for Al3+, and Si4+ for Al3+ as well.As vividly depicted in Fig. 2(b), the fluorescence intensity images of the prepared {9 × 12} library were recorded using a CCD camera under 254 nm UV excitation, showing the typical orange–red emission from the 4f–4f transition of Eu3+. Direct observation of the recorded image revealed that the composition region with higher fluorescence intensity was concentrated in the CYASG, SYASG, and BYASG samples with 2–5 mol% Eu3+ doping and dual-substituted by Ca2+/Si4+, Sr2+/Si4+, and Ba2+/Si4+ ions (located at rows 5–9, columns 6–9, framed by the red line). Since the library was calcined at 1300 °C for 2 h in an air atmosphere, it showed orange–red emission from the 5d → 4f energy level transition of Eu3+ ions under 254 nm UV excitation. The luminescence intensity of each composition with a doping concentration lower than 1 mol% was quite weak and could not even be captured by the CCD device at the same time. In addition, the fluorescence intensity of the optimal composition was also slightly higher than that of the YAG:Eu samples without dual-ion substitution (row 1), which could preliminarily indicate that the dual substitution strategy had a positive effect on enhancing the emission intensity of Eu3+ ions, owing to the shrinkage of the unit cell and strengthening of the crystal field caused by the dual-ion substitution. Therefore, the compositions within the red frame were selected for the final round of library preparation and for further screening.
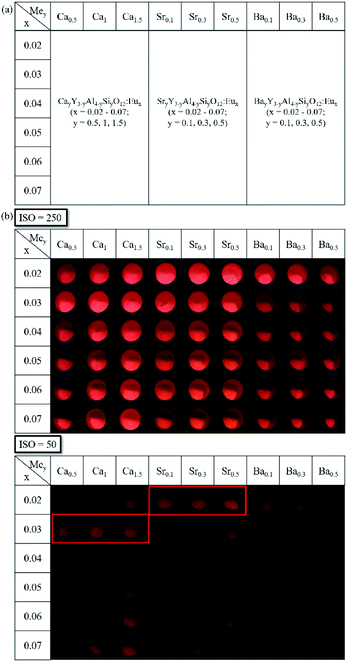
Based on the “clue compositions”, a {9 × 6} array library with 54 compositions was prepared and subsequently screened with the formula MeyY3−yAl5−ySiyO12:Eux (Me = Ca, Sr, Ba, x = 0.02–0.07, y = 0.1–1.5). It's worth noting that the oversubstitution of Si4+(y > 1) may induce a second phase of silicate in YAG hosts. Besides, it was also found in the previous research that ions with a larger radius, such as Sr2+ and Ba2+, also contribute to the generation of the second phase after entering the dodecahedron sites of the YAG host through substitution. Thus, for the further screening of the library, the substitution amounts of Si4+, Sr2+, and Ba2+ ions were reduced to 10, 30, and 50 mol% to obtain a high purity of the garnet phase. The designed composition map is shown in Fig. 3(a). The concentration of Eu3+-ion doping was extended to 2–7 mol% from top to bottom with an interval of 1 mol%, since concentration quenching of the activator ion Eu3+ was not observed during the preliminary screening process, as indicated in Fig. 2(b).
Fig. 3(b) shows the fluorescence images of the {9 × 6} library under 254 nm excitation recorded by a CCD camera with auto-sensitivity (ISO = 250, 50). The upper-left region with high fluorescence intensity could barely be distinguished by direct observation. In order to fully expose the compositions with higher fluorescence intensity and obtain more accurate comparison results, the camera ISO was also manually adjusted to a lower value of 50 when recording. After that, two groups of compositions with higher luminescence intensity were selected, as indicated by the two red frames in Fig. 3(b). Also, the optimal compositions could be initially identified as CayY3−yAl5−ySiyO12:Eu0.03 in row 2 (y = 0.5, 1, 1.5; simplified as Ca0.5, Ca1, Ca1.5) and SryY3−yAl5−ySiyO12:Eu0.02 in row 1 (y = 0.1, 0.3, 0.5; simplified as Sr0.1, Sr0.3, Sr0.5). To verify if the emission intensity change of the powders was consistent with the combinatorial screening results, powder samples with the two groups of optimal compositions were further prepared by a solid-state reaction method and then characterized.
3.2 Luminescence property of the powders with the optimal compositions
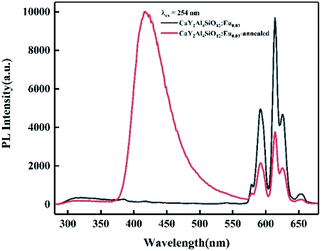
Based on the combinatorial screening results mentioned above, optimal composition phosphors of CayY3−yAl5−ySiyO12:Eu0.03 (y = 0.5, 1, 1.5) and SryY3−yAl5−ySiyO12:Eu0.02 (y = 0.1, 0.3, 0.5) were prepared by a solid-state reaction at 1400 °C for 5 h in an air atmosphere and their emission spectra were characterized as indicated in Fig. 4. At this stage, the orange–red emissions in the spectra were mainly from the 5D0 → 7FJ (J = 1, 2) transition of trivalent Eu3+ ions. Among these, the Ca-containing sample of CaY2Al4SiO12:Eu0.03 (y = 1) showed a significantly higher PL intensity than the other samples, and the PL intensities of the Ca2+/Si4+ dual-substituted samples were all higher than those of the Sr2+/Si4+ dual-substituted samples. The relative PL intensity ranking of the powder samples was: Ca1 > Ca1.5 > Ca0.5 > Sr0.5 > Sr0.3 > Sr0.1. Furthermore, from the structural analysis, as shown in Fig. 5, the XRD spectra for both the high-Ca-substituted CaY2Al4SiO12:Eu0.03 and low-Ca-substituted Ca0.5Y2.5Al4.5Si0.5O12:Eu0.03 samples matched well with the Y3Al5O12 standard pattern (PDF #73-1370), indicating that the multi-components design with Eu doping and dual-ion substitution was within a reasonable solid-solution range of the Y3Al5O12 matrix. Relatively, the CaY2Al4SiO12:Eu0.03 sample had a higher phase purity compared to the low-Ca-substituted Ca0.5Y2.5Al4.5Si0.5O12:Eu0.03 sample, which showed slightly obvious and weak diffraction peaks of the impurity phase Ca4Y6O(SiO4)6 (PDF #27-0093). Moreover, the synthesis temperature and soaking time of Ca4Y6O(SiO4)6 were very close to that of CYASG:Eu, hence it was quite difficult to avoid the impurity. Fortunately, the content of the impurities was very low, and there was no negative effect on the luminescence properties. Since the compositions of the two samples were both designed as extra Eu-ions doping in the matrix, which must inevitably lead to a little excess of Ca, Y and other elements owing to the random occupation of the doped Eu ions at the substitution sites, the formation of a small amount of impurity phase was expected. Thus, the composition of CaY2Al4SiO12:Eu0.03 (abbreviated to CYASG:Eu) was chosen for further annealing treatment in a weak reductive atmosphere (RA-annealing) to realize the transition of Eu3+ to Eu2+ and also for the spectral tuning.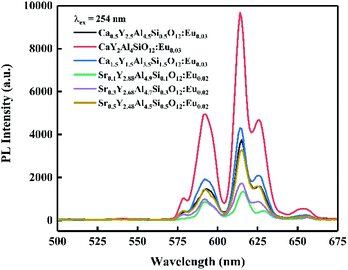 | ||
| Fig. 4 Emission spectra of CayY3−yAl5−ySiyO12:Eu0.03 (y = 0.5, 1, 1.5) and SryY3−yAl5−ySiyO12:Eu0.02 (y = 0.1, 0.3, 0.5) phosphors (λex = 254 nm), calcined at 1400 °C for 5 h in an air atmosphere. | ||
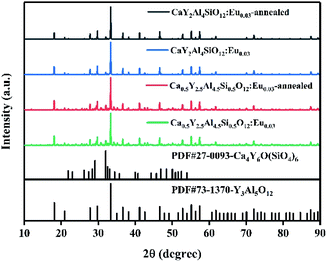 | ||
| Fig. 5 XRD spectra of CaY2Al4SiO12:Eu0.03 and Ca0.5Y2.5Al4.5Si0.5O12:Eu0.03 samples with and without RA-annealing at 1100 °C for 4 h. | ||
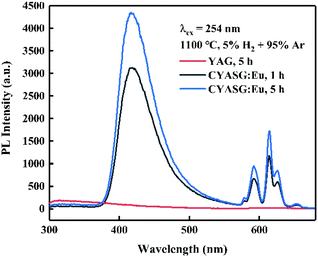 | ||
| Fig. 7 Emission spectra of CYASG:Eu samples after RA-annealing at 1100 °C for 1 h and 5 h, λex = 254 nm. | ||
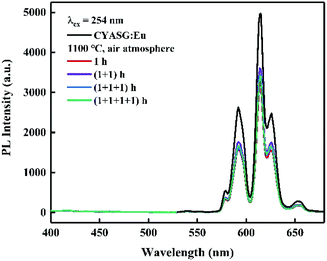
To verify the reversibility of the Eu3+ ↔ Eu2+ transition, the samples RA-annealed at 1100 °C for 4 h were re-treated at 1100 °C for 1 h in an air atmosphere for several rounds. Fig. 8 shows the emission spectra variations of the RA-annealed CYASG:Eu samples under 254 nm excitation after 4 times of re-treatment at 1100 °C for 1 h in air. The emission in the region 380–520 nm from Eu2+ ions completely disappeared, while the PL intensity of the orange–red emission from Eu3+ gradually decreased with the time increasing for re-treatment in air. The emission intensity degradation could be attributed to the multiple re-treatments at 1100 °C in air that might induce defect formation in the lattice or on the surface of the powders.
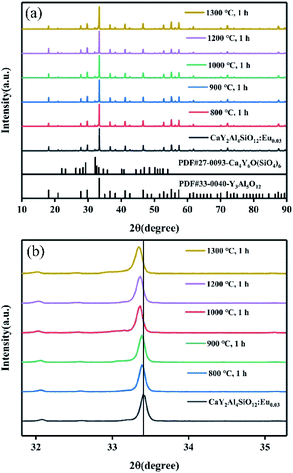 | ||
| Fig. 9 XRD patterns of CYASG:Eu samples RA-annealed at 800 °C, 900 °C, 1000 °C, 1200 °C, and 1300 °C for 1 h, (a) 2θ = 10°–90° and (b) 2θ = 32°–35°. | ||
| Sample | Lattice constant (Å) | Cell volume (Å) | R (Å) |
|---|---|---|---|
| CYASG:Eu | 11.9906 | 1723.93 | 7.1 |
| R800 | 11.9935 | 1725.18 | 6.4 |
| R900 | 11.9945 | 1725.63 | 6.8 |
| R1000 | 11.9982 | 1727.24 | 7.5 |
| R1200 | 11.9985 | 1727.34 | 7.7 |
| R1300 | 12.0005 | 1728.23 | 8.7 |
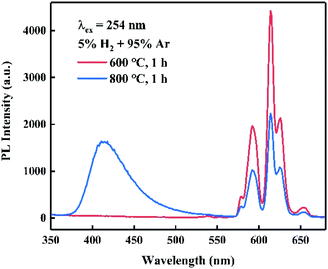
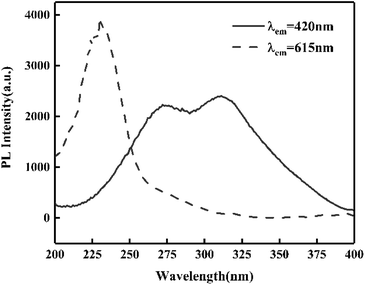
It must be noted that when the RA-annealing temperature was reduced to 600 °C for 1 h (shortened as R600), there was no blue emission from Eu2+ ions compared with the emission spectrum of R800 as illustrated in Fig. 10. It could be inferred that the valence transition from Eu3+ to Eu2+ starts in the temperature range of 600–800 °C. Moreover, the excitation spectra PLE (λem = 420 nm and 615 nm) of R800 are illustrated in Fig. 11. Monitoring at 615 nm, the PLE spectrum showed a broad band centered at 230 nm, which belonged to the Eu3+–O2− charge-transfer band. While monitoring at 420 nm, the measured broad “hump” excitation band ranging from 200–400 nm was attributed to the 4f7–4f65d1 energy level transition of divalent Eu2+ ions. This further confirmed the coexistence of two luminescence centers Eu2+/Eu3+ in the R800 sample.
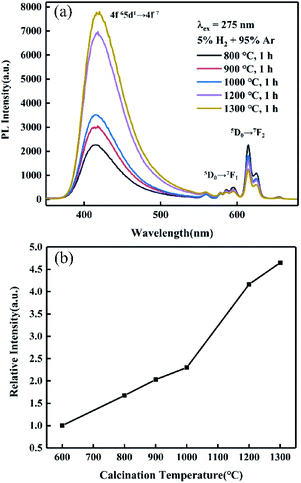
In addition, with a higher RA-annealing temperature employed, the orange–red emission from Eu3+ ion weakened, and the emission peak from Eu2+ ion (400–500 nm) was significantly increased and gradually dominated, as shown in Fig. 12(a). Surprisingly, the integrated PL intensity of the R1300 sample was 4.65 times higher than that of sample annealed at 600 °C, as seen in Fig. 12(b). This further indicated that more Eu3+ ions are reduced into Eu2+ with the assistance of RA-annealing treatment and the high emission efficiency of Eu2+ ions in CYASG matrix.
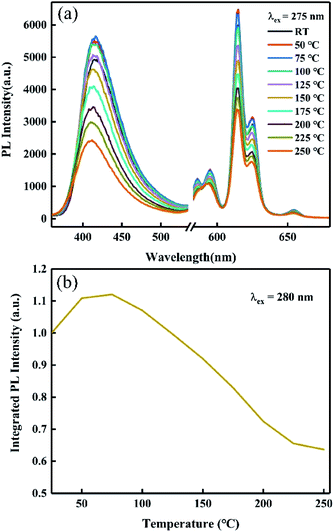 | ||
| Fig. 13 (a) Temperature-dependent PL spectra and (b) integrated intensity–temperature curve of R800, λex = 275 nm. | ||
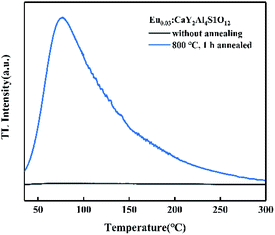
In order to find out the possible reasons for the abnormally enhanced emission, the thermoluminescence (TL) spectra, as illustrated in Fig. 14, were recorded to study the migration of excited carriers under heating as well as the trap depth, because TL measurement is one of the most effective ways to detect the concentration and distribution of defects or traps.29 The corresponding trap depth of the R800 sample was 0.701 eV, which could be roughly estimated by the classic formula E = 500/Tm, where E (eV) is the trap depth and Tm (K) is the temperature of the TL peak. The TL peak temperature of the R800 sample was about 75 °C which may correlate with its abnormally enhanced emission at 50–100 °C (Fig. 13(b)). The abnormal increase of emission between 50–100 °C was likely caused by the release of the electrons or charge carriers captured in the traps when the phosphors were excited by incident light at high temperature; that is, the electrons or charge carriers captured by traps can be gradually released to continuously compensate for the luminescence intensity loss due to normal temperature quenching under the more intensive disturbance of thermal energy. Furthermore, this abnormal temperature region of 50–100 °C is fantastically consistent with the above TL band centered at 77.28 °C, meaning that the abnormal increase in PL intensity is directly linked to the properties of the traps and the behaviors of the electrons or carriers captured by the traps. The further decrease of the luminescence intensity above 125 °C is likely from the normal non-radiative transition occurring in the higher temperature heating process, and because of the much higher thermal energy over 125 °C, the carriers or electrons stably captured in the traps are fewer and thus it is more difficult to continuously compensate for the loss of emission intensity. As for the traps or defects origination in the R800 sample, they likely resulted from oxygen vacancies and other lattice defects owing to the annealing in the reductive atmosphere, in line with some previous research on oxygen vacancy defects formation via reducing- and vacuum-atmosphere heat treatment.30,31
4. Conclusions
By a dual-ion substitution strategy, fluorescent material libraries of MeyY3−yAl5−ySiyO12:Eux were prepared by a combinatorial method in parallel microreactors and the optimal compositions were obtained through a rapid luminescence screening under ultraviolet irradiation of 254 nm. The reliability of the combinatorial screening results were verified by comparing with the corresponding powder samples prepared in parallel solid-state synthesis, confirming an optimal composition of CayY3−yAl5−ySiyO12:Eu0.03 (CYASG:Eu) with the highest luminescence intensity.Fluorescence characterization of the optimal CYASG:Eu samples annealed in a weak reducing atmosphere (RA) demonstrated the coexistence of divalent/trivalent Eu ions, and reversibility of the Eu3+ ↔ Eu2+ valence transition process was possible by controlling the temperature, duration, and atmosphere of annealing. As a result, the dominant emissions can be effectively tuned from the orange–red lighting of Eu3+ (f–f transition) to the blue lighting of Eu2+ (5d–4f transition).
With the generation of Eu2+, the integrated intensity of the PL spectrum obviously increased. The temperature-dependent photoluminescence spectra of the RA-annealed CYASG:Eu phosphors showed excellent thermal quenching resistance, at ∼110% of the room temperature PL intensity under 75 °C measurement condition and ∼63% at 250 °C. The TL spectrum proved the existence of trap energy levels in the phosphors that may compensate for the emission loss to some extent at the corresponding temperatures and can also explain the abnormal increase in the PL intensity in the 50–100 °C region.
This research work shows the high efficiency and reliability of the combinatorial preparation and screening of dual-ion substituted YAG-based phosphors. By combination of the double substitution of cation ions and RA-annealing, we provide a new approach to create the coexistence of activators with mixed-valence states in the YAG system. The prepared CYASG:Eu phosphors possessed a highly tunable spectra property and excellent thermal stability and they showed application prospects in the field of plant light supplement as luminescent materials for energy-saving light sources.
Author contributions
Zhehan Zheng contributed to writing – original draft and experimental operation; Mingxue Deng contributed to manuscript preparation with constructive discussions. Caiyan Wang performed the guidance of instruments. Xiang Zhang helped to perform the experiment; Qian Liu contributed significantly to writing – review & editing; Xiaoke Xu and Le Gao helped to set up experimental apparatus.Conflicts of interest
There are no conflicts to declare.Acknowledgements
Many thanks for the financial supports from the National Key Research and Development Program of China (grant no. 2016YFB0700204 and 2018YFB0704103) and the Foundation of Shanghai Science and Technology Committee (grant no. 18511110400).References
- Y. Wang, G. Zhu, S. Xin, Q. Wang, Y. Li, Q. Wu, C. Wang, X. Wang, X. Ding and W. Geng, J. Rare Earths, 2015, 33, 1–12 CrossRef CAS.
- H. S. Jang, W. B. Im, C. L. Dong, D. Y. Jeon and S. K. Shi, J. Lumin., 2007, 126, 371–377 CrossRef CAS.
- L. Wang, X. Zhang, Z. Hao, Y. Luo and J. Zhang, Opt. Express, 2010, 18, 25177–25182 CrossRef CAS PubMed.
- T. Gao, J. Tian, Y. Liu, R. Liu and W. Zhuang, Dalton Trans., 2021, 50, 3769–3781 RSC.
- D. Sun, L. Zhang, Z. Hao, H. Wu, H. Wu, Y. Luo, L. Yang, X. Zhang, F. Liu and J. Zhang, Dalton Trans., 2020, 49, 17779–17785 RSC.
- R. J. Xie, N. Hirosaki, N. Kimura, K. Sakuma and M. Mitomo, Appl. Phys. Lett., 2007, 90, 191101 CrossRef.
- W. Wang, J. Tang, T. H. Sheng, W. Jing and B. P. Sullivan, Chem. Phys. Lett., 2008, 457, 103–105 CrossRef CAS.
- H. Yang and Y. S. Kim, J. Lumin., 2008, 128, 1570–1576 CrossRef CAS.
- Q. Du, S. Feng, H. Qin, H. Hua, H. Ding, L. Jia, Z. Zhang, J. Jiang and H. Jiang, J. Mater. Chem. C, 2018, 6, 12200–12205 RSC.
- X. Ding, W. Geng, Q. Wang and Y. Wang, RSC Adv., 2015, 5, 98709–98716 RSC.
- Y. Shi, Z. Ge, M. Mikami, Y. Shimomura and Y. Wang, Dalton Trans., 2014, 44(4), 1775–1781 RSC.
- Y. Xiao, W. Xiao, L. Zhang, Z. Hao, G. H. Pan, Y. Yang, Z. Xia and J. Zhang, J. Mater. Chem. C, 2018, 6, 10–1039 RSC.
- C. C. Chiang, M. S. Tsai and M. H. Hon, J. Electrochem. Soc., 2007, 154, J326 CrossRef CAS.
- J.-G. Li and Y. Sakka, Sci. Technol. Adv. Mater., 2015, 16, 14902–14919 CrossRef PubMed.
- M. Shang, J. Fan, H. Lian, Y. Zhang, D. Geng and J. Lin, Inorg. Chem., 2014, 53, 7748–7755 CrossRef CAS PubMed.
- Y. Zhou, J. Lin, Y. Min, S. Wang and H. Zhang, Mater. Lett., 2002, 56, 628–636 CrossRef CAS.
- M. Shang, C. Li and J. Lin, Chem. Soc. Rev., 2014, 43, 1372–1386 RSC.
- G. Y. Lee, J. Y. Han, W. B. Im, S. H. Cheong and D. Y. Jeon, Inorg. Chem., 2012, 51, 10688–10694 CrossRef CAS PubMed.
- V. Tsiumra, A. Krasnikov, S. Zazubovich, Y. Zhydachevskyy and A. Suchocki, J. Lumin., 2019, 213, 278–289 CrossRef CAS.
- C. Yang, G. Song, J. Miao and T. Fan, Dalton Trans., 2021, 50, 3769–3781 RSC.
- I. E. Kolesnikov, D. V. Mamonova, M. A. Kurochkin, E. Y. Kolesnikov and E. Lhderanta, Opt. Mater., 2021, 112, 110797 CrossRef CAS.
- M. Sugiyama, T. Yanagida, Y. Fujimoto, Y. Yokota, A. Ito, M. Nikl, T. Goto and A. Yoshikawa, Opt. Mater., 2012, 35, 222–226 CrossRef CAS.
- Y. Chen, D. Feng, S. Xu, S. Zeng and X. Wei, Mater. Lett., 2016, 164, 180–182 CrossRef CAS.
- G. A. Petrosyan, R. H. Asatryan, L. K. Hovhannesyan, V. M. Derdzyan and P. S. Feofilov, Mater. Chem. Phys., 2017, 185, 39–43 CrossRef.
- Q. Q. Zhu, W. W. Hu, L. C. Ju, L. Y. Hao, X. Xu and S. Agathopoulos, J. Am. Ceram. Soc., 2013, 96, 701–703 CrossRef CAS.
- Z. Ming, J. Qiao, M. S. Molokeev, J. Zhao and Z. Xia, Inorg. Chem., 2020, 59, 1405–1413 CrossRef CAS PubMed.
- L. Havlák, J. Bárta, M. Buryi, V. Jarý, E. Mihóková, V. Laguta, P. Boháček and M. Nikl, J. Phys. Chem. C, 2016, 120, 21751–21761 CrossRef.
- Z. Pan, J. Chen, H. Wu and W. Li, Opt. Mater., 2017, 72, 257–264 CrossRef CAS.
- K. Eeckhout, A. Bos, D. Poelman and P. F. Smet, Phys. Rev. B, 2013, 20, 196 Search PubMed.
- J. Trojan-Piegza and E. Zych, J. Phys. Chem. C, 2014, 114, 4215–4220 CrossRef.
- J. Trojan-Piegza, J. Niittykoski, J. Hoelsae and E. Zych, Chem. Mater., 2008, 20, 2252–2261 CrossRef CAS.
| This journal is © The Royal Society of Chemistry 2021 |

