 Open Access Article
A coupling process of electrodialysis with oxime hydrolysis reaction for preparation of hydroxylamine sulfate
Fenggang Guan,
Yanyan Chen,
Yuying Zhang and
Rujun Yu *
*
School of Chemistry and Chemical Engineering, Shandong University of Technology, Zibo, 255049, PR China. E-mail: zbyurj@163.com
First published on 27th May 2021
Abstract
A coupling process of electrodialysis with oxime hydrolysis reaction for preparing hydroxylamine sulfate was developed in this work. The three steps, including the oxime hydrolysis, the hydroxylamine protonation reaction, and the separation process, are integrated into a triple-chamber electrodialysis stack. In this novel method, the impacts of current density, oxime concentration, and reaction time were investigated. The results indicated that the decomposition voltage is above 1.93 V. Furthermore, the current density is 4.69 × 10⁻² A cm−2, the oxime concentration is 1.00 mol L−1, and when reaction time reaches 600 min, the yield of hydroxylamine sulfate is 67.59%. Moreover, the process has excellent mass transfer performance, mild reaction conditions, and simple operation compared with conventional methods. This work will provide a theoretical basis for the green and continuous manufacture of hydroxylamine sulfate and a guide for preparing other hydroxylamine salts through such hydrolysis methods.
1. Introduction
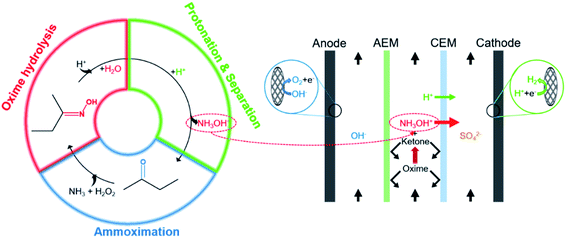
Hydroxylamine is an essential intermediate used extensively in the chemical,1 pharmaceutical,2 military,3 and nuclear4 industries. Conventional methods for preparing hydroxylamine include the Raschig method,5 the nitroalkane hydrolysis method,6 the nitric oxide catalytic reduction method,7 and the nitrate reduction method.8 However, there are numerous disadvantages to these approaches. For example, the Raschig method and the nitroalkane hydrolysis method have a lengthy procedure, low yield, and inseparable byproducts, such as ammonium salt and carboxylic acid. Both the nitric oxide reduction method and the nitrate catalytic reduction method use precious metals, such as Pt and Pd, which increases preparation and regeneration costs. Notably, the hydrogenation process imposes greater demands on equipment, operation, and safety.In recent years, the implementation of the ammoximation significantly lowered the cost of oxime.9 A combination of ammoximation and oxime hydrolysis, known as the A–O–H route (Fig. 1), has been proposed and attracts researchers. First, oxime synthesizes from low-cost O2 or H2O2, NH3, and ketone or aldehyde in the ammoximation process. Then, oxime undergoes a hydrolysis reaction in a strong acid solution, such as sulfuric acid and hydrochloric acid, to produce (NH2OH)2·H2SO4, NH2OH·HCl, or other corresponding acid salts, while ketone or aldehyde is recycled for the ammoximation process. Despite this, since the forward reaction rate is much smaller than the reverse, the hydrolysis process suffers from a low conversion.10,11
To break the balance and facilitate the hydrolysis reaction, using separation technologies, such as distillation,12 extraction,13 and pervaporation membrane reaction,14 to isolate ketone or aldehyde from the solution. It has proven to be feasible. Nonetheless, the product purity and the thermal efficiency of distillation are low. Extraction technology has a high yield (over 80%, even more than 90%), but it may introduce new impurities in particular extractants and add excessive steps or operating time, such as standing and layering. Additionally, this method is intermittently involved in operations. Pervaporation membrane reaction achieves continuous preparation of hydroxylamine. However, due to its low removal rate of butanone relative to the hydrolysis rate, its efficiency is not high. When temperature is 30 °C, it took over 80 hours to reach the maximum yield (80%). Even though increasing temperature to 60 °C, it took about 40 hours.
Electrodialysis (ED) is an extraordinarily mature and effective separation technique widely used in varieties of fields, such as seawater desalination,15,16 wastewater treatment,17–19 food,20,21 and pharmaceutical22–26 industries. The keys to isolation and aggregation of target ions or molecules are the selective permeability of ion exchange membranes (IEMs) and the directional migration of ions under an electric field. Z. Wang et al.17 recycled butyric acid and adipic acid from a solution containing cyclohexanone by a single-IEM reactor. This method has simple operation, low energy consumption, and cyclohexanone absence compared with the traditional methods. V. Magne et al.18 combined the ED technique and the decomposition reaction to eliminate urea in wastewater and realized the green treatment. S. S. Yi et al.21 developed a back-extraction method coupled with the electro-electrodialysis technology to integrate the back-extraction and the separating process into the electro-electrodialysis stack, where the mass transfer efficiency is higher than conventional approaches. At the same time, the equipment cost is lower than them. Except for selective separating and concentering, another distinguishing characteristic of the ED technology is that it can couple with other processes or technologies to incorporate several processes or reactions into the ED stack, thereby making the coupling process more eco-friendly, cost-effective, and high-efficiency.
The pore diameter of IEMs usually distributes between a few nanometers and hundreds of nanometers.27 Generally, the ion radius is much smaller than the pore. Thus ions, even with a high molecular weight, such as organic acid,17 ionic liquid,28 and quaternary ammonium salt,29 can penetrate through IEMs, whereas the molecules cannot penetrate through them because of the Donnan equilibrium.30
NH2OH can be regarded as a high electronegative group (–NH2) substituting one of the hydrogen atoms in the H2O or as a strong electron-withdrawing group (–OH) substituting one of the hydrogen atoms in the NH3.31 Consequently, NH3OH+ will be formed even in an aqueous solution,32 especially in acid solutions.33 Furthermore, the ionic radius of NH3OH+ is similar to that of sodium ions.34 It means that NH3OH+ can penetrate through the IEMs as easily as sodium ions.
| NH2OH + H2O ⇄ NH3OH+ + OH− | (1) |
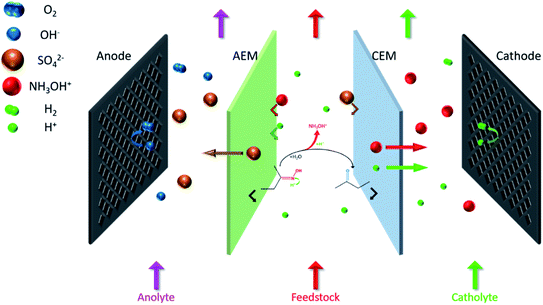
The coupling process is mainly divided into three steps (Fig. 2). First, H+ attacks the nitrogen atom of butanone oxime in the feedstock and catalyzes the combination of oxime and H2O, and then the intermediate hydrolyzes to NH2OH and butanone. Second, H+ protonates NH2OH to form NH3OH+. Finally, under an external electric field, NH3OH+ and SO42− migrate through the cation exchange membrane (CEM) and the anion exchange membrane (AEM) to the cathode chamber and the anode chamber, respectively. In contrast, butanone and oxime will be intercepted by them.17
In this work, a novel coupling of the hydrolysis reaction with the ED technique was proposed, integrating butanone oxime hydrolysis, hydroxylamine protonation, and separation into the ED stack. Meanwhile, the effects of current density, oxime concentration, and reaction time on the key parameters, such as cell voltage, hydroxylamine concentration, yield, and current efficiency, were investigated in this work. Furthermore, this method has distinct advantages in terms of mild reaction conditions, simple operation, and excellent yield over the other methods. Finally, propose improvement measures for the problems or phenomena in the experiment. This work is the first study to report the hydrolysis–electrodialysis coupling process to the best of our knowledge. We hope our work will provide a theoretical basis for the green and continuous hydroxylamine manufacture and guidance for practical applications.
2. Experimental section
2.1 Setup of the ED stack
Fig. 3 shows the experimental setup. The ED stack applied a typical double-membrane triple-chamber structure: an AEM (AR204, Shenzhen Maiborui Technology Co. Ltd., Shenzhen, China) and a CEM (CR67, Shenzhen Maiborui Technology Co. Ltd., Shenzhen, China), these two membranes divide the inner cavity into an anode chamber, an intermediate chamber, and a cathode chamber. Characteristics of membranes were listed in Table 1. The prepared solutions were delivered from bottom to top to better vent the hydrogen and oxygen generated by the electrode reaction. Simultaneously, buffer tanks and peristaltic pumps (Baoding Ditron Electronic Technology Co. Ltd., Hebei, China) were adopted for circulation to eliminate the polarization effect as completely as possible. Besides, used disc-shaped condenser tubes and the low-temperature cooling liquid circulation pump (DLSB-10, Zhengzhou Greatwall Scientific Industrial and Trade Co. Ltd., Henan, China) for constant temperature.| Selective transmittance (%) | Area resistance (Ω cm2) | Thickness (mm) | Ion exchange capacity (meq g−1) | |
|---|---|---|---|---|
| a The supplier provided these characteristic data. | ||||
| CR67 | >94 | <5 | 0.3 | >2.1 |
| AR204 | >95 | <5 | 0.2 | |
This work used a titanium-based material as the electrodes (Baoji Ziming Special Metals Co. Ltd., Shanxi, China) and connected them with the DC power supply (PS305D, Shenzhen Yizhan Instrument Co. Ltd., Shenzhen, China). The coating (RuO2)x(IrO2)1−x (x ≈ 0.5) improves the stability of the electrodes and enables the electrodes to obtain lower overpotential of hydrogen evolution reaction (HER) and oxygen evolution reaction (OER).
2.2 Procedure
Fig. 4 visually shows three steps of the coupling process in the ED stack, including oxime hydrolysis reaction, the hydroxylamine protonation reaction, and the separation process. For the stability of hydroxylamine, H2SO4 is sufficient in both the intermediate chamber and the cathodic chamber. First, prepared 1.0 L of 0.50 mol per L H2SO4 (Yantai Far East Fine Chemical Co. Ltd., Shandong, China), 1.00 mol per L H2SO4 and 0.50 mol per L–2.00 mol per L butanone oxime (Beijing Balinwei Technology Co. Ltd., Beijing, China), and 1.00 mol per L NaOH (Tianjin Beilian Fine Chemicals Development Co. Ltd., Tianjin, China) as catholyte, feedstock, and anolyte, respectively. Passed through coolants of 25 °C. Second, the pump rotation speed was adjusted so that the three chambers had the same mass flow rate (135.0 g min−1) to assure consistent hydrodynamic conditions. Finally, after venting the bubbles, experiments were under a constant current (0.50–5.00 A). Record the cell voltage and test the concentration of hydroxylamine every 30 minutes.2.3 Analysis method and calculation
The determination of the concentration of NH2OH by oxidation-reduction titration.35 0.02 mol per L KMnO4 standard solution (Nanjing Chemical Reagent Co. Ltd., Nanjing, China) and 250 g per L NH4Fe(SO4)2 aqueous solution (Tianjin Zhiyuan Chemical Reagent Co. Ltd., Tianjin, China) were self-prepared.
 | (2) |
 | (3) |
Current efficiency refers to the current utilization rate, which is a crucial indicator to evaluate the ED process.
 | (4) |
2.4 Mass transfer equation
The mass transfer process of ED is mainly composed of mass transfer by convection, diffusion, and electromigration. Mass transfer is useful only when the direction of mass transfer is perpendicular to the membrane surface (defined as the x-axis direction). Thus, the ion flux generally only considers one-dimensional mass transfer in the x-direction, and the overall mass transfer (Ji) can be expressed by the Nernst–Planck extended equation.36
 | (5) |
 . ui is the mobility of ion i. JE represents the electromigration mass transfer under the electric potential gradient
  . zi is the charge number of ion i.
The IEMs have a compact structure, so the convective and the diffusion mass transfer in IEMs can be ignored. The mass transfer in the IEMs mainly depends on electromigration, and eqn (5) can be simplified as follows.
 | (6) |
![[C with combining macron]](https://www.rsc.org/images/entities/i_char_0043_0304.gif) i is concentration of ion i in the membrane. And various ions meet the condition of electrical neutrality in the membrane. Therefore,
i is concentration of ion i in the membrane. And various ions meet the condition of electrical neutrality in the membrane. Therefore,![[C with combining macron]](https://www.rsc.org/images/entities/i_char_0043_0304.gif) i and the amount of fixed active groups can be represented by the following formula.
i and the amount of fixed active groups can be represented by the following formula.
∑zi![[C with combining macron]](https://www.rsc.org/images/entities/i_char_0043_0304.gif) i + ω i + ω![[C with combining macron]](https://www.rsc.org/images/entities/i_char_0043_0304.gif) = 0 = 0
| (7) |
![[C with combining macron]](https://www.rsc.org/images/entities/i_char_0043_0304.gif) are the charge number and the concentration of fixed active groups in the membrane, respectively.
are the charge number and the concentration of fixed active groups in the membrane, respectively.
Besides, the flux of various ions and the current density have the following relationship.
 | (8) |
2.5 Cell voltage of the ED stack
The ED stack is essentially one of the various types of electrolysis cells. The most significant difference is that it uses IEMs with ion selectivity. Therefore, the cell voltage can be expressed by the electrolytic cell voltage formula containing the membrane potential.37| Utotal = ER + ΔENR + EM + IR | (9) |
The number of electrons in the ED process is conserved. Hence, along with the migration of ions under an electric field, oxidation or reduction reactions must occur on the electrodes. As for which ion reacts preferentially, it is determined by standard electrode potential. The possible reactions of each ion are lists as following.
Anodic reaction:
 | (10) |
 | (11) |
 | (12) |
Cathodic reaction:
 | (13) |
 | (14) |
According to the standard potential, eqn (10) takes precedence over eqn (11) on the anode, and eqn (12) is impossible. Likewise, eqn (13) takes precedence over eqn (14) on the cathode.
Overall reaction (anodic reaction and cathodic reaction):
 | (15) |
 | (16) |
 | (17) |
 | (18) |
Eqn (15) represents the electrode potential at the beginning of the experiment. Eqn (16) and (17) represent the electrode potential when either H+ of the catholyte or OH− of anolyte is depleted. Eqn (18) represents the electrode potential when both the H+ and OH− are entirely consumed.
When there is no current through the electrodes (I = 0), the electrodes are in equilibrium, and the ohmic drop is zero (IR = 0). As a result, the cell voltage reaches the minimum value called the decomposition voltage (EDP).38 Due to the electrode polarization effect, it is higher than ER. It is necessary for the ED stack involving reactions and processes,39 such as the HER, the OER, and the mass transfer process.
| EDP = ER + ΔE0NR + EM | (19) |
For an ED stack with a small number of membrane couples, the overpotential occupies a larger proportion of the cell voltage or voltage drop. Thus, it is necessary to attach the impacts of the electrode polarization effect on the cell voltage. Overpotential is classified into concentration overpotential (φc), electrochemical overpotential (φe), and resistance overpotential (φr).
| ΔENR = φc + φe + φr | (20) |
Prepare the aqueous solutions with fresh ultrapure water (>18 MΩ) which does not contain ions that are easy to precipitate, such as Ca2+, Mg2+, HCO3−, and CO32−. It means that there is no passivation layer on the electrode surface so that φr can be ignored. Rather, φc and φe cannot. On the one hand, H2 and O2 provide strong disturbance for the solution and the electrodes, reducing the φc to a certain extent. However, the solution flow pattern is laminar. It is easy to form a concentration gradient. On the other hand, φe is usually high because the HER and the OER require high activation energy.
 | (21) |
φe = a + b![[thin space (1/6-em)]](https://www.rsc.org/images/entities/char_2009.gif) lg(i) lg(i)
| (22) |
The membrane potential is related to the migration of ions through the membrane. When there is a concentration gradient of the ions on both sides of the membrane, the ions migrate from the high-concentration side to the low-concentration side, causing the solutions to be positively or negatively charged, thus forming a potential gradient.44
 | (23) |
 and
and  are the transference numbers of cations and anions in the membrane, respectively.
For the ideal CEM:  . The high-concentration side is negatively charged.
For the ideal AEM:  . The high-concentration side is positively charged.
The ohmic drop is an essential part of the cell voltage, reflecting the change in the resistance of the membranes and the solution.
| IR = iS(RAEM + RCEM + RCA + RFS + RAN + Rl) | (24) |
The membrane electrical conductivity is an essential indicator of IEMs that reflects the migration rate of ions in the membranes, usually expressed by surface resistance. And, the resistance of a solution is the inverse of the conductance. When the temperature is constant, the solution conductivity is closely related to the concentration and ions species.
 | (25) |
In summary, eqn (9) can be expressed by a logarithmic function with I or i as an independent variable.
Utotal = ER + ΔENR + EM + IR = α + β![[thin space (1/6-em)]](https://www.rsc.org/images/entities/char_2009.gif) log log![[thin space (1/6-em)]](https://www.rsc.org/images/entities/char_2009.gif) i + RI i + RI
| (26) |
3. Result and discussion
The ED process has two major operating modes: constant voltage mode and constant current mode.19,47 The constant current mode is usually a superior alternative due to its simplification for calculating the mass transfer equation. In parallel, it is more intuitive to observe changes in electrochemical properties, such as cell voltage and current efficiency.3.1 Cell voltage vs. current intensity
The relationship between cell voltage and current intensity or current density illustrates electrochemical properties, such as EDP and limiting current density (LCD), providing a valuable reference for determining the operating conditions. For example, when the current intensity tends to zero, cell voltage reaches the minimum value (EDP) at which the ED stack can work. Moreover, the voltage curve will jump as the current density increases to a particular value, which is the LCD representing the maximum current density for regular operation. As well, it has a profound impact on current efficiency and energy consumption.Fig. 5 shows the initial cell voltage curve under different current intensities through the ED stack. According to eqn (26), the voltage curve can be fitted as a function (the green curve in Fig. 5a): Utotal = 1.94 + 0.23![[thin space (1/6-em)]](https://www.rsc.org/images/entities/char_2009.gif) log
log![[thin space (1/6-em)]](https://www.rsc.org/images/entities/char_2009.gif) I + 0.82I. As defined by the EDP, make a tangent to the voltage curve in Fig. 5a, then extend it to intersect the coordinate axis, and the intercept value represents the EDP. It can be seen that the EDP of the fitted curve is 1.93 V.
I + 0.82I. As defined by the EDP, make a tangent to the voltage curve in Fig. 5a, then extend it to intersect the coordinate axis, and the intercept value represents the EDP. It can be seen that the EDP of the fitted curve is 1.93 V.
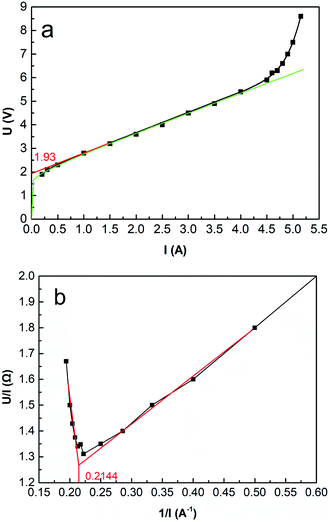 | ||
| Fig. 5 (a) Initial cell voltage versus current intensity. Coxime = 1.00 mol L−1, mass velocity = 135.0 g min−1, T = 25 °C. (b) R − 1/I curve. | ||
As the current intensity increases, the actual voltage gradually deviates from the fitted curve, and when the current exceeds 4.50 A (i = 4.69 × 10⁻² A cm−2), the voltage curve occurs a jump. The reason for this phenomenon is related to the concentration polarization effect around the surfaces of the IEMs. Since the ions in the bulk solution cannot migrate to the diffusion boundary layer in time, the ions are depleted in the diffusion boundary layer, resulting in a significant decrease in conductivity. Another typical method of calculating the LCD is using the electric resistance versus the reciprocal value of the current (R − 1/I) curve.48 As shown in Fig. 5b, 1/I equals 0.2144 A−1, the LCD equals 4.85 × 10⁻² A cm−2.
3.2 Effect of current density
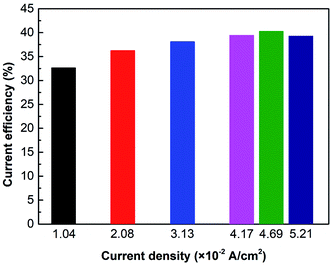
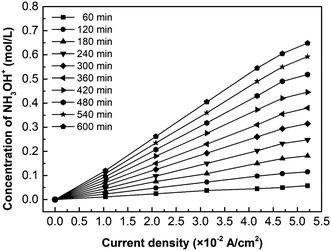
Fig. 6 shows the current efficiency under different current densities. Results reveal that when i = 4.69 × 10⁻² A cm−2, the current efficiency reaches the maximum value of 40.3%. However, when the current density exceeds 4.69 × 10⁻² A cm−2, the current efficiency will decrease. It is due to the concentration polarization effect and water molecules dissociation. As mentioned previously, the cell voltage leaps when concentration polarization occurs in the ED stack. Furthermore, the high voltage leads water molecules at the membrane surface to dissociate into H+ and OH−, which carry the current, reducing the transference number of NH3OH+.36 As a result, the current efficiency is going down.Fig. 7 shows the effect of current density on the hydroxylamine concentration. It is well-known that the overall ions flux in the membrane is proportional to the current density. As expected, the hydroxylamine concentration is almost proportional to the current density, whereas its increasing trend decreases as the current density exceeds the LCD. In addition to the concentration polarization effect reducing the current efficiency, there is another explanation: the number of fixed groups in the membrane determines the flux based on eqn (6) and (7).
3.3 Effect of concentration of oxime
Fig. 8 shows the effect of oxime concentration on cell voltage. In this case, the conductivity or resistance of the solution has a profound impact on cell voltage, according to eqn (9) and (24). Results show that the cell voltage and the total electrical resistance increase as oxime concentration increases. Furthermore, if the oxime concentration exceeds 1.00 mol L−1, the higher the oxime concentration, the greater the cell voltage. As is well-known, various factors can affect the solution conductivity, such as ion concentrations, the solution viscosity, the type of ions, and the solution temperature. On the one hand, the nitrogen atom in the oxime molecules has a lone pair of electrons attracting H+ in the solution and combining with the water molecule to form an intermediate.10 Hence, the more oxime added, the less the number of freely movable H+. On the other hand, oxime molecules can form hydrogen bonds both with water molecules and themselves, forming dimers.49 Consequently, the solution viscosity increases, while the ion mobility and the conductivity decrease.50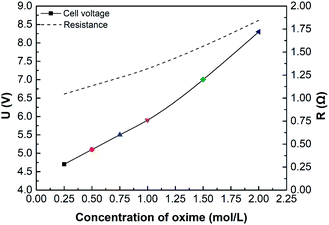 | ||
| Fig. 8 The effect of initial oxime concentration on initial cell voltage or resistance. i = 4.69 × 10⁻² A cm−2. | ||
Fig. 9 shows the effect of oxime concentration on the hydroxylamine concentration. Based on the principle of chemical equilibrium, increasing the initial concentration of reactants generally improves the forward reaction rate and the equilibrium concentration of products. Moreover, according to eqn (5), the diffusion flux increases as the concentration increases, so the hydroxylamine concentration increases with the initial oxime concentration. However, results also demonstrate that when the oxime concentration exceeds 1.00 mol L−1, its increasing tendency declines. This phenomenon will be discussed in Chapter 3.4.
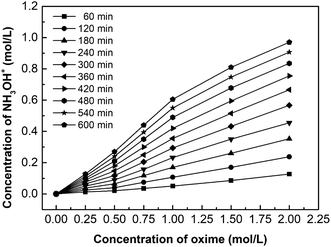 | ||
| Fig. 9 The effect of oxime concentration on the hydroxylamine concentration. i = 4.69 × 10⁻² A cm−2. | ||
Fig. 10 shows the effect of oxime concentration on the yield of hydroxylamine and current efficiency. The yield of hydroxylamine and current efficiency increased with the increase of oxime concentration. As is known, the higher the concentration of oxime, the more products per unit time. In ED process, H+ and NH3OH+ compete each other for crossing the membranes. Since the membrane is not in an ideal state, diffusion transfer cannot be ignored. The higher concentration has a greater the driving force for diffusion increasing the transference number, thereby the current efficiency increase with the oxime concentration. As for yield of NH3OH+, when the oxime concentration is 1.00 mol L−1, the yield reached a maximum of 67.59%. Hence, if the oxime concentration increased exceed 1.00 mol L−1, the yield decreased. Due to reactant concentration cannot change the reaction equilibrium constant when the temperature is constant. In other words, since the concentration of H+ does not increase, there is not enough H+ to react with excess oxime. As more oxime was added, the conversion of oxime decreases, thereby decreasing the yield.
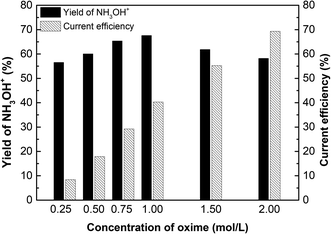 | ||
| Fig. 10 The effect of oxime concentration on the yield of hydroxylaminea and current efficiency. i = 4.69 × 10⁻² A cm−2, time = 600 min, and concentration of H2SO4 equals 1.00 mol L−1. | ||
3.4 Effect of time
The ED stack parameters, such as cell voltage and hydroxylamine concentration, will change with the mass transfer process and reactions, such as hydrolysis reaction and electrode reaction. Cell voltage is the sum of partial voltages in the ED stack, and various factors may change may be one or more of them, such as electrode potential, overpotential, and ohmic drop. Therefore, it is significant to study cell voltage, which reflects the electrochemical performance.Fig. 11 shows the curves of the cell voltage over time under different current densities. Results show that the cell voltage curve rises over time. As well, the stronger the current, the earlier the upward tendency appears. For example, do the tangent line to the voltage curve of different current density (i = 4.69 × 10⁻² A cm−2, 4.17 × 10⁻² A cm−2, and 3.13 × 10⁻² A cm−2), we found that when time = 270 min, 300 min, and 420 min, the slope of curves (hollow five-pointed stars marked in Fig. 11) increase significantly. Calculate using Faraday's law: OH− in feedstock is consumed by 75.6%, 74.6%, and 78.3%, respectively. It may cause H2O instead of OH− undergoing the OER on the anode. Besides, with the ED process, the concentration of SO42− in the anolyte gradually increased while OH− decreases. However, ionic mobility of SO42− is lower than that of OH−, and then the anolyte conductivity decreases.16
Overall, the solute concentration and the ion species are the main factors of the trend. Moreover, the solute concentration may have two significant effects, which are conductivity and electrode potential. On the one hand, the ion concentration decreases, thereby decreasing the conductivity of the solution. On the other hand, a decrease in concentration may lead to an increase in the electrode potential. It means that replenishing the NaOH and H2SO4 can avoid or eliminate this phenomenon.
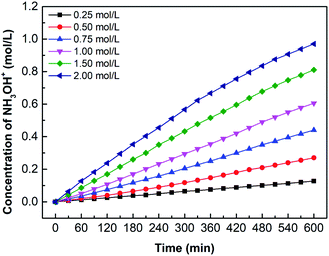
Fig. 12 shows the hydroxylamine concentration curves over time for different oxime concentration. Since hydroxylamine is not involved in chemical reactions or decomposes, hydroxylamine gradually accumulates in the catholyte over time. In other words, the concentration is proportional to time. However, the concentration curves become flat when the concentration reaches about 0.5 mol L−1. For example, the oxime concentration equals 1.00 mol L−1, as its hydroxylamine concentration comes to 0.52 mol L−1, the increasing tendency decreases. Likewise, 1.50 mol L−1 and 2.00 mol L−1 have the same trend when hydroxylamine concentration reaches 0.56 mol L−1 and 0.62 mol L−1. It results from high osmotic pressure on both sides of the CEM, which also explains why the concentration of oxime exceeds 1.00 mol L−1, the increasing tendency of the concentration curve declines. Higher reactant concentration can obtain a greater driving force for diffusion as well as higher osmotic pressure. However, the high osmotic pressure not only makes mass transfer difficult but also promotes water penetration. Therefore, removing the catholyte and replenishing the fresh catholyte in time would ensure the continuous mass transfer process.
4. Conclusion and prospect
We developed a coupling process of electrodialysis with hydrolysis reaction to improve yield and simplify the operation process involved in the oxime hydrolysis preparing hydroxylamine sulfate. This method uses sulfuric acid as the catalyst and reactant in the protonation reaction and combines with the efficient ED technology. Compared with the traditional methods, this novel method has better mass transfer efficiency, simpler operation, and realizes a continuous production process. This work also studied the electrochemical performance and found that the decomposition voltage needs to be above 1.93 V. The experiment investigated the effects of current density, oxime concentration, and reaction time on hydroxylamine concentration, yield, current efficiency, and cell voltage. The results indicate that the current density is 4.69 × 10⁻² A cm−2, oxime concentration is 1.00 mol L−1, and when reaction time reaches 600 min, the yield of hydroxylamine sulfate reaches 67.59% (25 °C). The yield per time is higher than other methods. However, the solution should be removed and replenished in time. On the one hand, the high osmotic pressure will not only make mass transfer difficult but cause reverse osmosis. On the other hand, the low ion concentration may reduce the conductivity causing a high cell voltage and the penetration of H2O. This work will provide a theoretical basis for the green and continuous manufacture of hydroxylamine sulfate and guidance for other hydroxylamine salts through such hydrolysis method.Conflicts of interest
There are no conflicts to declare.Acknowledgements
This research is supported in part via the Programs of Shandong University of Technology (No. 9101-217196).References
- J. A. Brydson, Polyamides and Polyimides, in Plast. Mater., Elsevier, 1999, pp. 478–530, DOI:10.1016/b978-075064132-6/50059-0.
- S. M. Bakanay, E. Dainer, B. Clair, A. Adekile, L. Daitch, L. Wells, L. Holley, D. Smith and A. Kutlar, Mortality in sickle cell patients on hydroxyurea therapy, Blood, 2005, 105, 545–547, DOI:10.1182/blood-2004-01-0322.
- R. S. Jankovsky, HAN-based monopropellant assessment for spacecraft, 32nd Joint Propulsion Conference and Exhibit, 1996, DOI:10.2514/6.1996-2863.
- G. Scott Barney, A kinetic study of the reaction of plutonium(IV) with hydroxylamine, J. Inorg. Nucl. Chem., 1976, 38, 1677–1681, DOI:10.1016/0022-1902(76)80660-4.
- F. Raschig, Process for the manufacture of alkali earth salts of hydroxylamin disulfonic acid, US Pat., US1010177A, 1911 Search PubMed.
- M. L. Heilig, ACM SIGGRAPH Comput. Graph., United States Patent Office, 1994, 28, pp. 131–134, DOI:10.1145/178951.178972.
- I. Paseka, Hydrogenation of nitric oxide on platinum black in acidic solution, React. Kinet. Catal. Lett., 1979, 11, 85–89, DOI:10.1007/BF02098339.
- A. H. De Rooij, Process for preparing a solution containing hydroxylammonium salt, US Pat., US3514254A, 1970 Search PubMed.
- A. Thangaraj, S. Sivasanker and P. Ratnasamy, Catalytic properties of crystalline titanium silicalites III. Ammoximation of cyclohexanone, J. Catal., 1991, 131, 394–400, DOI:10.1016/0021-9517(91)90274-8.
- W. P. Jencks, Studies on the Mechanism of Oxime and Semicarbazone Formation, J. Am. Chem. Soc., 1959, 81, 475–481, DOI:10.1021/ja01511a053.
- N. Sharon and A. Katchalsky, Equilibrium Constants in Interaction of Carbonyl Compounds with Hydroxylamine, Anal. Chem., 1952, 24, 1509–1510, DOI:10.1021/ac60069a044.
- W. L. Semon, The preparation of hydroxylamine hydrochloride and acetoxime, J. Am. Chem. Soc., 1923, 45, 188–190, DOI:10.1021/ja01654a028.
- F. Zhao, K. You, C. Peng, S. Tan, R. Li, P. Liu, J. Wu and H. Luo, A simple and efficient approach for preparation of hydroxylamine sulfate from the acid-catalyzed hydrolysis reaction of cyclohexanone oxime, Chem. Eng. J., 2015, 272, 102–107, DOI:10.1016/j.cej.2015.02.098.
- W. Zhang, X. Su, Z. Hao, S. Qin, W. Qing and C. Xia, Pervaporation membrane reactor for producing hydroxylamine chloride via an oxime hydrolysis reaction, Ind. Eng. Chem. Res., 2015, 54, 100–107, DOI:10.1021/ie502811e.
- M. Sadrzadeh and T. Mohammadi, Sea water desalination using electrodialysis, Desalination, 2008, 221, 440–447, DOI:10.1016/j.desal.2007.01.103.
- Y. Tanaka, Ion-Exchange Membrane Electrodialysis for Saline Water Desalination and Its Application to Seawater Concentration, Ind. Eng. Chem. Res., 2011, 50, 7494–7503, DOI:10.1021/ie102386d.
- Z. Wang, Y. Luo and P. Yu, Recovery of organic acids from waste salt solutions derived from the manufacture of cyclohexanone by electrodialysis, J. Membr. Sci., 2006, 280, 134–137, DOI:10.1016/j.memsci.2006.01.015.
- V. Magne, M. Amounas, C. Innocent, E. Dejean and P. Seta, Enzyme textile for removal of urea with coupling process: enzymatic reaction and electrodialysis, Desalination, 2002, 144, 163–166, DOI:10.1016/S0011-9164(02)00306-5.
- C. Li, D. L. Ramasamy, M. Sillanpää and E. Repo, Separation and concentration of rare earth elements from wastewater using electrodialysis technology, Sep. Purif. Technol., 2021, 254, 117442, DOI:10.1016/j.seppur.2020.117442.
- A. Merkel, A. M. Ashrafi and J. Ečer, Bipolar membrane electrodialysis assisted pH correction of milk whey, J. Membr. Sci., 2018, 555, 185–196, DOI:10.1016/j.memsci.2018.03.035.
- S. S. Yi, Y. C. Lu and G. S. Luo, An in situ coupling separation process of electro-electrodialysis with back-extraction, J. Membr. Sci., 2005, 255, 57–65, DOI:10.1016/j.memsci.2005.01.020.
- C. José, L. E. Briand, N. Michlig, M. R. Repetti, C. Benedetich, L. M. Cornaglia and M. L. Bosko, Isolation of ibuprofen enantiomers and racemic esters through electrodialysis, J. Membr. Sci., 2021, 618, 118714, DOI:10.1016/j.memsci.2020.118714.
- J. Y. Chen, C. T. Zhong, Q. W. Gui, Y. M. Zhou, Y. Y. Fang, K. J. Liu, Y. W. Lin, Z. Cao and W. M. He, Practical and sustainable approach for clean preparation of 5-organylselanyl uracils, Chin. Chem. Lett., 2021, 32, 475–479, DOI:10.1016/j.cclet.2020.09.034.
- Y. Wu, J. Y. Chen, H. R. Liao, X. R. Shu, L. L. Duan, X. F. Yang and W. M. He, Electrochemical transient iodination and coupling for selenylated 4-anilinocoumarin synthesis, Green Synth. Catal., 2021 DOI:10.1016/j.gresc.2021.03.006.
- Z. Cao, Q. Zhu, Y. W. Lin and W. M. He, The concept of dual roles design in clean organic preparation, Chin. Chem. Lett., 2019, 30, 2132–2138, DOI:10.1016/j.cclet.2019.09.041.
- Y. Wu, J. Y. Chen, J. Ning, X. Jiang, J. Deng, Y. Deng, R. Xu and W. M. He, Electrochemical multicomponent synthesis of 4-selanylpyrazoles under catalyst- and chemical-oxidant-free conditions, Green Chem. 10.1039/D1GC00562F.
- Y. Mizutani and M. Nishimura, Studies on ion-exchange membranes. XXXII. Heterogeneity in ion-exchange membranes, J. Appl. Polym. Sci., 1970, 14, 1847–1856, DOI:10.1002/app.1970.070140718.
- W. Li, J. Wang, Y. Nie, D. Wang, H. Xu and S. Zhang, Separation of soluble saccharides from the aqueous solution containing ionic liquids by electrodialysis, Sep. Purif. Technol., 2020, 251, 117402, DOI:10.1016/j.seppur.2020.117402.
- Z. Miao, F. Pei, Z. Liu, Z. Zhang, R. Yu and R. Liu, Preparation of highly purity Tetrabutyl Ammonium Hydroxide using a novel method of Electro-Electrodialysis: The study on mass transfer process and influencing factors, J. Membr. Sci., 2018, 567, 281–289, DOI:10.1016/j.memsci.2018.09.045.
- F. G. Donnan, The Theory of Membrane Equilibria, Chem. Rev., 1924, 1, 73–90, DOI:10.1021/cr60001a003.
- K. Jones, HYDROXYLAMINE in Chem. Nitrogen, Elsevier, 1973, pp. 265–276, DOI:10.1016/b978-0-08-018796-9.50011-7.
- P. Lumme, P. Lahermo and J. Tummavuori, Thermodynamics of the Ionization of Hydroxylamine and Nitrous Acid in Water, Acta Chem. Scand., 1965, 19, 2175–2188, DOI:10.3891/acta.chem.scand.19-2175.
- C. Wei, S. R. Saraf, W. J. Rogers and M. Sam Mannan, Thermal runaway reaction hazards and mechanisms of hydroxylamine with acid/base contaminants, Thermochim. Acta, 2004, 421, 1–9, DOI:10.1016/j.tca.2004.02.012.
- M. Rekha, A. Prakash and R. N. Mehrotra, Kinetics and mechanism of oxidation of hydroxylamine by hexachloroiridate(IV) ion in buffer solutions, Can. J. Chem., 1993, 71, 2164–2170, DOI:10.1139/v93-270.
- GB/T 6685–2007, Chemical reagents hydroxylammonium chloride, National Standards of the People's Republic of China Search PubMed.
- Y. Tanaka, Ion Exchange Membranes Fundamentals and Applications, 2nd edn, 2015, DOI:10.1016/C2013-0-12870-X, https://www.sciencedirect.com/book/9780444633194/ion-exchange-membranes.
- Ø. Ulleberg, Modeling of advanced alkaline electrolyzers: a system simulation approach, Int. J. Hydrogen Energy, 2003, 28, 21–33, DOI:10.1016/S0360-3199(02)00033-2.
- W. Blum and G. W. Vinal, The Definition of Polarization, Overvoltage and Decomposition Potential, J. Electrochem. Soc., 1934, 66, 359–367, DOI:10.1149/1.3498105.
- S. Li, Introduction to Electrochemical Reaction Engineering, in Chem. React. Eng., Elsevier, 2017, pp. 599–651, DOI:10.1016/b978-0-12-410416-7.00013-6.
- H. N. McMurray, Hydrogen evolution and oxygen reduction at a titanium sonotrode, Chem. Commun., 1998, 887–888, 10.1039/A800801I.
- Y. M. Kolotyrkin and P. S. Petrov, The electrochemical behavior of Ti in aqueous solution of electrolytes, Zh. Fiz. Khim., 1957, 31, 659–672 CAS.
- M. E. G. Lyons and S. Floquet, Mechanism of oxygen reactions at porous oxide electrodes. Part 2—oxygen evolution at RuO2, IrO2 and IrxRu1−xO2 electrodes in aqueous acid and alkaline solution, Phys. Chem. Chem. Phys., 2011, 13, 5314–5335, 10.1039/C0CP02875D.
- S. Eldera, A. Aziz and A. Moneim, Evaluation of the Activity of Metal-Oxides as Anode Catalysts in Direct Methanol Fuel Cell, 2012, pp. 161–168, DOI:10.1115/FuelCell2012-91288.
- W. Nernst, Zur Kinetik der in Lösung befindlichen Körper, Z. Phys. Chem., 2017 DOI:10.1515/zpch-1888-0274.
- H. E. Darling, Conductivity of Sulfuric Acid Solutions, J. Chem. Eng. Data, 1964, 9, 421–426, DOI:10.1021/je60022a041.
- R. L. David, Handbook of Chemistry and Physics, 19th edn, 2010 Search PubMed.
- S. J. Parulekar, Optimal current and voltage trajectories for minimum energy consumption in batch electrodialysis, J. Membr. Sci., 1998, 148, 91–103, DOI:10.1016/S0376-7388(98)00148-3.
- D. A. Cowan and J. H. Brown, Effect of Turbulence on Limiting Current in Electrodialysis Cells, Ind. Eng. Chem., 1959, 51, 1445–1448, DOI:10.1021/ie50600a026.
- C. B. Aakeröy, A. S. Sinha, K. N. Epa, P. D. Chopade, M. M. Smith and J. Desper, Structural chemistry of oximes, Cryst. Growth Des., 2013, 13, 2687–2695, DOI:10.1021/cg4005246.
- M. Fleury and H. Deschamps, Viscosity and Electrical Conductivity of Aqueous NaCl Solutions with Dissolved CO2, Energy Procedia, 2009, 1, 3129–3133, DOI:10.1016/j.egypro.2009.02.094.
| This journal is © The Royal Society of Chemistry 2021 |


