 Open Access Article
Surface acidity of tin dioxide nanomaterials revealed with 31P solid-state NMR spectroscopy and DFT calculations†
Wenjing Zhang‡
 a,
Zhiye Lin‡a,
Hanxiao Li‡b,
Fang Wanga,
Yujie Wena,
Meng Xua,
Yang Wanga,
Xiaokang Kea,
Xifeng Xiac,
Junchao Chen*a and
Luming Peng
 *a
*a
aKey Laboratory of Mesoscopic Chemistry of MOE, Collaborative Innovation Center of Chemistry for Life Sciences, School of Chemistry and Chemical Engineering, Nanjing University, 163 Xianlin Road, Nanjing 210023, China. E-mail: cjcnuaa@163.com; luming@nju.edu.cn
bChinesisch-Deutsche Technische Fakultät, Qingdao University of Science and Technology, 99 Songling Road, Qingdao 266061, China
cAnalysis and Testing Center, Nanjing University of Science and Technology, Nanjing 210094, China
First published on 19th July 2021
Abstract
Tin dioxide (SnO2) nanomaterials are important acid catalysts. It is therefore crucial to obtain details about the surface acidic properties in order to develop structure–property relationships. Herein, we apply 31P solid-state NMR spectroscopy combined with a trimethylphosphine (TMP) probe molecule, to study the facet-dependent acidity of SnO2 nanosheets and nanoshuttles. With the help of density functional theory calculations, we show that the tin cations exposed on the surfaces are Lewis acid sites and their acid strengths rely on surface geometries. As a result, the (001), (101), (110), and (100) facets can be differentiated by the 31P NMR shifts of adsorbed TMP molecules, and their fractions in different nanomaterials can be extracted according to deconvoluted 31P NMR resonances. The results provide new insights on nanosized oxide acid catalysts.
1. Introduction
With a relatively large band gap of 3.6 eV, tin dioxide (SnO2) is an intrinsic n-type semiconductor.1,2 SnO2 and SnO2 based-materials have been widely used in a variety of fields including gas-sensing,3 photovoltaics,4 energy storage,2,5 and acid catalysis.6,7 In particular, SnO2 nanomaterials, which are associated with a larger surface area and may expose specific facets, exhibit improved catalytic properties compared to their bulk counterparts.8,9 Therefore, it is important to understand the details about the acidic properties of SnO2 nanomaterials in order to develop better SnO2-based catalysts.The most widely applied methods for determining the acidic properties of solids include NH3-temperature programmed desorption (TPD)10 and pyridine-infrared spectroscopy (IR).11 NH3-TPD data gives general information on the relative concentration and strength of different acid sites, however, they cannot differentiate Lewis and Brønsted acid sites.12 Although pyridine-IR can be used to identify the type of acid sites, it is impossible to obtain quantitative results (i.e., the concentrations of Lewis and Brønsted acid sites), owing to the overlapping band if both acid sites are present.13 Therefore, a method that is able to provide both qualitative and quantitative information on Lewis and Brønsted acid sites is preferable. Solid-state nuclear magnetic resonance (NMR) spectroscopy is a powerful method with which to study detailed local structure and properties of solids.14–21 Combined with appropriate probe molecules such as trimethylphosphine (TMP), the smallest alkyl phosphine that can be bound the acid sites of oxide surfaces, solid-state NMR data can provide rich information on the location, type, strength as well as concentration of acid sites.22–24 This approach has been extensively used to study metal oxide based catalysts and porous catalytic materials, such as zeolites and mesoporous materials.25,26
Despite the importance of exposed facets on the catalytic properties,27 only very recently, this method was extended to study the facet-dependent acidity of oxide nanomaterials, including TiO2,28 ZnO,29 and CeO2.13 Based on 31P chemical shift of TMP molecules adsorbed, different surface species at each facet can be identified and their fractions can be extracted according to spectral deconvolution.29,30 Since the facet dependent acidity was not studied for SnO2 nanostructures, in this work, we adopt NMR spectroscopy combined with DFT calculation to study the surface acid sites of two SnO2 nanostructures, i.e., nanosheets and nanoshuttles, and obtain facet-dependent acidity information. 31P NMR spectra show that SnO2 nanosheets possess stronger Lewis acidity than nanoshuttles, which is supported with DFT calculation results on adsorption energies.
2. Experimental section
2.1 Synthesis of SnO2 nanosheets
In a typical synthesis, 225.6 mg SnCl2·2H2O was added into 80 mL ethylenediamine, and the mixture was vigorously stirred for 30 minutes before it was transferred into a 100 mL Teflon-lined autoclave. The autoclave was sealed and heated at 180 °C in an oven for 24 h. After the autoclave was cooled down to room temperature, the yellow precipitate was washed with distilled water and ethanol for five times, and then dried in a vacuum oven at 60 °C overnight to obtain SnO2 nanosheets.312.2 Synthesis of SnO2 nanoshuttles
Typically, 285.2 mg SnCl2·2H2O was added into a mixture of 40 mL ethanol and 40 mL ammonia solution (pH ≈ 11). The solution was stirred vigorously for 1 h before it was transferred into a 100 mL Teflon-lined autoclave. The autoclave was sealed tightly and then heated at 120 °C in an oven for 6 h. SnO2 nanoshuttles were obtained after washing and drying the yellow solids with similar procedures used for SnO2 nanosheets.322.3 Characterization
X-ray diffraction (XRD) was operated on a Philips X'pert Pro diffractometer with Ni filter and Cu Kα irradiation (λ = 0.15418 nm) at 40 mA and 40 kV. The 2θ scanning range was 10–80°. High resolution transmission electron microscopy (HRTEM) images were recorded at 200 kV on a JEOL JEM-2010 instrument. Fourier transform infrared (FT-IR) spectra were obtained with a Thermo Nicolet 8700 FT-IR spectrometer with diamond ATR accessory. X-ray photoelectron spectra (XPS) were collected on an ESCALAB 250 instrument with Al Kα irradiation (hν = 1486.6 eV) as the excitation source. The Brunauer–Emmett–Teller (BET) surface areas of the samples were determined from nitrogen adsorption and desorption data at 77 K using a Micromeritics ASAP 2000 instrument. The contents of Na and N/C were determined with an Optima 5300DV inductively coupled plasma mass spectrometer (ICP-MS) and a Heraeus CHN-0-Rapid elemental analyser, respectively.2.4 TMP adsorption
In a typical process of TMP adsorption, 200 mg sample was placed in a glass tube. The tube was sealed and then connected to a vacuum line. The sample was first activated under 1 × 10⁻³ torr at 100 °C for 3 h before 40 mbar of TMP was introduced. The tube was kept at room temperature for 0.5 h, before it was evacuated for another 0.5 h to remove physisorbed TMP molecules.24 The sample was then transferred into a N2-filled glove box and packed zirconia rotors for NMR tests.2.5 31P solid-state NMR spectroscopy
31P solid state NMR experiments were performed on a Bruker Avance III 400 MHz spectrometer equipped with a 9.4 T superconducting magnet and a double-tuned 4.0 mm magic angle spinning (MAS) probe at room temperature (25 °C). The Larmor frequencies of 1H and 31P nuclei were 400.13 and 161.98 MHz, respectively. A single pulse sequence with 1H decoupling was used for data acquisition with a spinning speed of 14 kHz. A short excitation pulse of 2.6 μs, corresponding to 90 degree flip angle and an optimized recycle delay of 6.0 s were used. 31P chemical shifts were referenced to ammonium dihydrogen phosphate (ADP) at 0.81 ppm.2.6 Computational details
Density functional theory (DFT) calculations were performed with the Vienna ab initio simulation package (VASP).33,34 The Perdew–Burke–Ernzerhof (PBE)35 functional was applied to treat the electron exchange and correlation effects by the generalized gradient approximation (GGA).36 The electron–ion interaction was evaluated by the projector augmented plane wave (PAW) method with a frozen-core approximation.37 The Brillouin zone integration was approximated by a sum over special k-points using the Monkhorst–Pack grids.38 The Gaussian smearing method with a value of 0.1 eV and a cutoff energy of 450 eV was used for all calculations. The Kohn–Sham equations were solved self-consistently. The energy tolerance was set to 1.0 × 10⁻⁴ eV and the maximum Hellmann Feynman force tolerance was set to 0.05 eV Å−1 for structural optimization.In calculating molecule adsorption, we established the 6 layers-(001), 4 layers-(101), 4 layers-(110) and 7 layers-(100) surface of SnO2 (Fig. S1†). Except (110) surface (p (2 × 1) super cells), p (2 × 2) super cells were applied for the other surfaces. For sampling the Brillouin zone, 3 × 3 × 1, 3 × 4 × 1, 2 × 3 × 1 and 4 × 4 × 1 Monkhorst–Pack k-point grid were used for the (001), (100), (101) and (110) surfaces, respectively. To avoid interactions between slabs, all of the above slab models are established with the vacuum space of 12 Å.
The adsorption energies of the TMP molecules were calculated as follows:
| Eads = ETMP/SnO2 − (ETMP + ESnO2), |
3. Results and discussion
3.1 Basic characterization
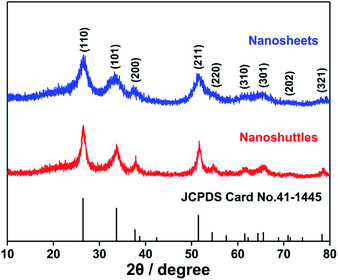
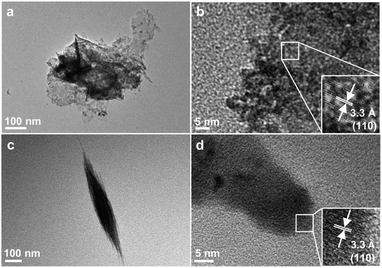
The X-ray diffraction (XRD) patterns of both materials prepared hydrothermally (Fig. 1) can be indexed to rutile phase SnO2 with a tetragonal structure (JCPDS no. 41-1445). The broad widths diffraction peaks indicate their grain sizes are in nanoscale.TEM images in Fig. 2a and c show that the two SnO2 samples are nano-sized sheets and shuttles, respectively. The SnO2 nanosheets are either stretched or aggregated (Fig. 2a), and an inter-planar spacing of 0.33 nm is readily observed in the HRTEM image (Fig. 2b), corresponding to the (110) surface of rutile SnO2, which is the most stable low-index surface.32 The shuttle-like SnO2 (Fig. 2c) is about 700 nm long with a maximum diameter of approx. 100 nm and the lattice spacing of (110) surface can be found at the end of the shuttle. It is also expected that other common facets, such as (001), (101) and (100), may also be present on the two SnO2 nanostructures.39,40
The FT-IR transmission spectra of both SnO2 nanosheets and nanoshuttles in Fig. 3a show six bands stemming from the vibrations and overtones of Sn–O, Sn–O–Sn and surface hydroxyl groups, respectively.41 The most intense peak centered at around 590 cm−1 is owing to the stretching vibration of Sn–O–Sn. Similarly, another stretching vibration peak at approx. 3380 cm−1 corresponds to surface hydroxyl groups. The intensity of this band, however, is significantly weaker than SnO2 nanoparticles previously reported,42 suggesting that the concentration of surface Sn–OH is very low. Quantitative 1H NMR data (Fig. S2 and Table S2†) confirmed that the coverages of proton on SnO2 nanosheets and nanoshuttles were 1.84 and 1.44%. The influence of hydrogen species is therefore neglected. The peaks at ∼970 and 2420 cm−1 are assigned to the overtones of the SnO2 lattice and Sn–OH configuration, respectively. Other bands appear at 1240 and 1640 cm−1 respectively belong to the bending vibrations of Sn–OH and molecular water. In addition to these FT-IR peaks relevant to SnO2, no other signals are observed. X-ray photoelectron spectra (XPS) were also recorded to study the surface states of SnO2 nanosheets and nanoshuttles. As shown in Fig. 3b, the detected elements in XPS survey spectrum only included Sn (Sn 3p, Sn 3d, and Sn 4d), O (O KLL and O 1s) and C (C 1s).43 In Fig. 3c, two splitting peaks attributed to Sn 3d3/2 (494.96 eV) and Sn 3d5/2 (486.48 eV) exhibit a difference of 8.48 eV, consisting with the spin–orbit coupling value of Sn4+.44 Their symmetric peaks indicate that there is few surface Sn2+, or surface oxygen vacancy.45 In addition, the tiny C 1s signals are related to carbon contamination according to previous publications. Elemental analysis in Table S1† also confirms that the amounts of the possible impurities in SnO2 nanosheets and nanoshuttles are small and therefore, their influences can be neglected. The Brunauer–Emmett–Teller (BET) surface areas were measured as 74.1 and 117.0 m2 g−1, respectively, for nanosheets and nanoshuttles (Fig. 3d). The H3-type hysteretic loop in the curve of SnO2 nanosheets verifies the existence of flake particles which formed slit pores with a wide range of pore-size distribution (Fig. S3†) from 8 to 20 nm. The BET curve of SnO2 nanoshuttles displays a H2-type hysteretic loop and its pore-size distribution (Fig. S3†) ranges from 5 to 25 nm.
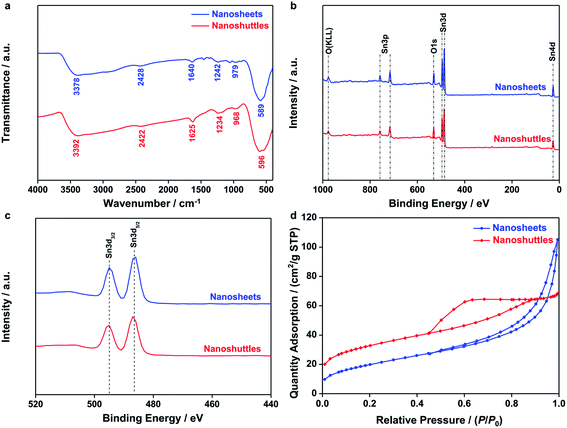 | ||
| Fig. 3 (a) FT-IR spectra, (b and c) XPS spectra and (d) N2 adsorption/desorption isotherms of SnO2 nanosheets and nanoshuttles. | ||
3.2 31P NMR spectroscopy and DFT calculations
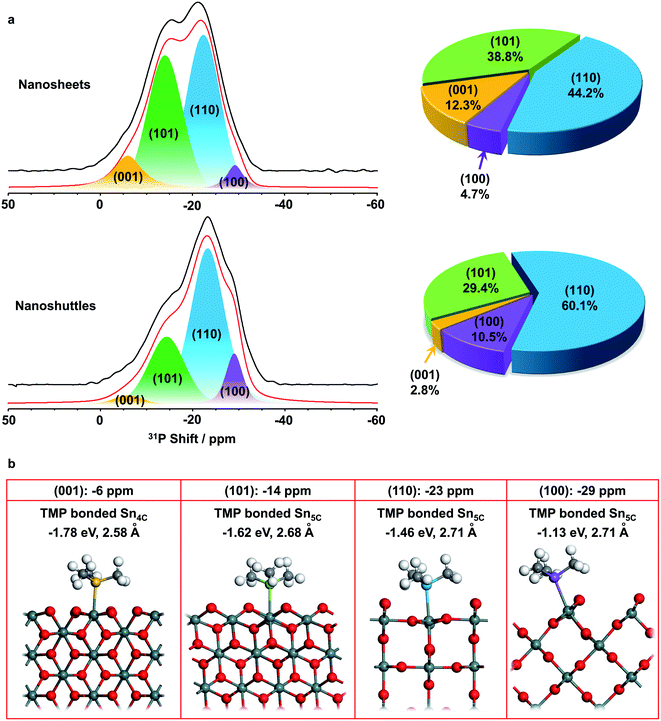
The SnO2 nanosheets and nanoshuttles were then adsorbed with TMP molecules and investigated with 31P solid state NMR spectroscopy (Fig. 4a). In general, physisorbed TMP molecules lead to a sharp signal at around −60 ppm, while TMP molecules adsorbed at Brønsted and Lewis acid sites generate distinct 31P peaks at −5 to −2 and −10 to −55 ppm, respectively.25 No NMR resonance is observed at −60 ppm for both samples, indicating there is no physisorbed TMP molecule on the surface. The signals are quite broad in both spectra, with the majority of the intensity coming from around −6 to −34 ppm, implying Lewis acid sites dominate the surface of both SnO2 nanosheets and nanoshuttles, which should arise from exposed surface Sn cations.46 The centers of gravity of the spectra of nanosheets and nanoshuttles are at approx. −18.1 and −21.6 ppm, respectively. Since the higher the shift, the stronger the Lewis acidity, the above observation suggests that the Lewis acidity is stronger in SnO2 nanosheets than nanoshuttles.Spectral deconvolution was performed to further explore more structure and properties of the two nanomaterials. In both data, two major peaks are observed at around −14 and −23 ppm, while there are additional weak peaks at approx. −6 and −29 ppm (Fig. 4a and Table S2†), indicating four different acid sites can be distinguished. The resonances at lower frequencies (−14, −23 and −29 ppm) can be readily assigned to three different Lewis acid sites, while the peak at −6 ppm is between the frequency range of common Lewis and Brønsted acid sites. Previous pyridine-IR studies show that only Lewis acid sites are present on the surface of SnO2, thus this weak peak is assigned to another Lewis acid site.11
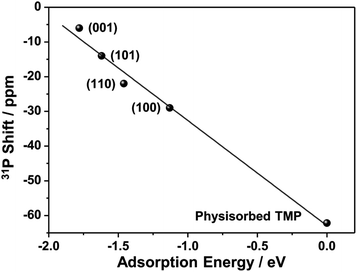
31P NMR studies on other metal oxide nanostructures clearly show that 31P chemical shift is dependent on the facet TMP adsorbed.28–30 Therefore, the four peaks may correspond to TMP bound to Lewis acid sites, which are expected to be Sn cations, at different facets of SnO2 nanostructures. (001), (101), (100), and (110) surfaces are the commonly observed low-index facets for SnO2![[thin space (1/6-em)]](https://www.rsc.org/images/entities/char_2009.gif) 39,40 and the DFT calculations on the TMP adsorption energy were performed (Fig. 4b). Fig. S4† provides the charge density difference of acid sites. The calculation results confirm that TMP molecules are adsorbed on the surface Sn cations in all of the four facets. TMP adsorbed on the 4-coordinated Sn4+ (Sn4C) on (001) surface is associated with the largest adsorption energy of −1.78 eV, followed by TMP adsorbed on Sn5C on (101), (110), and (100) surfaces with energies of −1.62, −1.46, and −1.13 eV, respectively. The internuclear distance between P and Sn also increases with the same order (Fig. 4b). Since a stronger adsorption for TMP gives rise to a more positive 31P chemical shift,16 it is reasonable to attribute the resonances at around −6, −14, −23 and −29 ppm to TMP adsorbed on the tin cations on (001), (101), (110), and (100) surfaces, respectively. It has also been shown that 31P chemical shift exhibits a linear correlation with the adsorption energies.29,47–49 Using physisorbed TMP molecules on other oxides (31P chemical shift is −62.2 ppm and adsorption energy is 0)50 as a reference, the experimentally observed 31P chemical shifts are plotted against the calculated adsorption energies (Fig. 5). Clearly, there is a strong linear correlation, which can be described by the equation: y = −62.9 − 30.3x, where x and y are adsorption energy (eV) and 31P chemical shift (ppm), respectively. Therefore, this result further supports our spectral assignments.
39,40 and the DFT calculations on the TMP adsorption energy were performed (Fig. 4b). Fig. S4† provides the charge density difference of acid sites. The calculation results confirm that TMP molecules are adsorbed on the surface Sn cations in all of the four facets. TMP adsorbed on the 4-coordinated Sn4+ (Sn4C) on (001) surface is associated with the largest adsorption energy of −1.78 eV, followed by TMP adsorbed on Sn5C on (101), (110), and (100) surfaces with energies of −1.62, −1.46, and −1.13 eV, respectively. The internuclear distance between P and Sn also increases with the same order (Fig. 4b). Since a stronger adsorption for TMP gives rise to a more positive 31P chemical shift,16 it is reasonable to attribute the resonances at around −6, −14, −23 and −29 ppm to TMP adsorbed on the tin cations on (001), (101), (110), and (100) surfaces, respectively. It has also been shown that 31P chemical shift exhibits a linear correlation with the adsorption energies.29,47–49 Using physisorbed TMP molecules on other oxides (31P chemical shift is −62.2 ppm and adsorption energy is 0)50 as a reference, the experimentally observed 31P chemical shifts are plotted against the calculated adsorption energies (Fig. 5). Clearly, there is a strong linear correlation, which can be described by the equation: y = −62.9 − 30.3x, where x and y are adsorption energy (eV) and 31P chemical shift (ppm), respectively. Therefore, this result further supports our spectral assignments.
In both samples, the (110) facet has the largest fraction, which is in agreement with the understanding that (110) is often the most stable surface in rutile structure.39 In contrast, the fraction of (001) facet in SnO2 nanosheets is much higher than nanoshuttles, which can be related to the sample preparation procedure. Ethylenediamine, which was used in preparing SnO2 nanosheets, prefers to adsorb on SnO2 (001) surfaces,31 prompting the formation of more high energy (001) surfaces in SnO2 nanosheets. The total fraction of (001) and (101) facets, which have stronger Lewis acidity, is higher than 50% for SnO2 nanosheets, while this value is only around 30% for SnO2 nanoshuttles. Such difference is expected to make a difference in acid catalysis.
4. Conclusion
Facet dependent acidity of SnO2 nanosheets and nanoshuttles were investigated with TMP probe molecule assisted 31P solid-state NMR spectroscopy combined with DFT calculations for the first time. Strong Lewis acid sites dominate the surface of SnO2 and four different sites arising from different facets can be distinguished. The fractions of (001) and (101) facets, associated with stronger Lewis acidity, are larger in SnO2 nanosheets than SnO2 nanoshuttles, which can be ascribed to the different conditions in sample preparation. These results should shed light on the rational design of better nanosized oxide acid catalysts.Author contributions
W. Zhang, Z. Lin, J. Chen and L. Peng, contributed the design of the experiment, analysis of data and writing of the paper. Z. Lin, and H. Li carried out synthesis and characterization of the samples. W. Zhang, Y. Wen, M. Xu, Y. Wang, X. Ke and X. Xia performed the solid state NMR experiments. F. Wang carried out the DFT calculation. All the authors have given their approval to the final version of the manuscript.Conflicts of interest
Authors declare no competing interests.Acknowledgements
This work was supported by the National Natural Science Foundation of China (NSFC) (21972066, 91745202, and 21573103), NSFC – Royal Society Joint Program (21661130149), the Fundamental Research Funds for the Central Universities (1124020512) and National Science Fund for Talent Training in Basic Science (J1103310). The authors thanks Botao Teng for the help with DFT calculations. L. P. thanks the Royal Society and Newton Fund for a Royal Society – Newton Advanced Fellowship.Notes and references
- C. Wang, G. Du, K. Ståhl, H. Huang, Y. Zhong and J. Z. Jiang, J. Phys. Chem. C, 2012, 116, 4000–4011 CrossRef CAS.
- S. Ding, D. Luan, F. Y. C. Boey, J. S. Chen and X. W. Lou, Chem. Commun., 2011, 47, 7155–7157 RSC.
- S. Das and V. Jayaraman, Prog. Mater. Sci., 2014, 66, 112–255 CrossRef CAS.
- S. Gubbala, V. Chakrapani, V. Kumar and M. K. Sunkara, Adv. Funct. Mater., 2008, 18, 2411–2418 CrossRef CAS.
- M. V. Reddy, T. T. Linh, D. T. Hien and B. V. R. Chowdari, ACS Sustainable Chem. Eng., 2016, 4, 6268–6276 CrossRef CAS.
- A. Liu, M. Zhu and B. Dai, Appl. Catal., A, 2019, 583, 117134 CrossRef CAS.
- F. Rashidashmagh, Y. Doekhi-Bennani, M. Tizghadam-Ghazani, J. P. Hoek, A. Mashayekh-Salehi, B. S. G. J. Heijman and K. Yaghmaeian, J. Hazard. Mater., 2021, 404, 124154 CrossRef CAS.
- P. Manjula, R. Boppella and S. V. Manorama, ACS Appl. Mater. Interfaces, 2012, 4, 6252–6260 CrossRef CAS.
- H. Wang and A. L. Rogach, Chem. Mater., 2014, 26, 123–133 CrossRef CAS.
- V. V. Kovalenko, A. A. Zhukova, M. N. Rumyantseva, A. M. Gaskov, V. V. Yushchenko, I. I. Ivanova and T. Pagnier, Sens. Actuators, B, 2007, 126, 52–55 CrossRef CAS.
- Y. Zeng, Z. Liu and Z. Qin, J. Hazard. Mater., 2009, 162, 682–687 CrossRef CAS PubMed.
- H. Knözinger, H. Krietenbrink and P. Ratnasamy, J. Catal., 1977, 48, 436–439 CrossRef.
- Z. Tan, G. Li, H. Chou, Y. Li, X. Yi, A. H. Mahadi, A. Zheng, S. C. E. Tsang and Y. Peng, ACS Catal., 2020, 10, 4003–4011 CrossRef CAS.
- Y. Wu, X. Chen, D. Huang, L. Zhang, Y. Ren, G. Tang, X. Chen, B. Yue and H. He, Catal. Sci. Technol., 2020, 10, 3985–3993 RSC.
- J. Du and L. Peng, Chin. Chem. Lett., 2018, 29, 747–751 CrossRef CAS.
- X. Yi, Y. Peng, W. Peng, W. Chen, Z. Liu and A. Zheng, Acc. Chem. Res., 2021, 54, 2421–2433 CrossRef CAS PubMed.
- C. P. Grey and N. Dupré, Chem. Rev., 2004, 104, 4493–4512 CrossRef CAS.
- A. Marchetti, J. Chen, Z. Pang, S. Li, D. Ling, F. Deng and X. Kong, Adv. Mater., 2017, 29, 1605895 CrossRef.
- C. Bonhomme, C. Coelho, N. Baccile, C. Gervais, T. Azaïs and F. Babonneau, Acc. Chem. Res., 2007, 40, 738–746 CrossRef CAS.
- S. Li, O. Lafon, W. Wang, Q. Wang, X. Wang, Y. Li, J. Xu and F. Deng, Adv. Mater., 2020, 32, 2002879 CrossRef CAS.
- A. J. Rossini, A. Zagdoun, M. Lelli, A. Lesage, C. Copéret and L. Emsley, Acc. Chem. Res., 2013, 46, 1942–1951 CrossRef CAS PubMed.
- B. Guo, L. He, G. Tang, L. Zhang, L. Ye, B. Yue, S. C. E. Tsang and H. He, Chin. J. Catal., 2020, 41, 1248–1260 CrossRef CAS.
- B. Guo, L. Ye, G. Tang, L. Zhang, B. Yue, S. C. E. Tsang and H. He, Chin. J. Chem., 2017, 35, 1529–1539 CrossRef CAS.
- X. Yi, H. H. Ko, F. Deng, S. Liu and A. Zheng, Nat. Protoc., 2020, 15, 3527–3555 CrossRef CAS.
- A. Zheng, S. B. Liu and F. Deng, Chem. Rev., 2017, 117, 12475–12531 CrossRef CAS PubMed.
- Y. Peng and S. C. E. Tsang, Nano Today, 2018, 18, 15–34 CrossRef CAS.
- X. Xie, Y. Li, Z. Liu, M. Haruta and W. Shen, Nature, 2009, 458, 746–749 CrossRef CAS.
- Y. Hu, B. Guo, Y. Fu, Y. Ren, G. Tang, X. Chen, B. Yue and H. He, Chem. Commun., 2015, 51, 14219–14222 RSC.
- Y. Peng, L. Ye, J. Qu, L. Zhang, Y. Fu, I. F. Teixeira, I. J. McPherson, H. He and S. C. E. Tsang, J. Am. Chem. Soc., 2016, 138, 2225–2234 CrossRef CAS PubMed.
- Y. Wu, D. Huang, Y. Fu, L. Zhang, S. Liu, G. Tang, Y. Ren, L. Ye, X. Chen, B. Yue and H. He, Chem.–Eur. J., 2019, 25, 1–5 CrossRef.
- Y. Sun, F. Lei, S. Gao, B. Pan, J. Zhou and Y. Xie, Angew. Chem., Int. Ed., 2013, 52, 10569–10572 CrossRef CAS PubMed.
- C. Wang, Y. Zhou, M. Ge, X. Xu, Z. Zhang and J. Z. Jiang, J. Am. Chem. Soc., 2010, 132, 46–47 CrossRef CAS.
- G. Kresse and J. Hafner, Phys. Rev. B: Condens. Matter Mater. Phys., 1994, 49, 14251–14269 CrossRef CAS.
- J. Hafner, J. Comput. Chem., 2008, 29, 2044–2078 CrossRef CAS PubMed.
- J. P. Perdew, K. Burke and M. Ernzerhof, Phys. Rev. Lett., 1996, 77, 3865–3868 CrossRef CAS PubMed.
- J. P. Perdew and Y. Wang, Phys. Rev. B: Condens. Matter Mater. Phys., 1992, 45, 13244–13249 CrossRef PubMed.
- P. E. Blöchl, Phys. Rev. B: Condens. Matter Mater. Phys., 1994, 50, 17953–17979 CrossRef PubMed.
- H. J. Monkhorst and J. D. Pack, Phys. Rev. B: Solid State, 1976, 13, 5188–5192 CrossRef.
- J. Oviedo and M. J. Gillan, Surf. Sci., 2000, 463, 93–101 CrossRef CAS.
- G. Zhou, X. Wu, L. Liu, X. Zhu, X. Zhu, Y. Hao and P. K. Chu, Appl. Surf. Sci., 2015, 349, 798–804 CrossRef CAS.
- D. Amalric-Popescu and F. Bozon-Verduraz, Catal. Today, 2001, 70, 139–154 CrossRef CAS.
- F. Gu, S. F. Wang, C. F. Song, M. K. Lü, Y. X. Qi, G. J. Zhou, D. Xu and D. R. Yuan, Chem. Phys. Lett., 2003, 372, 451–454 CrossRef CAS.
- D. Yang, I. Kamienchick, D. Y. Youn, A. Rothschild and I. Kim, Adv. Funct. Mater., 2010, 20, 4258–4264 CrossRef CAS.
- Y. Liu, Y. Liu, Y. Guo, J. Xu, X. Xu, X. Fang, J. Liu, W. Chen, H. Arandiyan and X. Wang, Ind. Eng. Chem. Res., 2018, 57, 14052–14063 CrossRef CAS.
- J. Chen, X. Wu, L. Shen, Y. Li, D. Wu, W. Ding, X. Gong, M. Lin and L. Peng, Chem. Phys. Lett., 2016, 643, 126–130 CrossRef CAS.
- J. Wei, J. Ma, Y. Zhu, X. Cai and Y. Xie, Chin. J. Chem., 2001, 19, 1063–1069 CrossRef CAS.
- Y. Chu, Z. Yu, A. Zheng, H. Fang, H. Zhang, S. Huang, S. Liu and F. Deng, J. Phys. Chem. C, 2011, 115, 7660–7667 CrossRef CAS.
- Y. Peng, H. Chou and S. C. E. Tsang, Chem. Sci., 2018, 9, 2493–2500 RSC.
- Z. Tan, J. Zhang, Y. Chen, J. Chou and Y. Peng, J. Phys. Chem. Lett., 2020, 11, 5390–5396 CrossRef CAS.
- J. Deleplanque, R. Hubaut, P. Bodart, M. Fournier and A. Rives, Appl. Surf. Sci., 2009, 255, 4897–4901 CrossRef CAS.
Footnotes |
| † Electronic supplementary information (ESI) available. See DOI: 10.1039/d1ra02782d |
| ‡ These authors contributed equally. |
| This journal is © The Royal Society of Chemistry 2021 |

