DOI:
10.1039/D1RA02858H
(Paper)
RSC Adv., 2021,
11, 22439-22449
Enhanced performance of porous forward osmosis (FO) membrane in the treatment of oily wastewater containing HPAM by the incorporation of palygorskite†
Received
13th April 2021
, Accepted 18th June 2021
First published on 24th June 2021
Abstract
Since the emergence of forward osmosis (FO), low energy requirements, low fouling propensity and high-water recovery have made it one of the most promising water purification technologies. However, there have been few reports focusing on the treatment of polymer flooding produced water (PFPW) using FO technology up to now. In the present work, porous FO membranes with/without palygorskite (Pal) nanoparticles were utilized as the separation membrane to evaluate the potential of a porous FO membrane in the treatment of oily wastewater containing HPAM and the effect of Pal nanoparticles on the FO performance was investigated. When the loading concentration of Pal in the membrane was 0.75 wt%, the water flux could reach 37.67 L m−2 h−1 by using 4 g L−1 poly(sodium-p-styrenesulfonate) (PSS) as draw solution under a cross-flow rate of 18.5 cm s−1, which was much higher than that for pure polysulfone (PS) membranes. Besides, the comparison between ultrafiltration (UF) and FO performance in treating HPAM solution indicated that FO possessed better antifouling capacity, since less decline and higher recovery of water flux were observed during the FO process. Furthermore, recycling the draw solution gave an almost unchanged water flux, which suggested the feasibility of draw solute regeneration in the FO process. This work broadens the application field of porous FO technology and may pave a new way in the treatment of PFPW.
1. Introduction
Polymer flooding oil technology has been widely utilized and plays a significant role in global crude oil recovery, especially in China. Nowadays, the most popular oil-displacing polymer is partially hydrolyzed polyacrylamide (HPAM), which is added to the flooding water to increase the water viscosity and reduce water mobility, so as to make the geological media hold oil less preferentially and enhance the oil recovery rate.1,2 However, it is emphasized that with the increase of oil recovery rate, a large amount of polymer flooding water (PFPW) is produced, with complex composition of pollutants such as HPAM, crude oil, suspended solids and so on. Alone in the Daqing oil field of China, more than 75 million tons of PFPW is produced every year and the water content exceeds 90%.3,4 Without proper treatment, discharge of such gigantic volumes of PFPW will not only put great burden on the environment, but also waste vast water resources, especially in water-deficient areas. Therefore, it becomes quite urgent to apply proper treatments to PFPW before recycling as an internal reuse pattern.5
Up to now, gravity separation, demulsification, dissolved air floatation, biological treatment and adsorption have been widely utilized in the treatment of PFPW.6 Nevertheless, corrosion, high operation costs, low efficiency and recontamination make none of these traditional separation techniques meet required standard for discharged to environment or reuse.7 Since the emergence of forward osmosis (FO), osmotic pressure performs as the driven force and the FO membrane works as a barrier that allows water to pass through from the low osmosis pressure side to the high osmosis pressure side freely, but rejects salts or unwanted elements.8 The advantages of low energy requirements, low fouling propensity and high water recovery make it one of the most promising water purification technology in water supply, wastewater treatment and food processing.9 Conventionally, FO membranes consist of three layers, a reverse osmosis (RO)-like or nanofiltration (NF)-like dense layer, a microporous interlayer and a non-woven polyester (PET) supporting layer. In 2015, Tang et al. proposed using an ultrafiltration (UF)-like FO membrane by selecting the optimum draw solutes that can be adequately rejected by the membrane, where water from feed solution (FS) permeates through the porous membrane while contaminants in FS are retained by the membrane.10 This investigation broadens the potential application of FO, including protein concentration, microalgae harvesting, sludge dewatering and oil–water separation, especially puts forward a new method in removing the HPAM macromolecules by the FO technology.
Generally, surface hydrophilicity and roughness are the two major factors in affecting membrane fouling.11 Thus, the core problem in the treatment of PFPW by the FO technology is to prepare the ideal UF-like FO membrane composed of the above properties. In recent years, it has been reported that inorganic nanoparticles could be potentially used as fillers to improve the properties of microporous UF membranes under the proper loading concentration, with respect to water permeability, fouling propensity, mechanical and thermal properties.12 Clay materials, such as attapulgite (APT), halloysite nanotubes (HNTs), palygorskite (Pal) and montmorillonites (MMTs) have been popular now because of their high intercalation chemistry, inherent hydrophilicity and readily available property, which has been widely used in water treatment.13–15 Among them, Pal nanoparticles have been demonstrated to be an ideal nanofiller in improving membrane properties, which was under the 2![[thin space (1/6-em)]](https://www.rsc.org/images/entities/char_2009.gif) :
:![[thin space (1/6-em)]](https://www.rsc.org/images/entities/char_2009.gif) 1 layer composition with 1D rod-like morphology and 0.37 nm × 0.63 nm cross-sectional area.16,17 Owing to the high-water retention capacity, the prepared hybrid UF membranes by mixing Pal/graphene oxide (GO) and poly(1,1-difluoroethylene) (PVDF) exhibited underwater super-oleophobic and low oil-adhesive surface, therefore leading to outstanding separation performance for various oil-in-water emulsion systems.18 Besides, Liang et al. fabricated a superhydrophilic/underwater superoleophobic multifunctional separation membrane by vacuum assisted filtration technology using Pal as raw material. The results showed that the Pal coated membrane exhibited an excellent permeation flux of 477.7 ± 5.0 L m−2 h−1 bar−1 with 99.7% ± 0.3% removal rates for methylene blue.17 Despite the great achievements in improving the UF membrane performance, the influence of Pal nanoparticles on the ultimate performances of UF-like FO membranes in the treatment of PFPW by FO technology has not been studied completely.
1 layer composition with 1D rod-like morphology and 0.37 nm × 0.63 nm cross-sectional area.16,17 Owing to the high-water retention capacity, the prepared hybrid UF membranes by mixing Pal/graphene oxide (GO) and poly(1,1-difluoroethylene) (PVDF) exhibited underwater super-oleophobic and low oil-adhesive surface, therefore leading to outstanding separation performance for various oil-in-water emulsion systems.18 Besides, Liang et al. fabricated a superhydrophilic/underwater superoleophobic multifunctional separation membrane by vacuum assisted filtration technology using Pal as raw material. The results showed that the Pal coated membrane exhibited an excellent permeation flux of 477.7 ± 5.0 L m−2 h−1 bar−1 with 99.7% ± 0.3% removal rates for methylene blue.17 Despite the great achievements in improving the UF membrane performance, the influence of Pal nanoparticles on the ultimate performances of UF-like FO membranes in the treatment of PFPW by FO technology has not been studied completely.
In current study, porous PS UF membranes with/without Pal nanoparticles were used as the separation membrane to evaluate the potential of porous UF-like FO membrane in the treatment of oily wastewater containing HPAM and investigate the effect of Pal nanoparticles on the FO performance. The prepared membranes were characterized by several methods, such as SEM, XRD, contact angle and AFM, to evaluate the effect of Pal nanoparticles on the membrane structure and properties. Then, the influences of operation parameters, including concentration of HPAM, types and concentration of draw solution (DS) and cross-flow rate on the FO performance were investigated. Besides, the performance in treating HPAM solution between UF and FO was compared. Finally, the diluted DS was concentrated by UF process and reused as DS, so as to demonstrate the recycling feasibility during the FO process. The experimental process is shown in Fig. 1.
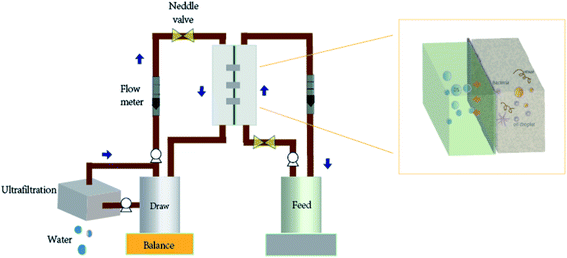 |
| | Fig. 1 Conceptual diagram of porous UF-like FO membrane in FO process. | |
2. Experimental
2.1 Materials
PS-3500P was supplied by Solvay Advanced (USA). Pal was provided from Jiangsu Shengyi Nano Technology Co., Ltd (China). Commercial polyester mesh (90 μm) was purchased from Hebei Crane Achieves Network Industry Co., Ltd (China) and used as a backing layer for the substrate. HPAM (Mw = 2.2 × 10⁷) was provided by Changan Polymer Group Company (Dongying, China). Polyethylene glycol (PEG-70![[thin space (1/6-em)]](https://www.rsc.org/images/entities/char_2009.gif) 000, Mw = 70
000, Mw = 70![[thin space (1/6-em)]](https://www.rsc.org/images/entities/char_2009.gif) 000) and poly(sodium-p-styrenesulfonate) (PSS, Mw = 70
000) and poly(sodium-p-styrenesulfonate) (PSS, Mw = 70![[thin space (1/6-em)]](https://www.rsc.org/images/entities/char_2009.gif) 000) was obtained from Shanghai Macklin Biochemical Co., Ltd (China). Deionized water (DI) was utilized to prepare all solutions and for FO and UF measurements.
000) was obtained from Shanghai Macklin Biochemical Co., Ltd (China). Deionized water (DI) was utilized to prepare all solutions and for FO and UF measurements.
2.2 Preparation of PS and PS-Pal FO membranes
The porous PS FO membranes were synthesized through phase-inversion method.8,19 Briefly, PS, PEG and dimethylacetamide (DMAc) with a mass ratio 18![[thin space (1/6-em)]](https://www.rsc.org/images/entities/char_2009.gif) :
:![[thin space (1/6-em)]](https://www.rsc.org/images/entities/char_2009.gif) 2
2![[thin space (1/6-em)]](https://www.rsc.org/images/entities/char_2009.gif) :
:![[thin space (1/6-em)]](https://www.rsc.org/images/entities/char_2009.gif) 78 were first mixed and stirred by using a magnetic stirrer for 24 h at 70 °C. To remove air bubbles, the obtained dope solution was kept at room temperature for more than 24 h, followed by the spreading over polyester mesh. Finally, the mesh embedded porous FO membrane (120 μm) was prepared by using an in-house casting device and stored in DI water prior use.
78 were first mixed and stirred by using a magnetic stirrer for 24 h at 70 °C. To remove air bubbles, the obtained dope solution was kept at room temperature for more than 24 h, followed by the spreading over polyester mesh. Finally, the mesh embedded porous FO membrane (120 μm) was prepared by using an in-house casting device and stored in DI water prior use.
To prepare PS-Pal FO membranes, 0.25 wt%, 0.5 wt%, 0.75 wt% and 1.0 wt% Pal nanoparticles were first added to the DMAc/PEG mixed solution, followed by a 30 min ultra-sonication to minimize the agglomeration. Soon after, PS beads were dissolved in the mixed solvent system and followed by the same procedure as mentioned above. The substrates with 0.25 wt%, 0.5 wt%, 0.75 wt% and 1.0 wt% Pal nanoparticles were denoted as PS-Pal0.25, PS-Pal0.5, PS-Pal0.75 and PS-Pal1.0, respectively.
2.3 Characterization
By using a scanning electron microscope (SEM, S-4800, Hitachi, Japan), the Pal morphology was detected. The micro-structure of Pal nanoparticles was determined by transmission electron microscope (TEM, JEM-2100, JEOL, Japan). The crystalline structure of Pal was determined by using X-ray diffraction (XRD, RigakuD/Max 2200 PC) with CuKα radiation (λ = 0.15418 nm) at room temperature with the applied tube voltage and electric current at 40 kV and 20 mA. Surface functional groups of Pal nanoparticles were confirmed by flourier transform infrared spectroscopy (FTIR, Nicolet iS50, USA). The particle size and zeta potential of Pal were measured by dynamic light scattering (DLS, Malvern Zetasizer Nano series, UK) and the obtained distribution is volume weighted.
The membrane surface morphology and cross-section were observed by SEM. Membrane surface roughness was measured by in situ atomic force microscopy (AFM, VEECO, USA) under tapping mode. The root mean-squared height (RMS) represents a surface roughness of the membrane. By using an electrokinetic analyzer (Anton Paar SurPASS, Austria, 1 mmol L−1 KCl, pH = 6.5), membrane potential of porous FO membrane was determined. The hydrophilicity of the porous membrane surface was characterized through water contact angle test under the static contact angle measurement by automatic contact angle meter (DSA100, Kruss, Germany). The dispersion of Pal in the membrane was observed with an energy-dispersive X-ray (EDX) under mapping mode and the stability of Pal in the membrane during FO and UF process was determined by XRD.
The membrane porosity (ε) of the prepared membranes was obtained by gravimetric measurement using the following equation:20
| |
 | (1) |
where
m1 (g) and
m2 (g) are the wet and dry weights,
ρw (1.00 g cm
−3) is the density of water, and
ρP (1.24 g cm
−3) is the density of PS.
The average pore radius (rm) of porous FO membrane was defined by the Guerout–Elford–Ferry equation:21,22
| |
 | (2) |
where
η is water viscosity (Pa s),
J is water flux,
h is membrane thickness,
P is operational pressure (0.1 MPa),
ε is membrane porosity and
Sm is effective membrane area.
2.4 UF and FO performance
The permeability and rejection for PEG70![[thin space (1/6-em)]](https://www.rsc.org/images/entities/char_2009.gif) 000 and PSS70
000 and PSS70![[thin space (1/6-em)]](https://www.rsc.org/images/entities/char_2009.gif) 000 of the porous FO membrane were investigated by using a cross-flow filtration setup with an effective membrane area 7.065 cm2. The operating pressure is 1 bar and the feed solution concentration is 2 g L−1. Water flux (J, L m−2 h−1) and rejection (R, %) was calculated using eqn (3) and (4):12
000 of the porous FO membrane were investigated by using a cross-flow filtration setup with an effective membrane area 7.065 cm2. The operating pressure is 1 bar and the feed solution concentration is 2 g L−1. Water flux (J, L m−2 h−1) and rejection (R, %) was calculated using eqn (3) and (4):12| |
 | (3) |
| |
 | (4) |
where ΔVfeed is permeate volume, Δt is time interval, Cp and Cf are solute concentration in the permeate and feed solution, respectively. Through the total organic carbon measurements, the concentration of PEG70![[thin space (1/6-em)]](https://www.rsc.org/images/entities/char_2009.gif) 000 and PSS70
000 and PSS70![[thin space (1/6-em)]](https://www.rsc.org/images/entities/char_2009.gif) 000 solution was measured (multi N/C ®3100 TOC) and the concentration of HPAM was measured by Nephelometry.
000 solution was measured (multi N/C ®3100 TOC) and the concentration of HPAM was measured by Nephelometry.
FO performance, water flux (Jv, L m−2 h−1) was obtained by a home-made cross-flow set-up with an effective membrane area of 24 cm2. The FO membranes were tested in two different operational modes: (1) AL-FS where active layer faces the FS and (2) AL-DS where active layer faces the DS. Since the concentration of HPAM solution after microbial degradation in our lab was 200 mg L−1, thus 200 mg L−1 HPAM solution was used as the FS, while PEG70![[thin space (1/6-em)]](https://www.rsc.org/images/entities/char_2009.gif) 000 and PSS70
000 and PSS70![[thin space (1/6-em)]](https://www.rsc.org/images/entities/char_2009.gif) 000 were used as DS, respectively. Jv was calculated according to the following equation:20
000 were used as DS, respectively. Jv was calculated according to the following equation:20
| |
 | (5) |
where Δ
V is the volume change in feed solution.
2.5 Antifouling capacity
To evaluate the high efficiency of FO process in treating HPAM solution, the comparison between UF and FO separation performance was conducted by using the same PS-Pal0.75 membrane. The UF and FO process continued for 1 h to determine the initial flux by using DI water as FS and 4 g L−1 PSS70![[thin space (1/6-em)]](https://www.rsc.org/images/entities/char_2009.gif) 000 solution was used as DS for FO process. Then, 200 mg L−1 HPAM solution was added in the FS, and the fouling experiment lasted for 12 h. The viscosity of the feed solution after fouling experiment was measured by Brookfield viscometer under the condition of 25 °C and 60 rpm (Fig. S4†). After the fouling filtration, DI water was used to clean the fouled membrane. The fouling–cleaning test repeated two times. Finally, the water flux of the cleaned membrane was re-measured for 3 h to determine the flux recovery rate (FRR), which was calculated by the following equation:23
000 solution was used as DS for FO process. Then, 200 mg L−1 HPAM solution was added in the FS, and the fouling experiment lasted for 12 h. The viscosity of the feed solution after fouling experiment was measured by Brookfield viscometer under the condition of 25 °C and 60 rpm (Fig. S4†). After the fouling filtration, DI water was used to clean the fouled membrane. The fouling–cleaning test repeated two times. Finally, the water flux of the cleaned membrane was re-measured for 3 h to determine the flux recovery rate (FRR), which was calculated by the following equation:23| |
 | (6) |
where J1 is the recovered water flux after cleaning and J0 is the initial flux.
2.6 Recycling of DS during FO process
When FO process finished, the diluted DS was concentrated to the original volume by the cross-flow filtration setup, and reused as the DS to conduct the FO test. The membrane used in the whole process is the prepared porous PS-Pal0.75 FO membrane. The recycling test repeated for four times to demonstrate the recycling and reuse feasibility of DS during the FO process.
3. Result and discussion
3.1 Characterization of Pal nanoparticles
Fig. 2 displayed the physical properties of Pal nanoparticles. As seen from the SEM and TEM images, the Pal nanoparticles exhibited nano-rod structures with diameter about 20–30 nm and 800 nm in length.24 The crystal and chemical structures of Pal were determined by XRD and FTIR. As shown in Fig. 2c, some typical diffraction peaks of Pal were detected at 2θ values 8.46°, 16.41°, 19.90°, 26.69° and 35.19°, which were ascribed to the reflections of the (110), (130), (040), (400) and (161) planes and in accordance with the previous studies.25 From the FTIR spectra, it was seen that the absorption peaks at 3553 cm−1 and 3417 cm−1 appeared, which were contributed to the stretching vibration of the magnesium hydroxyl group (Mg–OH) and silicon hydroxyl group (Si–OH), respectively. The absorption peak at 1654 cm−1 was assigned to the –OH bending vibration of zeolitic water molecules, which exists in the Pal porous channel. Besides, the absorption peaks at 1039 cm−1 and 987 cm−1 were belonging to the symmetrical stretching of Si–O–Si groups and asymmetrical stretching of Si–OH groups, respectively.26 The FTIR spectra suggested that abundant hydroxyl groups exist in Pal nanoparticles, which was believed to improve the membrane hydrophilicity. In addition, the particle size of Pal was about 877 nm with negative zeta potential about −13.2 mV, which was in consistent with the SEM and FRIR results.
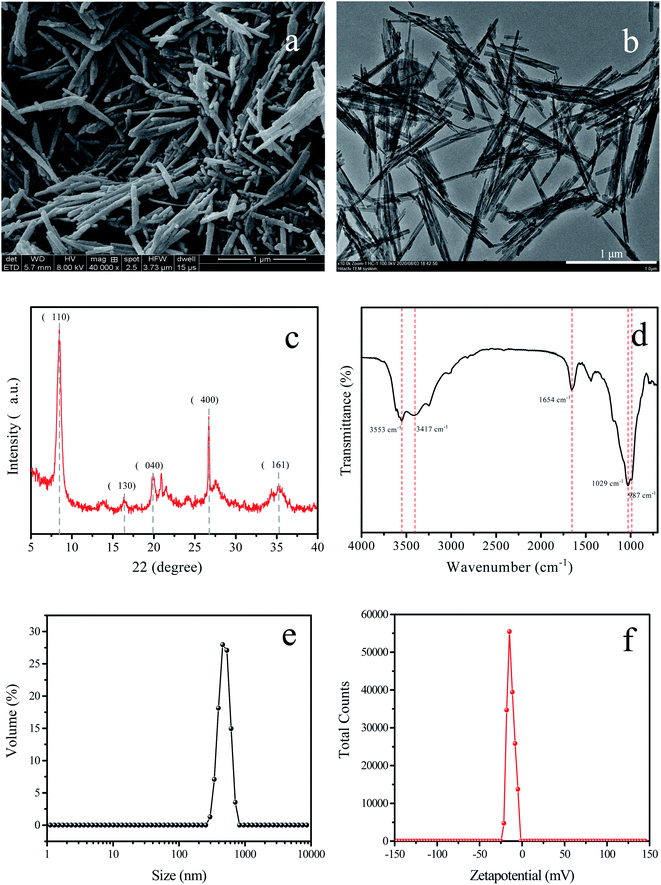 |
| | Fig. 2 SEM (a) and TEM (b) images of Pal nanoparticles; (c) XRD pattern; (d) FTIR spectra; (e) particle size and (f) zeta potential. | |
3.2 Characterization of the prepared membranes
Fig. 3 exhibited the surface morphology, cross-section and surface roughness of the different membranes and the distribution of the represent element Si of the Pal in the membrane characterized by EDX was shown in Fig. 4. From the SEM images, we can see that all the membrane displayed a relative smooth surface with several micro-pores. By blending Pal in the dope solution, the pore size as well as the pore-density and the overall porosity showed an increase with the increment of loading concentration of Pal, and the specific values were summarized in Table 1. The cross-section images showed that all membranes comprised a dense layer and a straight finger-like structure, and the enlarged pore size and pore-density can be obviously observed after the incorporation of Pal.8 As seen from the EDX mapping images, the Si element presented a uniform distribution in the membrane at low loading concentration till 0.75 wt%. When the loading concentration further increased to 1.0 wt%, it appeared slight aggregation of Pal as shown in Fig. 4d, which induced a relative rough membrane surface as depicted in Fig. 3e′′. Furthermore, the XRD spectra of PS and PS-Pal0.75 membranes were shown in Fig. S1a,† and the peak detected at 2θ value 8.46° was ascribed to the typical diffraction peak of Pal, which further demonstrated the successful incorporation in the membrane.
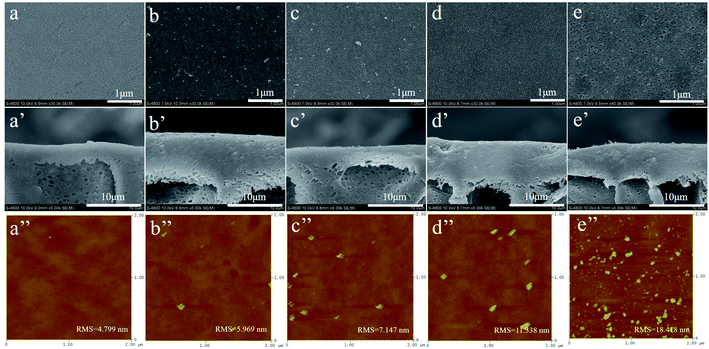 |
| | Fig. 3 Surface morphology, cross-section and surface roughness of PS (a) (a′) (a′′), PS-Pal0.25 (b) (b′) (b′′), PS-Pal0.5 (c) (c′) (c′′), PS-Pal0.75 (d) (d′) (d′′) and PS-Pal1.0 (e) (e′) (e′′) membranes. | |
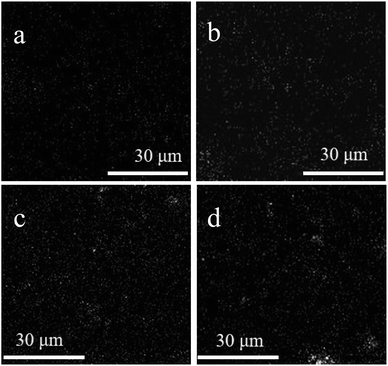 |
| | Fig. 4 EDX mapping image (Si element) of PS-Pal0.25 (a), PS-Pal0.5 (b), PS-Pal0.75 (c) and PS-Pal1.0 (d) membranes. | |
Table 1 Physical properties of PS and PS-Pal membranes
| Membrane |
Porosity (%) |
Pore size (nm) |
Contact angle (°) |
Membrane potential (mV) |
Pure water flux (L m−2 h−1) |
| PS |
69.7 ± 0.3 |
18.2 ± 0.1 |
68.0 ± 1.8 |
−11.17 ± 0.15 |
79.0 ± 1.1 |
| PS-Pal0.25 |
70.2 ± 0.2 |
18.4 ± 0.3 |
67.6 ± 1.2 |
−15.03 ± 0.09 |
81.5 ± 2.3 |
| PS-Pal0.5 |
71.0 ± 0.2 |
21.2 ± 0.2 |
56.4 ± 0.9 |
−19.34 ± 0.12 |
110.8 ± 1.8 |
| PS-Pal0.75 |
73.4 ± 0.4 |
25.3 ± 0.2 |
50.4 ± 1.7 |
−25.17 ± 0.07 |
167.3 ± 3.7 |
| PS-Pal1.0 |
73.9 ± 0.3 |
31.8 ± 0.1 |
46.2 ± 2.1 |
−33.16 ± 0.15 |
267.0 ± 2.1 |
Table 1 summarized the physical properties such as porosity, pore size, contact angle as well as membrane potential and pure water flux of PS and PS-Pal membranes. Compared to pure PS membranes, the porosity and pore size were both increased after incorporation of Pal nanoparticles, which was mainly caused by the strongly facilitate diffusion of water from the water coagulation bath to the cast polymer film by the presence of hydrophilic Pal nanoparticles.12 Besides, the membrane hydrophilicity obtained improvement (the time-dependence contact angle images were shown in Fig. S2†) and higher loading concentration contributed to more hydrophilic membrane surface, which contributed to the increased pure water flux as shown in Table 1. These satisfied changes were believed in enhancing the mass transfer inside the membrane and thus to minimize internal concentration polarization (ICP) and better FO performance.27 Furthermore, the PS membrane displayed a negative surface charge about −11.17 mV due to the presence of sulfonic acid group.20 Since the Pal were charactered as negative nanoparticles, its incorporation in the membrane lead to the more negative membrane surface, from −11.17 mV to −33.16 mV. It is undoubted that the negatively charged surface plays a vital role in increasing the adsorption and accumulating resistance to the negatively charged HPAM molecules, thus improving the antifouling ability of the PS-Pal membranes.28
3.3 Separation performance
3.3.1 UF performance. The selection of a suitable DS is crucial for advancing FO technology. Ideally, DS should be able to generate a high osmotic pressure and produce less reverse flux.9 Unlike the traditional DS used in FO process, such as salt solution, the draw solutes used in current study should be completely rejected by the porous PS and PS-Pal membrane. Thus, two kinds of polymer solutes were applied as DS to study the effect of solution type and concentration on the FO performance. Firstly, the water flux and rejection of the two polymer solutions were evaluated using PS and PS-Pal membranes under UF process, and the results were shown in Table 2. As the results displayed, the rejection of PS and PS-Pal membranes for the two draw solutes were all nearly 100% and no molecules could permeate across the porous FO membrane. However, when the loading concentration of Pal nanoparticles increased to 1.0 wt%, the rejection of the PS-Pal1.0 membrane for the two draw solutes decreased, which was induced by the enlarged pore size. The permeation of draw solutes may result in the loss of effective osmosis pressure during the FO process, which may lead to the bad FO performance.29
Table 2 Water flux and rejection for PEG70![[thin space (1/6-em)]](https://www.rsc.org/images/entities/char_2009.gif) 000 and PSS70
000 and PSS70![[thin space (1/6-em)]](https://www.rsc.org/images/entities/char_2009.gif) 000 of PS and PS-Pal membranesa
000 of PS and PS-Pal membranesa
| Membranes |
PEG70![[thin space (1/6-em)]](https://www.rsc.org/images/entities/char_2009.gif) 000 000 |
PSS70![[thin space (1/6-em)]](https://www.rsc.org/images/entities/char_2009.gif) 000 000 |
| Water flux (L m−2 h−1) |
Rejection (%) |
Water flux (L m−2 h−1) |
Rejection (%) |
| Water flux and rejection were detected in UF testing mode at 1 bar and the concentration of the two feed solutions was 2000 ppm. |
| PS |
52 ± 5 |
100 |
62 ± 8 |
100 |
| PS-Pal0.25 |
73 ± 4 |
100 |
68 ± 7 |
100 |
| PS-Pal0.5 |
90 ± 6 |
100 |
105 ± 8 |
100 |
| PS-Pal0.75 |
132 ± 8 |
100 |
146 ± 8 |
100 |
| PS-Pal1.0 |
215 ± 15 |
97 |
231 ± 8 |
94 |
3.3.2 Effect of DS concentration on the FO performance. The water flux of PS membrane by using 200 mg L−1 HPAM as FS under different concentration of DS and test modes was displayed in Fig. 5. Under AL-FS test mode (Fig. 5a), the FO water flux generally increased with the increment of DS concentration of PEG70![[thin space (1/6-em)]](https://www.rsc.org/images/entities/char_2009.gif) 000 and PSS70
000 and PSS70![[thin space (1/6-em)]](https://www.rsc.org/images/entities/char_2009.gif) 000, which was account for the increased osmotic pressure driving force.30 It is noticed that the enhancement of water flux appeared to be more effective at low concentration range. When the concentration of DS exceeded 4 g L−1 for PSS70
000, which was account for the increased osmotic pressure driving force.30 It is noticed that the enhancement of water flux appeared to be more effective at low concentration range. When the concentration of DS exceeded 4 g L−1 for PSS70![[thin space (1/6-em)]](https://www.rsc.org/images/entities/char_2009.gif) 000 and 3 g L−1 for PEG70
000 and 3 g L−1 for PEG70![[thin space (1/6-em)]](https://www.rsc.org/images/entities/char_2009.gif) 000, the increase in water flux was no more obvious, which was mostly caused by severe ICP though higher osmosis pressure produced at higher concentration of DS. Besides, the viscosity of the DS raised with the increment of DS concentration, and it would increase the exchange resistance of water molecules, which lead to the slight increase of water flux.31 Comparison between the two DS, utilization of PSS70
000, the increase in water flux was no more obvious, which was mostly caused by severe ICP though higher osmosis pressure produced at higher concentration of DS. Besides, the viscosity of the DS raised with the increment of DS concentration, and it would increase the exchange resistance of water molecules, which lead to the slight increase of water flux.31 Comparison between the two DS, utilization of PSS70![[thin space (1/6-em)]](https://www.rsc.org/images/entities/char_2009.gif) 000 gave the higher water flux under the same solution concentration. Since PSS70
000 gave the higher water flux under the same solution concentration. Since PSS70![[thin space (1/6-em)]](https://www.rsc.org/images/entities/char_2009.gif) 000 is a polyelectrolyte, its counter ions will suffer a release when it is dissolved in water. The presence of counter ions of PSS70
000 is a polyelectrolyte, its counter ions will suffer a release when it is dissolved in water. The presence of counter ions of PSS70![[thin space (1/6-em)]](https://www.rsc.org/images/entities/char_2009.gif) 000 will induce the higher osmotic pressure than PEG70
000 will induce the higher osmotic pressure than PEG70![[thin space (1/6-em)]](https://www.rsc.org/images/entities/char_2009.gif) 000, thus leading to the higher water flux.32
000, thus leading to the higher water flux.32
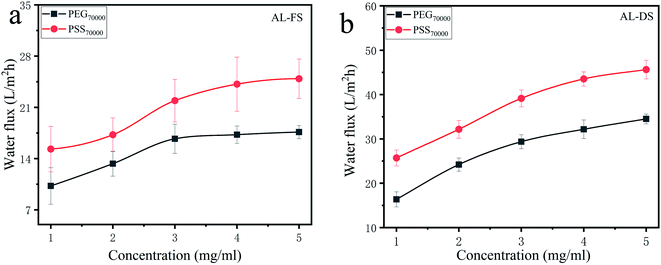 |
| | Fig. 5 Water flux of PS membrane under different concentration of DS. (a) 200 mg L−1 HPAM as feed solution, AL-FS; (b) 200 mg L−1 HPAM as feed solution, AL-DS. | |
Furthermore, similar change trends of the water flux were detected in AL-DS test mode, but nearly two times higher than that under AL-FS test mode as shown in Fig. 5b. In general, dilutive ICP occurred when the active layer faces to the FS and concentrative ICP happened when the active layer faces to the DS. Compared to AL-FS orientation, AL-DS orientation tends to have higher FO water flux induced by the reduced concentrative ICP.30,33 To sum up, PSS70![[thin space (1/6-em)]](https://www.rsc.org/images/entities/char_2009.gif) 000 at the concentration of 4 g L−1 was selected as the ideal DS for subsequent studies.
000 at the concentration of 4 g L−1 was selected as the ideal DS for subsequent studies.
3.3.3 Effect of Pal nanoparticles on the FO performance. Fig. 6 showed the effect of Pal nanoparticles on the water flux of PS-Pal membranes under different operating orientations. As shown in Fig. 6a, we can see that the water flux gradually increased with the increased loading concentration of Pal nanoparticles. It reached 36 L m−2 h−1 at 0.75 wt% loading concentration, which increased by 50% of the water flux compared to the pure PS membrane. The excellent increase was likely caused by the improved membrane hydrophilicity and membrane potential.12,27 Since the PS-Pal0.75 membrane exhibited more hydrophilic surface, water molecules were easier tended to appear to the membrane surface and then permanent across the membrane. Besides, the more negative charged membrane surface contributed to the great electrostatic repulsion to HPAM molecules, and HPAM was difficult to form boundary layer above the membrane surface.34 This change not only decreased the resistance to water molecules pass across the membrane, but also maintained the effective driven force between FS and DS, thus lead to the higher water flux than PS membrane. However, it was noticed that when the loading concentration of Pal increased to 1.0 wt%, the water flux suffered an obvious decline. Based on the UF results, the PS-Pal1.0 membrane exhibited a rejection to PSS70![[thin space (1/6-em)]](https://www.rsc.org/images/entities/char_2009.gif) 000 about 94%, which indicated a penetration of PSS70
000 about 94%, which indicated a penetration of PSS70![[thin space (1/6-em)]](https://www.rsc.org/images/entities/char_2009.gif) 000 molecules across the membrane. As a result, the penetration of PSS70
000 molecules across the membrane. As a result, the penetration of PSS70![[thin space (1/6-em)]](https://www.rsc.org/images/entities/char_2009.gif) 000 would cause the loss of osmosis pressure of the DS and induce the decrease of the driven force across the membrane, thus lead to the decline of water flux during the FO process.8 Similar change trends of PS-Pal membrane were also observed in AL-DS mode as shown in Fig. 6b. To sum up, PS-Pal0.75 performed the best in treating HPAM solution during the FO process and was selected for subsequent studies.
000 would cause the loss of osmosis pressure of the DS and induce the decrease of the driven force across the membrane, thus lead to the decline of water flux during the FO process.8 Similar change trends of PS-Pal membrane were also observed in AL-DS mode as shown in Fig. 6b. To sum up, PS-Pal0.75 performed the best in treating HPAM solution during the FO process and was selected for subsequent studies.
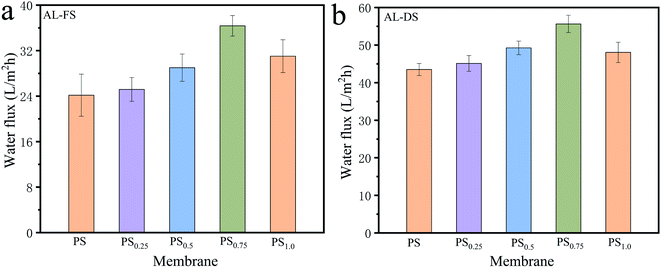 |
| | Fig. 6 Water flux of PS-Pal membranes under AL-FS (a) and AL-DS (b) modes. 200 mg L−1 HPAM as feed solution and 4 g L−1 PSS as draw solution. | |
3.3.4 Effect of FS concentration and cross-flow rate on the FO performance. The influence of FS concentration and cross-flow rate on the FO performance of PS-Pal0.75 membranes was shown in Fig. 7. As obtained from Fig. 7a, the water flux remained at a high level but little difference under low concentration of FS at 100 mg L−1 and 200 mg L−1. With the increment of the FS concentration, the FO water flux gradually decreased. When the concentration was 500 mg L−1, the water flux was as low as 8 L (m−2 h−1). The decreased water flux can be explained by the following reasons. Firstly, since HPAM was a high-molecular polymer, and a little change of the HPAM solution concentration will cause much enhancement of the solution viscosity.35 The elevated solution viscosity resulted in the high mass transfer resistance, and it was difficult for the HPAM molecules diffusing from the membrane surface to the bulk solution. Thus, more sever ICP appeared. Furthermore, the elevated solution velocity raised the potential of adsorption and accumulation of HPAM molecules on the membrane surface. The membrane pores were easy covered and caused the increased resistance of water molecule passing across the membrane, resulting in the low water flux.5,19 Secondly, high concentration of FS means high osmosis pressure, and it will weaken the effective driven force between DS and FS, which also lead to the low water flux. Wang et al. proposed that increasing initial bulk FS concentration could change concentration boundary conditions of diluted DS and induce a reduction in water flux.36
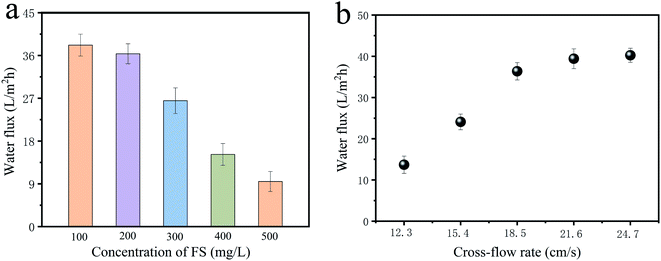 |
| | Fig. 7 Effect of FS concentration (a) and cross-flow rate (b) on the FO performance of PS-Pal0.75 membranes under AL-FS mode. 200 mg L−1 HPAM as feed solution and 4 g L−1 PSS as draw solution. | |
Fig. 7b showed the impact of cross-flow rate on the FO performance. Obviously, with the increase of the cross-flow rate, water flux improved, which was mostly caused by the reduced concentrative external concentration polarization (ECP) on the FS of the membrane, while ICP is hardly affected by cross-flows.37 According to film theory, altering the solution flow rate will effectively improve the thickness of the mass transfer boundary layer. At higher flow rates, the boundary layer is thinner, which may contribute to the higher mass transfer rate and reduced concentrative ECP, thus enhancing the water flux. Besides, the accumulated solutes near the membrane surface could be more efficiently flushed away under high cross-flow rate, and the effective driven force could be maintained.38,39 However, beyond this optimum cross-flow rates, the enhancement gradually became insignificant when exceeding 18.5 cm s−1, which was also observed in previous study.40
3.4 Antifouling capacity
To determine the high efficiency of FO in treating HPAM solution, comparison between UF and FO process using PS-Pal0.75 membrane as the separation membrane was conducted. Each process included two steps, 12 h filtration test and 2 h cleaning by DI water. Both of the two processes repeated for two times and the normalized water flux was shown in Fig. 8a. The water flux of FO process showed slight decrease after 12 h FO fouling test, which was caused by the inevitable ICP. The concentration of FS and the dilution of DS near the membrane surface lead to the loss of the effective osmosis pressure, thus causing the decrease of water flux.8 After the cleaning for 2 h, it was seen that the water flux recovered to 90% of the initial flux value. Since FO is not a pressure-driven process, the formation of HPAM boundary layer is less compact. Such loosely deposited foulants were easily removed by high cross-flow rate.37 Despite the decrease, the water flux recovery still remained 80% of the initial flux value after two fouling–cleaning tests, which was contributed to the improved membrane hydrophilicity and negative charged surface of the PS-Pal0.75 membrane. However, different change trends were obtained during UF process. At the initial of the filtration, water flux suffered a sharp decline and then reached a relative steady state after about 5 h and the final water flux was only 60% of the initial flux. This phenomenon suggested that membrane fouling caused by HPAM was fast but could reach a balance in a certain time. As a kind of hydrophilic linear polymer, HPAM could accumulate on the membrane surface and increase the hydraulic resistance, thus aggravating water flux decline.4 After cleaning, the water flux merely recovered to 80%, which was caused by the inevitable membrane fouling. It was obvious that the second fouling–cleaning test induced more severe decline in water flux, and the final water flux recovery was only 43% as shown in Fig. 8b.
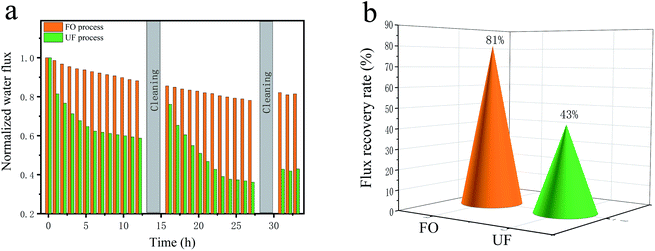 |
| | Fig. 8 Normalized water flux and FRR of UF and FO process in treating HPAM solution. PS-Pal0.75 as the separating membrane, 200 mg L−1 HPAM as feed solution. | |
The membrane surface morphology and roughness before and after cleaning for both FO and UF process can be observed directly from the SEM and AFM images, as illustrated in Fig. 9. Before cleaning, the membrane surface roughness after UF process gave the small roughness value (48.596 nm), as shown in Fig. 9a′. Since UF is a pressure driven process, the HPAM molecule accumulated on the membrane surface would be compacted during the filtration process, therefore displayed a relative smooth surface as observed in Fig. 9a. After cleaning, it was seen that the boundary layer was hardly flushed away under high cross-flow rate and the membrane pores were completely covered as observed in Fig. 9b, and the membrane surface roughness showed less increase (65.637 nm), leading to the great resistance to the water molecules passing across the membrane, resulting in the low recovery of the water flux.41,42 Unlike UF process, the boundary layer formed during the FO process was loosen and was easy flushed away, and the roughness increased from 57.824 nm to 87.625 nm after cleaning (Fig. 9d). Besides, the membrane porosity recovered to a high level compared to UF process (Fig. S3†), thereby enhancing the flux recovery rate. The XRD spectra of the PS-Pal0.75 membrane after the FO and UF process was shown in Fig. S1b,† the typical absorption peak of Pal at 2θ value 8.46° was detected, which demonstrated the stability of Pal in the membrane and was critical to the practical application.
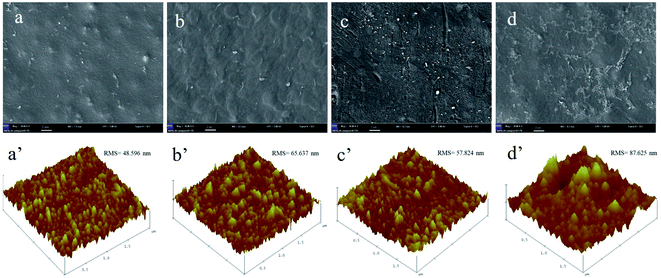 |
| | Fig. 9 Surface morphology and roughness before and after cleaning. (a) (a′) UF process before cleaning, (b) (b′) UF process after cleaning, (c) (c′) FO process before cleaning and (d) (d′) FO process after cleaning. | |
3.5 Recycling of DS
The diluted DS was concentrated by using UF process to its initial volume, and the FO performance was re-conducted to determine the feasibility of DS recycle and reuse during the FO process. The recycle process repeated for four times, and the water flux was shown in Fig. 10. It is undoubted that a bit of PSS molecules would be adsorbed on the membrane surface during the UF process in spite of the 100% rejection of PSS, as a result of the loss of effective osmosis pressure when reused as DS. However, little effect on the FO performance was observed and the FO water flux remained almost unchanged after four times recycle of the DS. This observation implied the feasibility of DS recycle and reuse during the FO process, which was believed to save cost in the practical application.
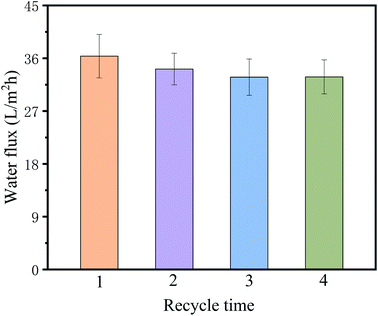 |
| | Fig. 10 Water flux of the PS-Pal0.75 membranes by using the recycled DS solution concentrated by UF process. | |
4. Conclusions
In current study, FO was utilized to treat PFPW, in which porous PS UF membrane with/without Pal nanoparticles were used as the separation membrane. The results showed that incorporation of Pal in the membrane could effectively improve the membrane hydrophilicity and membrane potential as well as enlarge the pore size and porosity, thus leading to higher water flux compared to pure PS membrane. When the loading concentration at 0.75 wt%, the membrane performed best and the water flux as high as 36.37 L m−2 h−1. Besides, utilization of PSS70![[thin space (1/6-em)]](https://www.rsc.org/images/entities/char_2009.gif) 000 at 4 g L−1 as DS could bring higher water flux than PEG70
000 at 4 g L−1 as DS could bring higher water flux than PEG70![[thin space (1/6-em)]](https://www.rsc.org/images/entities/char_2009.gif) 000, for its higher osmosis pressure under the same concentration. Furthermore, the feed solution concentration as well as cross-flow rate also played a significant role in influencing the FO performance. Through the comparison of UF and FO performance, FO possessed better antifouling capacity, and less decline and higher FRR was observed in water flux. Finally, the unchanged water flux by using the recycled DS implied the feasibility of DS recycle and reuse in the FO process, which was of great significance in practical application. In a conclusion, this work demonstrated the potential of porous FO membrane in the treatment of oily wastewater containing HPAM.
000, for its higher osmosis pressure under the same concentration. Furthermore, the feed solution concentration as well as cross-flow rate also played a significant role in influencing the FO performance. Through the comparison of UF and FO performance, FO possessed better antifouling capacity, and less decline and higher FRR was observed in water flux. Finally, the unchanged water flux by using the recycled DS implied the feasibility of DS recycle and reuse in the FO process, which was of great significance in practical application. In a conclusion, this work demonstrated the potential of porous FO membrane in the treatment of oily wastewater containing HPAM.
Author contributions
Formal analysis, Qianwen Zhang; data curation, Qianwen Zhang, Zhili Wang ang Jiayu Liu; funding acquisition, Huanzhen Zhang; investigation, Kefeng Zhang; project administration, Wande Ding; resources, Huanzhen Zhang and Kefeng Zhang; writing – origin draft, Qianwen Zhang; writing – review & editing, Wande Ding.
Conflicts of interest
There are no conflicts to declare.
Acknowledgements
This study was financially supported by the National water pollution control and governance of science and technology major special (2015ZX07203-007).
References
- X. Zhao, L. Liu, Y. Wang, H. Dai, D. Wang and H. Cai, Sep. Purif. Technol., 2008, 62, 199–204 CrossRef CAS.
- M. Duan, Y. Ma, S. Fang, P. Shi, J. Zhang and B. Jing, Sep. Purif. Technol., 2014, 133, 160–167 CrossRef CAS.
- X. Wang, Z. Wang, Y. Zhou, X. Xi, W. Li, L. Yang and X. Wang, Desalination, 2011, 273, 375–385 CrossRef CAS.
- R. Zhang, W. Shi, S. Yu, W. Wang, Z. Zhang, B. Zhang, L. Li and X. Bao, Desalination, 2015, 373, 27–37 CrossRef CAS.
- T. Wang, S. Yu and L. A. Hou, Desalination, 2017, 404, 50–58 CrossRef CAS.
- L. Yu, M. Han and F. He, Arabian J. Chem., 2017, 10, 1913–1922 CrossRef.
- S. Jamaly, A. Giwa and S. W. Hasan, J. Environ. Sci., 2015, 37, 15–30 CrossRef CAS PubMed.
- W. D. Ding, Y. M. Li, M. T. Bao, J. R. Zhang, C. C. Zhang and J. R. Lu, RSC Adv., 2017, 7, 40311–40320 RSC.
- Q. Ge, M. Ling and T. S. Chung, J. Membr. Sci., 2013, 442, 225–237 CrossRef CAS.
- S. Qi, Y. Li, Y. Zhao, W. Li and C. Y. Tang, Environ. Sci. Technol., 2015, 49, 4690–4695 CrossRef CAS PubMed.
- E. W. Tow, D. M. Warsinger, A. M. Trueworthy, J. Swaminathan, G. P. Thiel, S. M. Zubair, A. S. Myerson and J. H. Lienhard V, J. Membr. Sci., 2018, 556, 352–364 CrossRef CAS.
- D. Emadzadeh, W. J. Lau, T. Matsuura, M. Rahbari-Sisakht and A. F. Ismail, Chem. Eng. J., 2014, 237, 70–80 CrossRef CAS.
- G. Cavallaro, G. Lazzara, S. Milioto, F. Parisi and V. Sanzillo, ACS Appl. Mater. Interfaces, 2014, 6, 606–612 CrossRef CAS PubMed.
- G. Cavallaro, G. Lazzara, E. Rozhina, S. Konnova, M. Kryuchkova, N. Khaertdinov and R. Fakhrullin, RSC Adv., 2019, 9, 40553–40564 RSC.
- R. Zhang, Z. Zhou, W. Ge, Y. Wang, X. Yin, L. Zhang, W. Yang and J. Dai, Appl. Clay Sci., 2020, 199, 105872 CrossRef CAS.
- T. Zhang, Z. Li, W. Wang, Y. Wang, B. Gao and Z. Wang, J. Colloid Interface Sci., 2019, 537, 1–10 CrossRef CAS PubMed.
- Y. Yang, W. Liang, C. Wang, H. Sun, J. Zhang, Y. Yu, W. Dong, Z. Zhu and A. Li, Appl. Clay Sci., 2019, 182, 105295 CrossRef CAS.
- X. Zhao, Y. Su, Y. Liu, Y. Li and Z. Jiang, ACS Appl. Mater. Interfaces, 2016, 8, 8247–8256 CrossRef CAS PubMed.
- W. D. Ding, J. Cai, Z. Y. Yu, Q. H. Wang, Z. N. Xu, Z. N. Wang and C. J. Gao, J. Mater. Chem. A, 2015, 3, 20118–20126 RSC.
- X. Song, L. Wang, C. Y. Tang, Z. Wang and C. Gao, Desalination, 2015, 369, 1–9 CrossRef CAS.
- J. Garcia-Ivars, M.-I. Alcaina-Miranda, M.-I. Iborra-Clar, J.-A. Mendoza-Roca and L. Pastor-Alcañiz, Sep. Purif. Technol., 2014, 128, 45–57 CrossRef CAS.
- E. Yuliwati, A. F. Ismail, T. Matsuura, M. A. Kassim and M. S. Abdullah, Desalination, 2011, 283, 214–220 CrossRef CAS.
- W. Wang, Y. Li, W. Wang, B. Gao and Z. Wang, Chemosphere, 2019, 236, 124396 CrossRef CAS PubMed.
- Y. Liu, W. Wang and A. Wang, Powder Technol., 2012, 225, 124–129 CrossRef CAS.
- D. Wei, S. Zhou, M. Li, A. Xue, Y. Zhang, Y. Zhao, J. Zhong and D. Yang, Appl. Clay Sci., 2019, 181, 105171 CrossRef.
- Y. Zhang, J. Zhao, H. Chu, X. Zhou and Y. Wei, Desalination, 2014, 344, 71–78 CrossRef CAS.
- N. Niksefat, M. Jahanshahi and A. Rahimpour, Desalination, 2014, 343, 140–146 CrossRef CAS.
- T. Wang, J. Lu, L. Mao and Z. Wang, J. Membr. Sci., 2016, 515, 125–133 CrossRef CAS.
- T. Ni and Q. Ge, J. Membr. Sci., 2018, 564, 732–741 CrossRef CAS.
- C. Y. Tang, Q. She, W. C. L. Lay, R. Wang and A. G. Fane, J. Membr. Sci., 2010, 354, 123–133 CrossRef CAS.
- X. X. Song, Z. Y. Liu and D. R. D. L. Sun, Adv. Mater., 2011, 23, 3256–3260 CrossRef CAS PubMed.
- S. Qi, Y. Li, R. Wang and C. Y. Tang, J. Membr. Sci., 2016, 498, 67–74 CrossRef CAS.
- Y. Gao, Y.-N. Wang, W. Li and C. Y. Tang, Desalination, 2014, 338, 65–73 CrossRef CAS.
- G. Han, S. Zhang, X. Li, N. Widjojo and T. S. Chung, Chem. Eng. Sci., 2012, 80, 219–231 CrossRef CAS.
- H. Chen, H. Tang, X. Gong, J. Wang, Y. Liu, M. Duan and F. Zhao, J. Pet. Sci. Eng., 2015, 133, 431–439 CrossRef CAS.
- Q. Wang, X. Gao, Y. Zhang, J. Wang, Y. Xu, Z. Ji, X. Wang and C. Gao, Chem. Eng. Res. Des., 2017, 117, 593–603 CrossRef CAS.
- T. Cath, A. Childress and M. Elimelech, J. Membr. Sci., 2006, 281, 70–87 CrossRef CAS.
- X. Song, L. Liu, W. Bing, J. Pan, S. Qi, C. Y. Tang and C. Gao, Bioresour. Technol., 2018, 263, 192–198 CrossRef CAS PubMed.
- S. Phuntsho, S. Sahebi, T. Majeed, F. Lotfi, J. E. Kim and H. K. Shon, Chem. Eng. J., 2013, 231, 484–496 CrossRef CAS.
- Y. Xu, X. Peng, C. Y. Tang, Q. S. Fu and S. Nie, J. Membr. Sci., 2010, 348, 298–309 CrossRef CAS.
- W. Ding, H. Zhuo, M. Bao, Y. Li and J. Lu, Chem. Eng. J., 2017, 330, 337–344 CrossRef CAS.
- S. L. Dashtban Kenari and B. Barbeau, J. Membr. Sci., 2016, 516, 1–12 CrossRef CAS.
Footnote |
| † Electronic supplementary information (ESI) available. See DOI: 10.1039/d1ra02858h |
|
| This journal is © The Royal Society of Chemistry 2021 |
Click here to see how this site uses Cookies. View our privacy policy here.  Open Access Article
 *bc,
Huanzhen Zhang*a,
Kefeng Zhangb,
Zhili Wanga and
Jiayu Liua
![[thin space (1/6-em)]](https://www.rsc.org/images/entities/char_2009.gif) :
:![[thin space (1/6-em)]](https://www.rsc.org/images/entities/char_2009.gif) 1 layer composition with 1D rod-like morphology and 0.37 nm × 0.63 nm cross-sectional area.16,17 Owing to the high-water retention capacity, the prepared hybrid UF membranes by mixing Pal/graphene oxide (GO) and poly(1,1-difluoroethylene) (PVDF) exhibited underwater super-oleophobic and low oil-adhesive surface, therefore leading to outstanding separation performance for various oil-in-water emulsion systems.18 Besides, Liang et al. fabricated a superhydrophilic/underwater superoleophobic multifunctional separation membrane by vacuum assisted filtration technology using Pal as raw material. The results showed that the Pal coated membrane exhibited an excellent permeation flux of 477.7 ± 5.0 L m−2 h−1 bar−1 with 99.7% ± 0.3% removal rates for methylene blue.17 Despite the great achievements in improving the UF membrane performance, the influence of Pal nanoparticles on the ultimate performances of UF-like FO membranes in the treatment of PFPW by FO technology has not been studied completely.
1 layer composition with 1D rod-like morphology and 0.37 nm × 0.63 nm cross-sectional area.16,17 Owing to the high-water retention capacity, the prepared hybrid UF membranes by mixing Pal/graphene oxide (GO) and poly(1,1-difluoroethylene) (PVDF) exhibited underwater super-oleophobic and low oil-adhesive surface, therefore leading to outstanding separation performance for various oil-in-water emulsion systems.18 Besides, Liang et al. fabricated a superhydrophilic/underwater superoleophobic multifunctional separation membrane by vacuum assisted filtration technology using Pal as raw material. The results showed that the Pal coated membrane exhibited an excellent permeation flux of 477.7 ± 5.0 L m−2 h−1 bar−1 with 99.7% ± 0.3% removal rates for methylene blue.17 Despite the great achievements in improving the UF membrane performance, the influence of Pal nanoparticles on the ultimate performances of UF-like FO membranes in the treatment of PFPW by FO technology has not been studied completely.![[thin space (1/6-em)]](https://www.rsc.org/images/entities/char_2009.gif) 000, Mw = 70
000, Mw = 70![[thin space (1/6-em)]](https://www.rsc.org/images/entities/char_2009.gif) 000) and poly(sodium-p-styrenesulfonate) (PSS, Mw = 70
000) and poly(sodium-p-styrenesulfonate) (PSS, Mw = 70![[thin space (1/6-em)]](https://www.rsc.org/images/entities/char_2009.gif) 000) was obtained from Shanghai Macklin Biochemical Co., Ltd (China). Deionized water (DI) was utilized to prepare all solutions and for FO and UF measurements.
000) was obtained from Shanghai Macklin Biochemical Co., Ltd (China). Deionized water (DI) was utilized to prepare all solutions and for FO and UF measurements.
![[thin space (1/6-em)]](https://www.rsc.org/images/entities/char_2009.gif) :
:![[thin space (1/6-em)]](https://www.rsc.org/images/entities/char_2009.gif) 2
2![[thin space (1/6-em)]](https://www.rsc.org/images/entities/char_2009.gif) :
:![[thin space (1/6-em)]](https://www.rsc.org/images/entities/char_2009.gif) 78 were first mixed and stirred by using a magnetic stirrer for 24 h at 70 °C. To remove air bubbles, the obtained dope solution was kept at room temperature for more than 24 h, followed by the spreading over polyester mesh. Finally, the mesh embedded porous FO membrane (120 μm) was prepared by using an in-house casting device and stored in DI water prior use.
78 were first mixed and stirred by using a magnetic stirrer for 24 h at 70 °C. To remove air bubbles, the obtained dope solution was kept at room temperature for more than 24 h, followed by the spreading over polyester mesh. Finally, the mesh embedded porous FO membrane (120 μm) was prepared by using an in-house casting device and stored in DI water prior use.


![[thin space (1/6-em)]](https://www.rsc.org/images/entities/char_2009.gif) 000 and PSS70
000 and PSS70![[thin space (1/6-em)]](https://www.rsc.org/images/entities/char_2009.gif) 000 of the porous FO membrane were investigated by using a cross-flow filtration setup with an effective membrane area 7.065 cm2. The operating pressure is 1 bar and the feed solution concentration is 2 g L−1. Water flux (J, L m−2 h−1) and rejection (R, %) was calculated using eqn (3) and (4):12
000 of the porous FO membrane were investigated by using a cross-flow filtration setup with an effective membrane area 7.065 cm2. The operating pressure is 1 bar and the feed solution concentration is 2 g L−1. Water flux (J, L m−2 h−1) and rejection (R, %) was calculated using eqn (3) and (4):12

![[thin space (1/6-em)]](https://www.rsc.org/images/entities/char_2009.gif) 000 and PSS70
000 and PSS70![[thin space (1/6-em)]](https://www.rsc.org/images/entities/char_2009.gif) 000 solution was measured (multi N/C ®3100 TOC) and the concentration of HPAM was measured by Nephelometry.
000 solution was measured (multi N/C ®3100 TOC) and the concentration of HPAM was measured by Nephelometry.
![[thin space (1/6-em)]](https://www.rsc.org/images/entities/char_2009.gif) 000 and PSS70
000 and PSS70![[thin space (1/6-em)]](https://www.rsc.org/images/entities/char_2009.gif) 000 were used as DS, respectively. Jv was calculated according to the following equation:20
000 were used as DS, respectively. Jv was calculated according to the following equation:20
![[thin space (1/6-em)]](https://www.rsc.org/images/entities/char_2009.gif) 000 solution was used as DS for FO process. Then, 200 mg L−1 HPAM solution was added in the FS, and the fouling experiment lasted for 12 h. The viscosity of the feed solution after fouling experiment was measured by Brookfield viscometer under the condition of 25 °C and 60 rpm (Fig. S4†). After the fouling filtration, DI water was used to clean the fouled membrane. The fouling–cleaning test repeated two times. Finally, the water flux of the cleaned membrane was re-measured for 3 h to determine the flux recovery rate (FRR), which was calculated by the following equation:23
000 solution was used as DS for FO process. Then, 200 mg L−1 HPAM solution was added in the FS, and the fouling experiment lasted for 12 h. The viscosity of the feed solution after fouling experiment was measured by Brookfield viscometer under the condition of 25 °C and 60 rpm (Fig. S4†). After the fouling filtration, DI water was used to clean the fouled membrane. The fouling–cleaning test repeated two times. Finally, the water flux of the cleaned membrane was re-measured for 3 h to determine the flux recovery rate (FRR), which was calculated by the following equation:23


![[thin space (1/6-em)]](https://www.rsc.org/images/entities/char_2009.gif) 000 and PSS70
000 and PSS70![[thin space (1/6-em)]](https://www.rsc.org/images/entities/char_2009.gif) 000 of PS and PS-Pal membranesa
000 of PS and PS-Pal membranesa
![[thin space (1/6-em)]](https://www.rsc.org/images/entities/char_2009.gif) 000
000![[thin space (1/6-em)]](https://www.rsc.org/images/entities/char_2009.gif) 000
000![[thin space (1/6-em)]](https://www.rsc.org/images/entities/char_2009.gif) 000 and PSS70
000 and PSS70![[thin space (1/6-em)]](https://www.rsc.org/images/entities/char_2009.gif) 000, which was account for the increased osmotic pressure driving force.30 It is noticed that the enhancement of water flux appeared to be more effective at low concentration range. When the concentration of DS exceeded 4 g L−1 for PSS70
000, which was account for the increased osmotic pressure driving force.30 It is noticed that the enhancement of water flux appeared to be more effective at low concentration range. When the concentration of DS exceeded 4 g L−1 for PSS70![[thin space (1/6-em)]](https://www.rsc.org/images/entities/char_2009.gif) 000 and 3 g L−1 for PEG70
000 and 3 g L−1 for PEG70![[thin space (1/6-em)]](https://www.rsc.org/images/entities/char_2009.gif) 000, the increase in water flux was no more obvious, which was mostly caused by severe ICP though higher osmosis pressure produced at higher concentration of DS. Besides, the viscosity of the DS raised with the increment of DS concentration, and it would increase the exchange resistance of water molecules, which lead to the slight increase of water flux.31 Comparison between the two DS, utilization of PSS70
000, the increase in water flux was no more obvious, which was mostly caused by severe ICP though higher osmosis pressure produced at higher concentration of DS. Besides, the viscosity of the DS raised with the increment of DS concentration, and it would increase the exchange resistance of water molecules, which lead to the slight increase of water flux.31 Comparison between the two DS, utilization of PSS70![[thin space (1/6-em)]](https://www.rsc.org/images/entities/char_2009.gif) 000 gave the higher water flux under the same solution concentration. Since PSS70
000 gave the higher water flux under the same solution concentration. Since PSS70![[thin space (1/6-em)]](https://www.rsc.org/images/entities/char_2009.gif) 000 is a polyelectrolyte, its counter ions will suffer a release when it is dissolved in water. The presence of counter ions of PSS70
000 is a polyelectrolyte, its counter ions will suffer a release when it is dissolved in water. The presence of counter ions of PSS70![[thin space (1/6-em)]](https://www.rsc.org/images/entities/char_2009.gif) 000 will induce the higher osmotic pressure than PEG70
000 will induce the higher osmotic pressure than PEG70![[thin space (1/6-em)]](https://www.rsc.org/images/entities/char_2009.gif) 000, thus leading to the higher water flux.32
000, thus leading to the higher water flux.32

![[thin space (1/6-em)]](https://www.rsc.org/images/entities/char_2009.gif) 000 at the concentration of 4 g L−1 was selected as the ideal DS for subsequent studies.
000 at the concentration of 4 g L−1 was selected as the ideal DS for subsequent studies.![[thin space (1/6-em)]](https://www.rsc.org/images/entities/char_2009.gif) 000 about 94%, which indicated a penetration of PSS70
000 about 94%, which indicated a penetration of PSS70![[thin space (1/6-em)]](https://www.rsc.org/images/entities/char_2009.gif) 000 molecules across the membrane. As a result, the penetration of PSS70
000 molecules across the membrane. As a result, the penetration of PSS70![[thin space (1/6-em)]](https://www.rsc.org/images/entities/char_2009.gif) 000 would cause the loss of osmosis pressure of the DS and induce the decrease of the driven force across the membrane, thus lead to the decline of water flux during the FO process.8 Similar change trends of PS-Pal membrane were also observed in AL-DS mode as shown in Fig. 6b. To sum up, PS-Pal0.75 performed the best in treating HPAM solution during the FO process and was selected for subsequent studies.
000 would cause the loss of osmosis pressure of the DS and induce the decrease of the driven force across the membrane, thus lead to the decline of water flux during the FO process.8 Similar change trends of PS-Pal membrane were also observed in AL-DS mode as shown in Fig. 6b. To sum up, PS-Pal0.75 performed the best in treating HPAM solution during the FO process and was selected for subsequent studies.


![[thin space (1/6-em)]](https://www.rsc.org/images/entities/char_2009.gif) 000 at 4 g L−1 as DS could bring higher water flux than PEG70
000 at 4 g L−1 as DS could bring higher water flux than PEG70![[thin space (1/6-em)]](https://www.rsc.org/images/entities/char_2009.gif) 000, for its higher osmosis pressure under the same concentration. Furthermore, the feed solution concentration as well as cross-flow rate also played a significant role in influencing the FO performance. Through the comparison of UF and FO performance, FO possessed better antifouling capacity, and less decline and higher FRR was observed in water flux. Finally, the unchanged water flux by using the recycled DS implied the feasibility of DS recycle and reuse in the FO process, which was of great significance in practical application. In a conclusion, this work demonstrated the potential of porous FO membrane in the treatment of oily wastewater containing HPAM.
000, for its higher osmosis pressure under the same concentration. Furthermore, the feed solution concentration as well as cross-flow rate also played a significant role in influencing the FO performance. Through the comparison of UF and FO performance, FO possessed better antifouling capacity, and less decline and higher FRR was observed in water flux. Finally, the unchanged water flux by using the recycled DS implied the feasibility of DS recycle and reuse in the FO process, which was of great significance in practical application. In a conclusion, this work demonstrated the potential of porous FO membrane in the treatment of oily wastewater containing HPAM.


