DOI:
10.1039/D1RA03541J
(Paper)
RSC Adv., 2021,
11, 25575-25585
Experimental comparison between steam and water tilt-angle injection effects on NOx reduction from the gaseous flame
Received
6th May 2021
, Accepted 13th July 2021
First published on 23rd July 2021
Abstract
Nitrogen oxide emissions control is a technology that meets the air pollutant reduction criteria in the energy production field, and it becomes more stringent yearly. Thus, this study experimentally compares the effects of direct-water and -steam injections at different tilting angles on NOx emission reduction. Using the experimental study conducted in the Combustion Laboratory of the Mechanical Power Department at the Faculty of Engineering, Minia University, Egypt, the exhaust gas temperature was found to be the main parameter affecting NOx emission. An experimental test rig was designed and simulated as a gaseous fuel combustion chamber. The results show that water and steam injections can effectively reduce NOx emissions by 70% and 57%, respectively. Besides, direct-water injection is more effective than steam injection owing to the 13% extra reduction in the NOx emission. Moreover, the best inclination angle into the primary combustion zone for both water and steam injection is 45°. The experimental results agree well with the results obtained in previous studies in this field.
1. Introduction
Atmospheric pollution by nitrogen oxides (NOx) has been a subject of growing concern over the past decade. NOx contribute to photochemical smog, causing respiratory and eye damage.1 The research basis is that different international environmental agencies around the world have highlighted that NOx emissions are becoming a major issue. Although the regulated air pollutant emissions have been a bit decreased over the past decade, specifically in Europe, around 22% of the population is still living in places where NOx concentrations exceed the established air quality standard.36 Many NOx control technologies have been applied to stationary combustion equipment, and NOx reduction strategies based on water and steam injection into fuel have been studied at the end of the 20th century. The addition of water and steam to fuel engines such as internal combustion engines and gas turbines was introduced as a method for NOx emission reduction. Water and steam injection directly into the manifold was the original means of introduction into the engine,37,41 then different injection techniques of were used, such as the single-point injection and injection upstream/downstream of the compressor. In August 2015, water and steam injection technology was applied in the combustion chamber and spark-ignition engine by BMW and BOSCH; the system initially offered 5% higher power, with NOx emission reduction by around 13%.38 Recently, the influences of different water and steam injection timings on NOx emissions from the gaseous fuel engines and gas turbines have been studied.39,40 Considering diluted injection, the reduction in NOx emissions levels has been studied and several techniques have been reviewed.2–4 The amount of water or steam used for NOx emission reduction has been investigated.2,5 Water and steam injections positively affect the industrial engine performance and the NOx emission reduction. Thus, several studies were conducted in this regard.6–9 The diluted steam and water injections are evaluated based on a specific parameter such as mixture temperature and pressure in a computational thermodynamic model of simulated gas turbines.10 The reduction efficiency of NOx increases with the increase in steam- or water-fuel ratio until an optimal ratio is achieved, beyond which no direct interference exists with the combustion mixture; subsequently, the NOx reduction level is not affected.11 Experiments also showed that with a 2% steam injection of the total airflow rate, the NOx emission reduction level could reach 25–33% and decrease to 38–47% with a 4% injection rate. Furthermore, the injected steam has been used to cool the gas turbine medium, increasing the total efficiency by approximately 2–3%.12,13 For water injection, theoretical and experimental results included the computational model values, showing that with 15% water addition in the combustion air, the NOx value was reduced from 15 to 7–8 parts per million, considering the same exhaust temperature owing to the decrease of the oxygen atom concentration.14 In addition, with water and steam injections, the power output increased from 39 to 43 MW and the NOx emission level decreased from 150 to 73 ppm.15 For a small mobile gas turbine, by injecting water into the combustion chamber, fuel consumption decreased by ∼16%, and the power output increased by 6%.16 The optimum water injection rate for NOx reduction has been numerically investigated and determined as 130% of the fuel flow.17 With the fuel half of the steam injection flow rate, NOx emissions were reduced by ∼12%.18 The proper location and direction of the angle of injection are directly correlated with this study, whether for the water or steam. When steam was directly injected into the ignition region (fuel spray or combustion air), NOx was considerably reduced. Although the behavior of water droplets and steam injections are similar in the combustion chamber, studies theoretically showed that water injection effectively reduced NOx because of its latent heat of evaporation.19 Thus, herein, the effects of both steam and water spray injections in the combustion chamber are investigated theoretically, considering the tilt injection angles. Both results are compared to determine the effectiveness of water or steam in reducing NOx emissions from gaseous fuel. Despite the presence of some general theoretical guidelines for the tilt angle of water and steam injection in gas turbines combustors and engines, many features are still unknown due to fewer studies in this regard. Herein, the effect of tilt angle injection for both water and steam injection into the combustor is studied experimentally and the real best tilt angle of injection is introduced with a comparison of the effectiveness between water and steam injection to reduce the NOx concentration values.
2. Methodology
An LPG domestic bottle containing propane (C3H8) in the Combustion Laboratory (CL) of the Mechanical Power Department (MPD) at the Faculty of Engineering (FE), Minia University (MU), Egypt22 was used in the chemical reaction. Table 1 shows the user-given data. The engineering equation solver (EES) program was used to solve the chemical reaction equations to obtain the NOx results. EES is a general equation-solving program that can solve nonlinear algebraic and differential equations. It can also perform linear and nonlinear regression and provide an uncertainty analysis. It has highly accurate thermodynamic and transport property data that are provided for hundreds of substances, allowing it to be used with the equation solver capability.23 Table 2 shows the measured points of the CL.
Table 1 Characteristics of LPG fuel used in the experiment
| Item |
Value |
Unit |
| Used fuel – LPG domestic bottle |
80% propane C3H8 |
% |
| 20% butane C4H10 |
| Assume that for the balanced chemical reaction the fuel is propane C3H8 |
| Entrance pressure range |
0.32 to 10 |
Bar |
| LPG flow rate range |
5 to 100 |
l h−1 |
| 0.095 to 19 |
l min−1 |
| LPG inlet temp. |
20 |
°C |
| LPG volume to mass unit |
1 litre = 0.51 kg = 510 gram |
L & gram |
| Air volume to mass unit |
77.3 litre = 100 gram |
L & gram |
| Oxygen density |
1.323 |
kg m−3 at 20 °C |
| LPG density |
1.898 |
kg m−3 at 20 °C |
Table 2 Experimental test rig measured points
| LPG flow rate |
l min−1 |
gram per s |
| Point 1 |
2.7 |
22.95 |
| Point 2 |
4.8 |
40.8 |
| Point 3 |
6.7 |
56.9 |
| Point 4 |
10.5 |
89.2 |
The gas flow meter at the Faculty Laboratory was fabricated to measure the oxygen gas flow rate. Thus, for measuring the LPG flow rate, the following calibration procedure calculation was performed:
| Oxygen density = 1.323 kg m−3 at 20 °C |
| LPG density = 1.898 kg m−3 at 20 °C |
| Q corrected (LPG) = Q scale (oxygen) × factor |
The airflow rate is in g s−1 at different equivalence ratios. Tables 3 and 4 show the ratios (Ø) and the gas flow rates and the data summary at different equivalence ratios with measured combustion air supply flow rates, respectively.
Table 3 Combustion air measured points of LPG fuel at different equivalence ratios (Ø)
| LPG g s−1 |
Ø |
Air g s−1 |
Air g s−1 calc. = (A/F) stoichiometric × LPG g s−1 |
| 22.95 |
1.1 |
325.5 |
= 14.11 × 22.95 |
| 1.0 |
360 |
= 15.686 × 22.95 |
| 0.8 |
432 |
= 18.82 × 22.95 |
| 0.7 |
468 |
= 20.39 × 22.95 |
| 40.8 |
1.1 |
575.6 |
= 14.11 × 40.8 |
| 1.0 |
640 |
= 15.686 × 40.8 |
| 0.8 |
767.85 |
= 18.82 × 40.8 |
| 0.7 |
831.9 |
= 20.39 × 40.8 |
| 56.8 |
1.1 |
802.8 |
= 14.11 × 56.8 |
| 1.0 |
892.5 |
= 15.686 × 56.8 |
| 0.8 |
1070.8 |
= 18.82 × 56.8 |
| 0.7 |
1160.1 |
= 20.39 × 56.8 |
| 89.2 |
1.1 |
1258.6 |
= 14.11 × 89.2 |
| 1.0 |
1399.2 |
= 15.686 × 89.2 |
| 0.8 |
1678.7 |
= 18.82 × 89.2 |
| 0.7 |
1818.7 |
= 20.39 × 89.2 |
Table 4 Volumetric flow rates of LPG fuel with combustion air measured points
| LPG l min−1 |
Ø |
Air l min−1 |
| 2.7 |
1.1 |
4.19 |
| 1.0 |
4.64 |
| 0.8 |
5.56 |
| 0.7 |
6.03 |
| 5.5 |
1.1 |
8.5 |
| 1.0 |
9.4 |
| 0.8 |
11.3 |
| 0.7 |
12.24 |
| 6.7 |
1.1 |
10.34 |
| 1.0 |
11.53 |
| 0.8 |
13.81 |
| 0.7 |
14.91 |
| 10.5 |
1.1 |
16.22 |
| 1.0 |
18.03 |
| 0.8 |
21.62 |
| 0.7 |
23.44 |
By applying a thermodynamic analysis of the simulated gaseous fuel combustion to that used in gas turbines,20 a first-law thermodynamic basis has been used, considering the gaseous chamber of the designed test rig as an open system. To calculate a stoichiometric ratio for a steady-state flow equation, eqn (1) was used.
| | |
Q − W = ΔH + ΔKE + ΔPE
| (1) |
The process is considered an adiabatic process (Q = 0), and the work transfer with potential and kinetic energy changes can be neglected. Thus, the equation is represented as follows:
The product and reactant enthalpies are proportional functions of temperature (Table 1); thus, the following hydrocarbon combustion was considered to determine the different properties of combustion:
| [Gaseous fuel] + [air] = products of combustion |
| | |
[R1(C) + R2(H) + R3(O) + R4(N) + R5(S)] + R6[O2 + 3.76N2] → P1CO2 + P2H2O + P3NO2 + P4SO2 + P5N2 + P6O2
| (3) |
The stoichiometric air-fuel ratio (A/F)S considering P as zero is given as follows:
| |
 | (4) |
| |
 | (5) |
Considering excess air, the equation is given as
| | |
CR1HR2OR3NR4SR5 + (1 + x)R6[O2 + 3.76N2] → P1CO2 + P2H2O + P3NO2 + P4SO2 + [(P5 + x)N2] + [(P6 + x)O2]
| (6) |
Dissociation occurs during the combustion process, and several chemical reactions occur simultaneously. For example, the combustion of pure carbon in oxygen is given as
| | |
C + O2 ↔ CO2 + TE (thermal energy)
| (7) |
The thermal energy (TE) released during combustion is sufficient to initiate the reverse reaction, i.e., the thermal dissociation of CO2. Because this reaction is endothermic (absorbing energy from the products), the temperature of the products will be reduced. The dissociation of the individual fuel species related to the combustion process of some reactions is reversible; hence, some of the energy indicated in eqn (7) will be lost. The reaction eqn (8) will adjust itself to attain an equilibrium state. This phenomenon is known as dissociation and is responsible for the decrease in the combustion temperature at some temperature (T), thus, a fraction of the υ mole fraction (moles of any species) among the products is dissociated. For the C–H–O–N system, the complete chemical equilibrium scheme is based on the following reversible reaction equations:
| | |
CO + ½O2 ↔ (1 − υ)CO2
| (8) |
| | |
½O2 + ½N2 ↔ (1 − υ)NO
| (12) |
| | |
½H2 + OH ↔ (1 − υ)H2O
| (13) |
| | |
H2 + ½O2 ↔ (1 − υ) + H2O
| (14) |
The dissociated reaction achieves the following form:
| | |
υR1R1 + υR2R2 ↔ υP1P1 + υP2P2
| (15) |
A general equilibrium constant for any reverse reaction is given by
| |
 | (16) |
To determine Kp, the Gibbs function is commonly used:
At equilibrium, the temperature is constant (ΔT = 0) and substituting V = nRT/P for an ideal gas gives the following equation:21
Integrating between states 1 and 2
| |
 | (19) |
For a reversible reaction with two reactants and products, the above equation becomes
| |
 | (20) |
The term in the square bracket on the RHS of eqn (20) is known as the equilibrium constant Kp; values for Kp for each constituent can be determined using eqn (16), subsequently determining the dissociated form of combustion. The stoichiometric reaction for a typical fuel is given by eqn (3). This equation does not consider the dissociation of the products; therefore, it needs to be changed to reflect the molecules occurring in the products.
2.1 Calculation structure
The given combustion methodology investigates the NOx emission from gaseous fuel combustion. The calculation categories and steps are as follows:
2.1.1. Stoichiometric calculations. First, the fuel composition and fuel properties are inserted. Next, the balanced equation of the combustion chemical reaction is determined (eqn (3)). We assume 298 K as the reference temperature and increase the temperature by 1 °C to enable the adiabatic flame temperature determination.
2.1.2. Dissociation calculations. The Kp values using Table 1 are based on the adiabatic flame temperature. Next, the dissociation degree is determined using eqn (15). Thus, the actual products of combustion are determined based on the results of the dissociation degree. We assume a temperature of 298 K and increase the temperature by 1 °C steps to determine the actual flame temperature. The actual flame temperature is calculated until it converges; for example, the new actual flame temperature minus the old actual flame temperature is either less than, or equal to a determined value such as 0.1 K. Depending on A/F, the balanced equation of the combustion chemical reaction (eqn (3)) can be modified to account for excess air and the process is repeated until the required NOx emission values are obtained.
3 Experimental test rig
Fig. 1 shows the experimental setup in CL, at MPD, FE, MU, which is used to compare the effects of water and steam injections in the primary combustion air with different operating conditions on NOx emissions from a simulated and experimental gaseous fuel combustor. Herein, a water injection kit and steam injection unit were used with the main test rig to investigate the direct-injected water and steam effects at ambient temperature to control the NOx emissions from the gas fuel. Water enters the primary combustion air path in the combustor from a clean small storage with a calibrated ruler having different directions, including the inclination angles and flow rates. Steam is added to the same location using a locally-made electric steam boiler with a 200 kg total capacity, 2.8 bar exit pressure, and ∼4 l min−1 steam flow rate. Both the steam and water kits are used to examine the final results of NOx emissions values. An experimental setup for the constructed device is shown in Fig. 1. It consists of a gaseous combustor, an inlet LPG fuel cylinder kit, and steam and water injection units. The combustor is a canned-type gaseous premixed combustion chamber consisting mainly of two parts. The body of the combustion chamber is comprised of a carbon steel cylinder of 10 cm diameter, 100 cm length, and 5 mm thickness. A tab exists in the circumference with a 3 cm body diameter to fix the fuel nozzle. The second part of the combustion chamber is the fuel nozzle, free with the combustor casing and accessible for both retraction and insertion. It has a 2 mm inlet diameter and is connected to a stainless steel pipe with 50 cm length and 2 cm diameter. A threaded nut for four holes of 10 mm diameter is tapped and threaded at the top of the combustor body. The holes are the measuring points, and the distance between each hole is approximately 20 cm. The fourth hole is connected to a small T-90° pipe with a 1 cm diameter and 40 cm length as the measuring point for the exhaust flue gas analyzer probe. Other holes are used for measuring the exhaust temperature, and both steam and water injection holes at the fuel nozzle fuel tips are present, and if needed, one hole is provided as a spare and the last hole for the flue gas exhaust measuring point to measure the NOx emission values. For the fuel system, LPG fuel (80% C3H8 and 20% butane) is supplied from the commercial gas bottles through a rubber hose and injected at the fuel nozzle; the nozzle diameter is 5 mm. The fuel flow rate is regulated using the control valve and is measured using a medical regulator implemented using a rotameter that is used to measure the oxygen gas flow rate. The scale is a direct, high capacity, and glass tube type with ±5% accuracy and is calibrated to measure the LPG fuel. In addition, the air is supplied to the combustion chamber using an air centrifugal compressor (Ingersoll rand) in CL with 50 kW power. It provides air to the combustion chamber for fuel combustion. The discharge from the air compressor end is connected to the primary air pipe, fitted into the fuel nozzle pipe at 45° and 10 cm before the nozzle tip. The connection is made using a flexible hose and an air control valve to adjust the inlet air for the combustion process. The airflow rate is measured using the same medical regulator that is used for measuring the inlet LPG fuel. For water and steam injection units, water is injected through a rubber hose into the primary combustion air zone. In contrast, steam is injected into the same location through a small 0.5-inch diameter stainless steel pipe. Both units are fixed on a stainless steel stand with a 130 cm height from the injection point to be simulated as a head tank for the water and steam injections under the same conditions. Water is supplied from a normal potable water source, whereas steam is supplied using a small electric boiler as mentioned above.
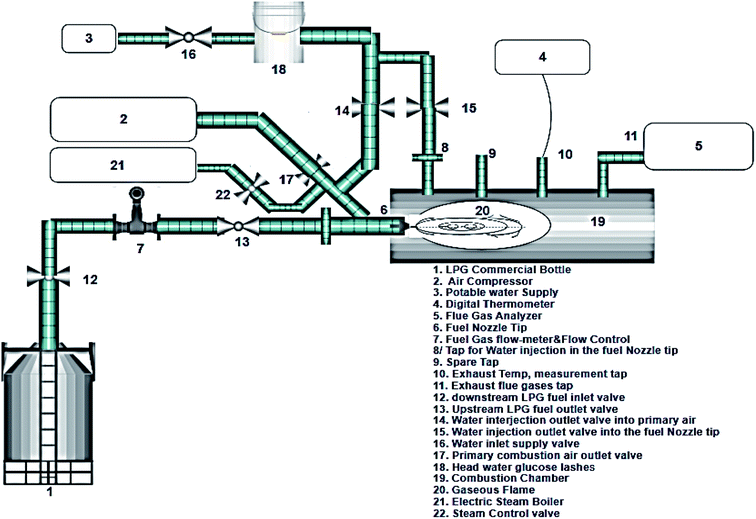 |
| | Fig. 1 Schematic diagram of the experimental test section. | |
3.1 Experiment description
Herein, the fuel source is provided using LPG commercial bottles. The fuel flows through the fuel nozzle tube, and a flowmeter regulator controls its rate. A rotameter, which is part of a flow meter regulator device, also measures the fuel flow rate. An air compressor with 150 kW total capacity is used to supply air to the combustion chamber, and a butterfly valve controls the airflow rate. The water injection kit comprising glucose lashes drops the injected water flow through a medical injector to ensure that the droplets enter the combustor, directly to the primary combustion air zone with different inclination angles of 30°, 45°, 90°, and 135°. The droplets are injected in the shape of atomizing droplets to enable full atomization and prevent water stagnation inside the combustor that could quench the flame. Moreover, a small electric boiler with 200 kg capacity, 2.8 bar exit pressure, and 4 l min−1 steam flow rate provides saturated steam and uses a flexible stainless steel hose to direct the steam into the primary combustion air zone at different angles of 30°, 45°, 90, and 135°. The water droplets flow into the combustor from a 130 cm height, and the steam flows through a 75 cm length flexible hose. The exhaust temperature was measured using the Chromel–Alumel thermocouple (K-type) (with 200 μm diameter wires and a normal measuring range of 0–1370 °C) using a digital thermometer. NOx formation was measured using the gas emission analyzer from the port of the gas sample heated handle with a length of 0.9 ft and a hose of 11.5 ft, and the NOx was measured using a digital FGA-4000XD gas emission infrared analyzer.
Fig. 1 shows a schematic of the experimental test rig. It mainly consists of a combustion chamber, LPG commercial bottle, water and electric steam kit, air compressor, and injection probes for angle direction changes. There are two different lines to supply the water and steam into the combustion chamber. The test rig has manual globe valves to control the fuel, water and steam flow rates. For the measurement tools, a rotameter is used to measure and control the fuel flow rate and a NOx digital analyzer is used to record the nitrogen oxide emission values. For the experiment, the LPG gas bottle flow rate was adjusted and choked by a globe valve and rotameter. The water and steam were injected and individually controlled by two globe valves and the combustion air was supplied by an air compressor and also controlled by a globe valve at the entrance of the test rig to maintain the air-to-fuel ratio at around 12![[thin space (1/6-em)]](https://www.rsc.org/images/entities/char_2009.gif) :
:![[thin space (1/6-em)]](https://www.rsc.org/images/entities/char_2009.gif) 1. NOx emissions from the exhaust probe were recorded in PPM, which compared different operating parameters such as fuel flow rate, exhaust temperature, and water/steam flow rates.
1. NOx emissions from the exhaust probe were recorded in PPM, which compared different operating parameters such as fuel flow rate, exhaust temperature, and water/steam flow rates.
3.2 Experimental procedures
The experiment was conducted to record the NOx emission concentration in ppm, exhaust gas temperature in °C, LPG flow rates in L min−1, and the injected water and steam flow rate in L min−1.
These results were recorded to experimentally establish the effects of normal direct-water and -steam injections on NOx emissions at different injection flow rates (related to LPG) and the inclination of injection angles at the primary combustion air zone into a typically constructed small gas combustor. Some precautions and preparations were ensured before starting the experiment, such as checking the LPG regulator (rotameter) and zero-level adjustment. The digital temperature thermometer was adjusted, and the selector shift was checked from °C to °F and vice versa. Moreover, a K-type thermocouple was connected in both TC1 and TC2, ensuring an accurate reading. The electric steam boiler was checked for leaks, and the normal operation was checked separately before feeding steam into the combustor. The NOx analyzer was checked by adjusting the zero calibration push-button for approximately 5 min to prepare the analyzer for measuring the NOx values. After these preparations, the air compressor was started and its control valves were partially opened to deliver the required amount of the combustion air relative to the differential LPG flow rates per measuring points, adopted with different equivalence ratios in the measuring point tables. The LPG fuel valve was opened until combustion was completed, then the fuel flow rate was adjusted such that the rotameter read the specified flow rate difference of 2.7–10 l min−1. In addition, the water injection kit and electric steam boiler were externally checked to ensure adequate water level and availability, and the injector was checked to ensure atomized water droplet discharge. The flexible hose of the steam line was checked to ensure a continuous and seamless flow of saturated steam. Next, the steam and water injection units were checked to ensure the targeted delivery of steam or water into the primary combustion air zone. Enough time was allowed for the stability of all measuring instruments and the test rig for each experimental condition.
3.3 Experimental error analysis
The experimental airflow rate measurements were performed using the same fuel flow meter model after recalibration, considering the air temperature and density. The results varied from that obtained theoretically by approximately 3%. The other compositions of the real LPG bottle composition were neglected, except for C3H8, which was adopted in the chemical reaction calculation because it is considered ∼7–9% of the whole chemical composition.
4. Results and discussion
In this study, an experimental comparison was made between the effects of direct-water and -steam injections on NOx emissions from gaseous flames, considering commercial LPG (C3H8) as the gas fuel for combustion at different fuel flow rates. The overall standard chemical reaction was stoichiometrically structured with the fuel–air mixture to investigate the NOx product from hydrocarbon fuel.
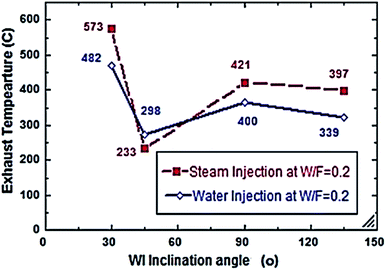
Fig. 2–7 show the effects of different water and steam injection flow rates, of 0.2–0.4 l min−1 under the conditions of fuel flow rate of 2.7 l min−1 at different inclination angles of 30°, 45°, 90°, and 135°, on the exhaust gas temperature and NOx emission concentration results. The exhaust gas temperature and NOx gradually decreased as steam and water injection flow rates increased (Fig. 2 and 3). At the steam-to-fuel injection ratio (S/F) of 0.2, the exhaust gas temperature initially decreased from 504 °C at an inclination angle of injection into the primary combustion air zone of 30° to 129 °C at 45°, then it increased to 469 °C at 90° and decreased again to 356 °C at 135°. Simultaneously, the NOx emission concentration decreased from 415 ppm at an inclination angle of 30° to 207 ppm at 45°, then increased to 359 ppm at 135° and decreased to 325 ppm at 135°. At a water-to-fuel injection ratio (W/F) of 0.2, the exhaust gas temperature initially decreased from 450 °C at 30° inclination angle to 110 °C at 45° then, it increased to 398 °C at 90° and decreased to 318 °C at 135°. The NOx emission concentration decreased from 371 to 291 ppm at different inclination angles from 30° to 135°. The exhaust gas temperature and NOx emission concentration were experimentally studied at S/F and W/F of 0.3 (Fig. 4 and 5). At the steam injection, the exhaust temperature decreased from 502 °C to 325 °C at 30–135°, and NOx emission concentration varied from 415 to 325 ppm at 30–135°. For S/F of 0.3, the exhaust temperature decreased from 402 °C to 291 °C, and NOx emission concentration decreased from 371 to 291 ppm at 30–135°.
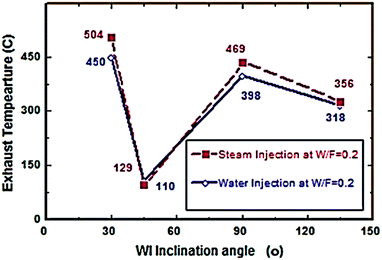 |
| | Fig. 2 Exhaust temperature comparison between steam and water injection to fuel flow rate of 2.7 litre per min at W/F and S/F 0.2. | |
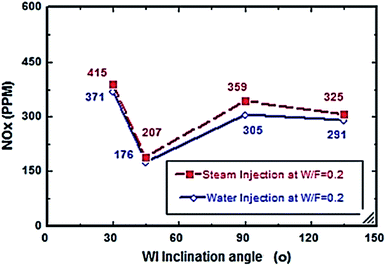 |
| | Fig. 3 NOx comparison between steam and water injection to fuel flow rate of 2.7 litre per min at W/F and S/F 0.2. | |
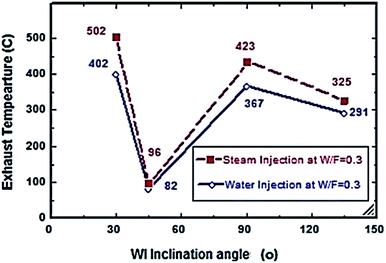 |
| | Fig. 4 Exhaust temperature comparison between steam and water injection to fuel flow rate of 2.7 litre per min at W/F and S/F 0.3. | |
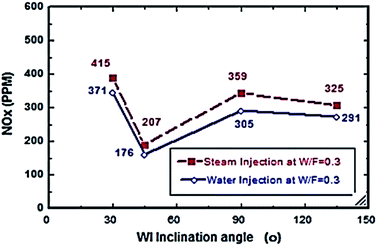 |
| | Fig. 5 NOx comparison between steam and water injection to fuel flow rate of 2.7 litre per min at W/F and S/F 0.3. | |
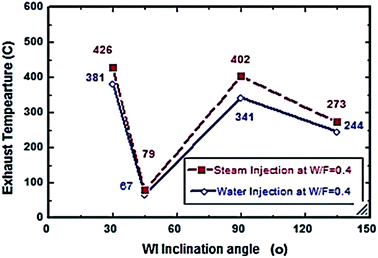 |
| | Fig. 6 Exhaust temperature comparison between steam and water injection to fuel flow rate of 2.7 litre per min at W/F and S/F 0.4. | |
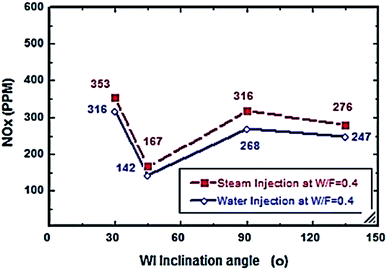 |
| | Fig. 7 NOx comparison between steam and water injection to fuel flow rate of 2.7 litre per min at W/F and S/F 0.4. | |
From Fig. 6 and 7, S/F and W/F are 0.4. The decrease in the exhaust gas temperature and NOx emission concentration will be greater as compared to S/F and W/F of 0.2. At a steam-injection rate of 0.4 to the fuel flow rate, the exhaust gas temperature decreased from 426 to 273 °C, and NOx emission concentration decreased from 353 to 276 ppm at 30–135°. At a water injection rate of 0.4 to the fuel flow rate, the exhaust gas temperature decreased from 381 °C to 244 °C, and the NOx emission concentration decreased 316 to 247 ppm at angles of 30°, 45°, 90°, and 135°. These results show that the exhaust gas temperature decreased with the increase in the injection rate, regardless of steam or water. Similarly, the NOx concentration decreased and was proportional to the exhaust gas temperature effect. From the different inclination angles into the primary combustion air zone, the optimal NOx emission concentration and exhaust temperature occurred at approximately 45°. This trend is attributed to the improved steam injection and water droplet distribution at this angle and the larger magnitude of the gas droplets relative to the velocity at this angle, leading to a better evaporation rate and a touchable intense break-up of NOx to reduce NOx emissions. The water injection effect was approximately 13–15% greater than that of steam by reducing the effect on the exhaust gas temperature and NOx emission concentration due to the greater latent heat of the water droplets. This led to a better evaporation rate and specific heat capacity of the injected water, which could aid the fuel in penetrating further into the hot air region. This would increase the entrainment of air by the fuel jet and thus, the injected water could affect the stabilization of the flame surrounding the combustion zone as compared to the steam, and the fuel jet lift off length has a significant effect on NOx formation rate, which leads to a decrease in NOx values, especially at higher load conditions. The results are in agreement with the results of previous studies.24–26,34,35 Fig. 8–13 show the effects of different water and steam injection flow rates of 0.2–0.4 l min−1 from the fuel flow rate of 5.5 l min−1 at different inclination angles of 30–135° on the exhaust gas temperatures and NOx emission concentrations. The exhaust gas temperatures and NOx emission concentrations increased for both water and steam injections as compared with those under the same conditions of 2.7 l min−1 fuel flow rate. Thus, the exhaust gas temperature and NOx emission concentrations are directly proportional to the fuel flow rate due to the increasing airflow rate to execute the required stoichiometry to complete combustion. Consequently, the flame temperature will be increased, and accordingly, the exhaust gas temperature will increase, which is proportional to the NOx values, considering the better effect of water injection as compared with the steam injection on NOx value reduction by ∼18%. The results are experimentally in agreement with those of previous studies.27–29,33 The effects of varying the steam and water injection flow rates from 0.2–0.6 l min−1 to the fuel flow rate of 2.7 l min−1 are investigated as shown in Fig. 14 and 15. The results indicate that the exhaust gas temperature decreases with water and steam injections from 418 °C to 196 °C and 468 °C to 398 °C, respectively. Moreover, NOx emission concentrations decreased with water and steam injections from 302 to 156 ppm and 338 to 317 ppm. By carefully examining both curves, the optimal W/F and S/F to effectively reduce the exhaust gas temperatures and NOx emission concentrations were estimated to be 0.4–0.45 and 0.35–0.42, respectively. These results can be attributed to the fact that regardless of the injection, the distribution is reduced, leading to less evaporation, possibly stagnating the water droplets, and the steam flow occupies only the available volume of the combustion process inside the combustor. The remaining steam could be slightly liquefied, gradually increasing the exhaust gas temperature, and consequently, the NOx emission concentration also. These results are compatible with those in previous studies.30–32
 |
| | Fig. 8 Exhaust temperature comparison between steam and water injection to fuel flow rate of 5.5 litre per min at W/F and S/F 0.2. | |
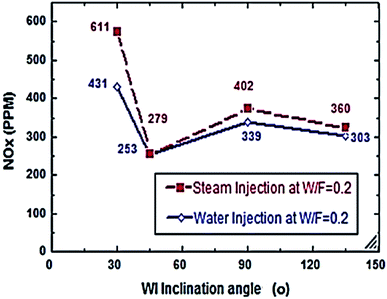 |
| | Fig. 9 NOx comparison between steam and water injection to fuel flow rate of 5.5 litre per min at W/F and S/F 0.2. | |
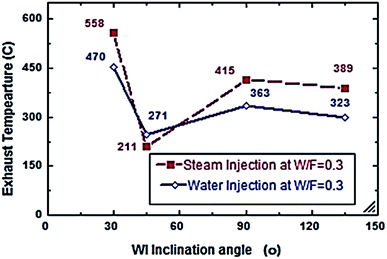 |
| | Fig. 10 Exhaust temperature comparison between steam and water injection to fuel flow rate of 5.5 litre per min at W/F and S/F 0.3. | |
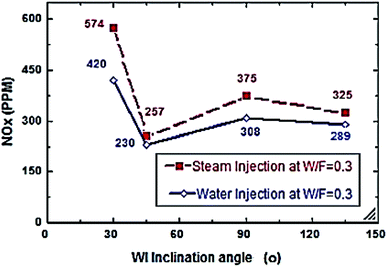 |
| | Fig. 11 NOx comparison between steam and water injection to fuel flow rate of 5.5 litre per min at W/F and S/F 0.3. | |
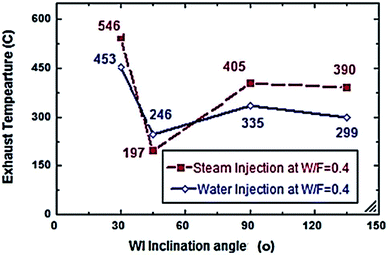 |
| | Fig. 12 Exhaust temperature comparison between steam and water injection to fuel flow rate of 5.5 litre per min at W/F and S/F 0.4. | |
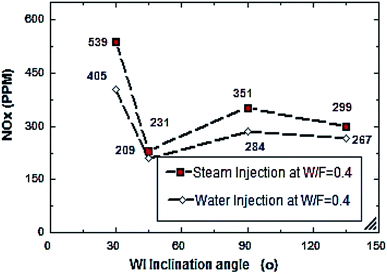 |
| | Fig. 13 NOx comparison between steam and water injection to fuel flow rate of 5.5 litre per min at W/F and S/F 0.4. | |
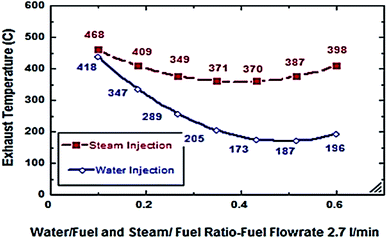 |
| | Fig. 14 Exhaust temp. comparison between steam and water injection at different rates at fuel flow rate of 2.7 litre per min. | |
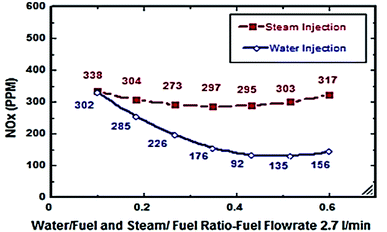 |
| | Fig. 15 NOx comparison between steam and water injection at different rates at fuel flow rate of 2.7 litre per min. | |
5. Conclusion
Concerning the recent advances and correlated studies regarding the water- and steam-injection effects on NOx reduction, significant attention has been directed toward the combustion process using gas turbines. Only a few studies have experimentally investigated the effects of water and steam injections at different inclination angles into the primary combustion air zone with the gas fuel. The following conclusions were drawn. Both water and steam injections effectively reduce NOx emissions from gaseous flames owing to the direct effect on the flame temperature, thus, it appeared practically as an exhaust gas temperature, and the NOx emission concentration is proportional to the exhaust gas temperature. Conversely, the exhaust temperature of the water injection is greater than that of steam injection, but the corresponding NOx emission concentration of water injection is less than that of steam injection at a fuel flow rate of 5.5 l min−1 and W/F and S/F of 0.3 owing to the transient conditions of NOx product dissociation. The optimal inclination angle of both water and steam injections into the primary combustion air zone to reduce the NOx emission is 45° because of the better water and steam distribution and larger magnitude of the relative velocity of the gas droplets, resulting in better evaporation and decompositions of the NOx particles, finally reducing the NOx emissions.
Funding
This work was supported by the Faculty of Engineering at Minia University in Minia, Egypt.
Nomenclature
| B | Blend ratio |
| HHV | Higher heating value (MJ kg−1) |
| KE | Kinetic energy (J) |
| N | Number of moles |
| p | Pressure (Pa) |
| Q | Heat transfer (W) |
| R | Gas constant (kJ kg−1 K−1) |
| S | Entropy (kJ kg−1 K−1) |
| T | Temperature |
| TE | Thermal energy (J) |
| W | Work transfer (J) |
| G | Gibbs function |
| Ho | Enthalpy of formation at STP (kJ kmol−1) |
| Kp | Dissociation equilibrium constant |
| PE | Potential energy (J) |
| Δ | Difference, change |
| υ | Mole fraction |
| P | Products of reaction |
| R | Reactants |
| S | Stoichiometric |
| Q | Equivalence ratio |
Conflicts of interest
There are no conflicts to declare.
Acknowledgements
This study was conducted by the faculty of Eng. at Minia University – El-Minia; Egypt; Also the author committee would like to thank deeply Prof. Dr Ali abdeltawab and Prof. Dr Mohamed Ali morad for their real support in the experiment measurement in addition to the effort of ENAGO who provide the language and writing Editing help.
References
- B. Harrison and A. F. Diwell, Controlling nitrogen oxide emissions from industrial sources; an application for selective catalytic reduction, Platinum Met. Rev., 1985, 29(2), 50 CAS.
- A. H. Lefebvre, The role of fuel preparation in low emission combustion, Trans. ASME: J. Eng. Gas Turbines Power, 1995, 117(4), 617–654 CrossRef CAS.
- R. Pavri and G. D. Moore, Gas turbine emissions and control, GE Reference Library, GER-4211, 03/01, 2001 Search PubMed.
- B. Schetter, Gas turbine combustion and emission control, Lecture Series, Combined cycles for power plants, Von Karman Institute for Fluid Dynamics, 1993, pp. 1993–2008 Search PubMed.
- H. Shaw, The effects of water, pressure, and equivalence ratio on nitric oxide production in gas turbines, Trans. ASME: J. Eng. Power, 1974, 96(3), 240–246 CAS.
- R. Digumarthy, C. Cheng and N. Chung, Cycle implementation on a small gas turbine engine, Trans. ASME: J. Eng. Gas Turbines Power, 1984, 106, 699–702 CrossRef.
- D. A. Kolp and D. J. Moeller, World's rest full STIG LM5000 installed at Simpson Paper Company, Trans. ASME: J. Eng. Gas Turbines Power, 1989, 111, 200–210 CrossRef.
- W. E. Fraize and C. Kinney, Effects of steam injection on the performance of gas turbine power cycles, Trans. ASME: J. Eng. Gas Turbines Power, 1979, 101(2), 217–227 CrossRef.
- J. B. Burnham, M. H. Giuliani and D. J. Moeller, Development, installation and operating results of a steam injection system (STIG) in a General Electric LM5000 gas generator, Trans. ASME: J. Eng. Gas Turbines Power, 1987, 109(3), 257–262 CrossRef.
- P. D. Noymer and D. G. Wilson, Thermodynamic design considerations for steam-injected gas turbines, ASME Paper 93. GT, 1983, vol. 432 Search PubMed.
- D. Bivinis, Technical Guidance Cam Document Compliance Assurance Monitoring, Water Steam Injection, 2018, 28(29), 30 Search PubMed , document, 17.
- N. Dibelius, M. Hilt and R. Johnson, Reduction of nitrogen oxides from gas turbines by steam injection, ASME International Gas Turbine Conference and Products Show, ASME, 1971 Search PubMed.
- M. De Paepe and E. Dick, Cycle improvements to steam injected gas turbines, Int. J. Energy Res., 2000, 24(12), 1081–1107 CrossRef.
- A. Bhargava, et al., An experimental and modeling study of humid air premixed flames, J. Eng. Gas Turbines Power, 2000, 122(3), 405–411 CrossRef CAS.
- M. Cârdu and M. Baica, Gas turbine installation with total water injection in the combustion chamber, Energy Convers. Manage., 2002, 43(17), 2395–2404 CrossRef.
- W. De Paepe, F. Delattin, S. Bram and J. De Ruyck, Water injection in a micro gas turbine–assessment of the performance using a black box method, Appl. Energy, 2013, 112, 1291–1302 CrossRef.
- V. V. Lupandin, et al., Design, development and testing of a gas turbine steam injection and water recovery system, ASME Turbo Expo, Power for land, Sea, and air, ASME, 2001 Search PubMed.
- E. Benini, S. Pandolfo and S. Zoppellari, Reduction of NO emissions in a turbojet combustor by direct water/steam injection: Numerical and experimental assessment, Appl. Therm. Eng., 2009, 29(17–18), 3506–3510 CrossRef CAS.
- T. Furuhata, T. Kawata, N. Mizukoshi and M. Arai, Effect of steam addition pathways on NO reduction characteristics in a can-type spray combustor, Fuel, 2010, 89(10), 3119–3126 CrossRef CAS.
- S. Oberweis, T. T. Al-Sahemmri and N. Packer, The impact of dissociation on the flame temperature in biomass combustion, HEATSet Conference, Chambéry, France, 18th–April 20th 2007 Search PubMed.
- M. Lapuerta, O. Armas and J. Rodriguezfernandez, Effect of biodiesel fuels on diesel engine emissions, Prog. Energy Combust. Sci., 2008, 34(2), 198–223 CrossRef CAS.
- Ministry of Military Production; http://momp.gov.eg–Products/LPGDomesticGasBottles., 2018.
- F. Chart software – EES overview, 2020 Search PubMed.
- A. H. Ayed, et al., Experimental and numerical investigation of dry low NOx hydrogen combustion chamber and industrial gas turbine, Propulsion and Power Research, 2015, 4(3), 123–131 CrossRef.
- M. R. Kotob, T. Lu and S. S. Wahid, Experimental study of direct water injection effect on NOX reduction from the gas fuel, J. Adv. Res. Fluid Mech. Therm. Sci., 2020, 76(3), 92–108 CrossRef.
- C. Tao and H. Zhou, Effects of superheated steam on combustion instability and NOx emissions in a model lean premixed gas turbine combustor, Fuel, 2020, 288, 119646 CrossRef.
- J. Serrano, F. J. Jiménez-Espadafor, A. Lora, L. Modesto-Lopez, A. Ganan-Calvo and J. Lopez-Serrano, Experimental analysis of NOx reduction through water addition and comparison with exhaust gas recycling, Energy, 2018, 168, 737–752 CrossRef.
- A. Farokhipour, E. Hamidpour and E. Amani, A numerical study of NOx reduction by water spray injection in gas turbine combustion chambers, Fuel, 2018, 212, 173–186 CrossRef CAS.
- R. Sharafoddini, M. Habibi2 and M. Pirmohammadi, Numerical study of water vapor injection in the combustion chamber to reduce gas turbine fuel consumption, J. Appl. Fluid Mech., 2020, 1047–1054 Search PubMed.
- V. M. Madhavan and D. Senthilkumar, Experimental investigation of NOx emission on a single cylinder diesel engine using low pressure steam injection, Adv. Nat. Appl. Sci., 2016, 10(7), 220–226 CAS.
- D. A. B. Novelo, U. Igie, V. Prakash and A. Szymański, Experimental investigation of gas turbine compressor water injection for NOx emission reductions, Energy, 2019, 176, 235–248 CrossRef.
- H. Yilmaz, O. Cam and I. Yilmaz, Experimental investigation of flame instability in a premixed combustor, Fuel, 2020, 262, 116594 CrossRef CAS.
- G. Oztarlik, L. Selle, T. Poinsot and T. Schuller, Suppression of instabilities of swirled premixed flames with minimal secondary hydrogen injection, Combust. Flame, 2020, 214, 266–276 CrossRef CAS.
- H. Zhou and C. Tao, Effects of annular N2/O2 and CO2/O2 jets on combustion instabilities and NOx emissions in lean-premixed methane flames, Fuel, 2020, 263, 116709 CrossRef CAS.
- J. Kim, et al., Improving the thermal efficiency of a T-GDI engine using hydrogen from combined steam and partial oxidation exhaust gas reforming of gasoline under low-load stoichiometric conditions, Fuel, 2020, 273, 117754 CrossRef CAS.
- M. Weiss, et al., Will Euro 6 reduce the NOx emissions of new diesel cars. Insights from on-road tests with portable emissions measurement systems (PEMS), Atmos. Environ., 2012, 62, 657–665 CrossRef CAS.
- F. Wirbeleit, C. Enderle, W. Lehner, A. Raab and K. Binder, Stratified diesel fuel-water-diesel fuel injection combined with EGR for most efficient in-cylinder NOx and PM reduction technology, SAE [Tech. Pap.], 1997, 972962 Search PubMed.
- L. Brooke, Bosch developing new water-injection system for production engines. Automotive Engineering, SAE International, 2015 Search PubMed.
- R. Adnan, H. Masjuki and T. Mahlia, Performance and emission analysis of hydrogen fueled compression ignition engine with variable water injection timing, Energy, 2012, 43, 416–426 CrossRef CAS.
- W. Mingrui, Sa N. Thanh, R. F. Turkson, L. Jinping and G. Guanlun, Water injection for higher engine performance and lower emissions, J. Energy Inst., 2017, 90, 285–299 CrossRef.
- Z. Şahin, O. Durgun and M. Tuti, Chapter 4.4—an experimental study on the effects of inlet water injection of diesel engine heat release rate, fuel consumption, opacity, and NOx emissions A2—Dincer, Ibrahim, in Exergetic, energetic and environmental dimensions, ed. C. O. Colpan and O. Kizilkan, Academic Press, Cambridge, 2018, pp. 981–996 Search PubMed.
|
| This journal is © The Royal Society of Chemistry 2021 |
Click here to see how this site uses Cookies. View our privacy policy here.  Open Access Article
 *a,
Tianfeng Lub and
Seddik S. Wahida


![[thin space (1/6-em)]](https://www.rsc.org/images/entities/char_2009.gif) :
:![[thin space (1/6-em)]](https://www.rsc.org/images/entities/char_2009.gif) 1. NOx emissions from the exhaust probe were recorded in PPM, which compared different operating parameters such as fuel flow rate, exhaust temperature, and water/steam flow rates.
1. NOx emissions from the exhaust probe were recorded in PPM, which compared different operating parameters such as fuel flow rate, exhaust temperature, and water/steam flow rates.


