 Open Access Article
Creative Commons Attribution 3.0 Unported Licence
Temperature dependence of the rigid amorphous fraction of poly(butylene succinate)
Maria Cristina Righetti *a,
Maria Laura Di Lorenzo
 b,
Patrizia Cinelli
 c and
Massimo Gazzano
 d
d
aCNR-IPCF, National Research Council – Institute for Chemical and Physical Processes, Via Moruzzi 1, 56124 Pisa, Italy. E-mail: cristina.righetti@pi.ipcf.cnr.it
bCNR-IPCB, National Research Council – Institute of Polymers, Composites and Biomaterials, Via Campi Flegrei 24, 80078 Pozzuoli, Italy
cUniversity of Pisa, Department of Civil and Industrial Engineering, Largo Lazzarino 2, 56122 Pisa, Italy
dCNR-ISOF, National Research Council – Institute of Organic Synthesis and Photoreactivity, Via Gobetti 101, 40129 Bologna, Italy
First published on 27th July 2021
Abstract
In this contribution the temperature evolution of the constrained or rigid amorphous fraction (RAF) of biodegradable and biocompatible poly(butylene succinate) (PBS) was quantified, after detailed thermodynamic characterization by differential scanning calorimetry and X-ray diffraction analysis. At the glass transition temperature, around −40 °C, the rigid amorphous fraction in PBS is about 0.25. It decreases with increasing temperature and becomes zero in proximity of 25 °C. Thus, at room temperature and at the human body temperature, all the amorphous fraction is mobile. This information is important for the development of PBS products for various applications, including biomedical applications, since physical properties of the rigid amorphous fraction, for example mechanical and permeability properties, are different from those of the mobile amorphous fraction.
Introduction
Poly(butylene succinate) (PBS) is a biodegradable and biocompatible polyester produced by polycondensation of succinic acid and 1,4-butanediol. Both monomers can be petrol-derived, but can be produced also from renewable resources: succinic acid via fermentation of carbohydrates,1,2 and 1,4-butanediol through hydrogenation and reduction of succinic acid.3 Thus, considering the growing tendency towards production of sustainable materials, PBS appears a very interesting polymer, as attested by an increasing amount of papers devoted to the properties and utilization of this polyester.The low glass transition temperature of PBS, well below room temperature, and the relatively high melting temperature (above 100 °C) are similar to those of most common polyolefins. Also the mechanical properties do not differ substantially from those of polypropylene, or low- and high-density polyethylene.4 Currently PBS is commercialized mainly as a component for compostable bags, mulching films, nets, nonwoven sheets, beverage cups and food utensils,5 whereas PBS-based composites are of interest for food packaging.5–7 PBS is used in biomedicine, to make bone marrow stem cells, in tissue repair and engineering, to fabricate scaffolds that enhance the regeneration of bone in the dental socket, and also blended with chitosan for antimicrobial and antitumor activity, improved protein absorption and rapid cell growth.4,8–14 In addition, due to its high flexibility and toughness, PBS has been widely used in blends with other biodegradable and/or bio-based polymers, such as poly(lactic acid), poly(hydroxybutyrate), poly(propylene carbonate).15–19 Although these blends are generally immiscible, materials with improved ductility and reduced brittleness can be obtained.
PBS is a semi-crystalline polymer, characterized by a quite high crystallinity degree (35–45%). Upon melt crystallization, α-crystals grow, whereas upon stretching, a different crystal modification, β-form, is obtained reversibly by solid–solid transition.20,21 Both phases are characterized by a monoclinic cell containing two repeating units, arranged with chain conformation TTTGTḠTTTT in the α-phase and with all chains in trans conformation in the β-form. PBS crystallization rate is high: the processes is completed in about 1 min at −10 °C, and in less than 10 s in the temperature range between 10 and 80 °C.22 This means that quenched PBS cannot be maintained in the amorphous state at room temperature.
In polymers, a semi-crystalline structure necessarily implies the presence of a constrained interphase at the amorphous/crystal boundary, due to the covalent bonds that connect the crystalline and amorphous regions. The nano-metric constrained amorphous interphase is generally called rigid amorphous fraction (RAF), because it is characterized by reduced chain mobility compared to the mobile amorphous fraction (MAF).23 The MAF vitrifies/devitrifies at Tg, whereas vitrification/devitrification of progressively more constrained amorphous regions, i.e. RAF, occurs at progressively higher temperatures, as clearly reported in quite recent years.23,24 RAF percentages of about 20–30 wt% have been determined for several polymers at Tg, whereas its temperature dependence has been determined only for few polymers.24 Also for PBS, RAF amount of this order of magnitude has been measured at Tg.25–27 Recent studies have demonstrated that the rigid amorphous fraction influences the performance of semi-crystalline polymers, because many physical properties of the RAF are different from those of the crystalline and the mobile amorphous fractions.28–35 Experimental evidences and theoretical modelling have demonstrated that the elastic modulus of the RAF (ERA) is between those of the crystalline (EC) and mobile amorphous (EMA) fractions, in the order EMA < ERA < EC.29,31,32 On the other hand, the density of the RAF (ρRA) is lower than that of the MAF (ρMA), due to the higher RAF vitrification temperature,32,33 so that the order of the densities turns out to be ρRA <ρMA <ρC, where ρC is the density of the crystalline phase.
A rigid amorphous fraction is present in almost all semi-crystalline polymers,23 and can exist in nano-layered polymers,36–38 block copolymers,39,40 and polymer nanocomposites.41–49 Since it can constitute a large fraction of the overall material, it has large impact on properties. Huge research efforts have been devoted in the latest years to a thorough understanding of the RAF, as recently reported in a review,24 where the experimental methods used to monitor the RAF, the influence of thermal history and crystal structure/morphology on the RAF, and the RAF influence on material properties are summarized.
These considerations imply that quantitative information on the RAF is essential to design industrial processes for specific applications of semi-crystalline polymers. If mechanical and barrier properties have to be fine-tuned, for example in case of films for food packaging, it needs to be taken into account that the rigid amorphous and crystalline fractions have opposite effects on barrier properties,34,35 whereas they together contribute to the material stiffness.28–32 Thus, a proper balance between crystalline and rigid amorphous fractions is essential to develop a material with specific gas/vapor permeability and flexibility.
Needless to say, the above considerations on the RAF density and modulus refer to vitrified RAF, since, once the RAF is mobilized, its properties become similar to the MAF. This clarifies the importance of knowledge on the RAF glass transition. Unfortunately literature information on RAF devitrification are available only for a few semi-crystalline polymers, including among others poly(L-lactic acid), poly(1-butene), poly[(R)-3-hydroxybutyrate], poly(ethylene terephthalate), poly(butylene terephthalate),50–54 but to date not yet disclosed for PBS. Also the physical properties of the PBS rigid amorphous fraction (for example mechanical or permeability properties) have not yet been investigated.
With this manuscript, data on devitrification of the RAF in PBS are presented, with the aim to favor the interpretation and prediction of physical properties, in particular mechanical and barrier properties, of PBS-based materials. For an accurate quantification of the RAF evolution as a function of the temperature, a preliminary thermodynamic characterization of PBS was performed by differential scanning calorimetry and X-ray diffraction analysis.
Experimental
Chemicals
Additive-free poly(butylene succinate) (PBS) was kindly supplied by SIPOL (Mortara, Italy). The number-average molar mass (Mn) and the weight-average molar mass (Mw) are 27.8 × 10³ and 72.7 × 10³ g mol−1, respectively, as determined by gel-permeation chromatography (GPC). The as received PBS chips were dried under vacuum overnight at 60 °C, then compression-moulded into 200 μm thick films. Compression-moulding was performed with a Collin Hydraulic Laboratory Forming Press P 200 E at 130 °C for 3 min, then the films were cooled to room temperature by cold water circulating into the press plates. GPC analyses revealed no sizable change of molar mass of PBS after compression-moulding.Thermal analysis
Differential Scanning Calorimetry (DSC) measurements were performed with a Perkin Elmer Calorimeter DSC 8500 equipped with an IntraCooler III as refrigerating system. The instrument was calibrated in temperature with high purity standards (indium, naphthalene, cyclohexane) according to the procedure for standard DSC.55 Enthalpy calibration was performed with indium. Dry nitrogen was used as purge gas at a rate of 20 mL min−1. To gain precise heat capacity data from the heat flow rate measurements, each scan was accompanied by a blank run with an empty pan. The sample mass was lower than 10 mg, whereas the mass of the blank and sample aluminium pans matched within 0.02 mg. The temperature of the samples upon heating was corrected for the thermal lag, determined as average by using different standard materials. This lag was 0.05 min, which, for the heating rates of 2 and 10 K min−1, corresponds to a temperature correction of −0.1 and −0.5 K respectively, whereas for the cooling rates of 2, 5, 10 and 20 K min−1 to corrections of +0.1, +0.25, +0.5 and +1.0 K, respectively.To measure the thermodynamic solid and liquid specific heat capacities (cp,s and cp,l), PBS samples were heated to 150 °C, and maintained at this temperature for 3 min, in order to erase the previous thermal history.56 Then these samples were quickly removed from the DSC apparatus, quenched into liquid nitrogen, and rapidly transferred to the DSC cell maintained at −70 °C. The PBS quenched samples were analysed (i) by conventional DSC from −70 °C to 150 °C at the heating rate of 10 K min−1, to obtain apparent specific heat capacity (cp,app) curves, and (ii) by TMDSC, with a saw-tooth modulation temperature program, at the average heating rate of 2 K min−1, with a temperature amplitude (AT) of 0.5 K and a modulation period (p) of 120 s, to obtain average specific heat capacity (cp,ave) curve and reversing specific heat capacity (cp,rev) curve. According to the mathematical treatment of TMDSC data, the modulated heat flow rate curve can be approximated to discrete Fourier series, and separated into average and periodic components.57,58 The average component is equivalent to the conventional heat flow rate signal under linear temperature program. Thus, the cp,ave curve, calculated from the average heat flow rate at the average heating rate of 2 K min−1, corresponds to cp,app upon linear heating rate of 2 K min−1. Conversely, from the periodic component, the cp,rev curve was obtained, according to the following equation:
 | (1) |
Non-isothermal crystallization of PBS was performed by cooling at the rate of 2, 5, 10, and 20 min−1 down to 25 °C, after fusion for 3 min at 150 °C. Subsequently the samples were cooled quickly to −70 °C, and reheated at 10 K min−1 up to 150 °C. After non-isothermal crystallization at 10 K min−1, also TMDSC runs were performed with a saw-tooth modulation temperature program, at the average heating rate of 2 K min−1, with AT = 0.5 K and p = 60 and 120 s, to obtain cp,ave and cp,rev curves.
X-ray diffraction (XRD) analysis
X-ray diffraction investigation was performed at room temperature (Troom) in reflection mode on PBS samples non-isothermally crystallized at 2, 5, 10 and 20 K min−1, by using a PANalytical X'PertPro diffractometer (Cu Kα radiation, λ = 0.15418 nm; X'Celerator detector). The crystal fraction (XC) was calculated from the ratio Ac/Atot, where Ac is the integrated area of the crystalline diffraction and Atot is the integrated total scattering subtracted by the incoherent scattering. For this purpose, a scan without sample and properly scaled was used for each pattern.In addition, a heating stage Anton Paar TTK450 allowed in situ measurements of PBS samples crystallized at 2 and 5 K min−1, with temperature control of 0.1 K. The samples were heated from Troom at 15 K min−1. At 60, 95 and 105 °C, XRD scans were recorded with acquisition time of 90 s. During the scan collection the temperature ramp was stopped. The average heating rate was about 10 K min−1.
Results and discussion
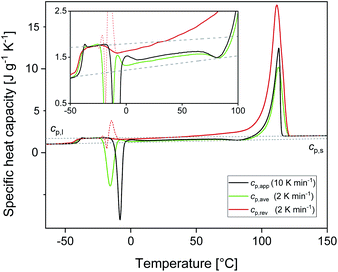
Fig. 1 shows the apparent specific heat capacities (cp,app) of initially amorphous PBS upon heating at 10 K min−1, the average specific heat capacity (cp,ave) and the reversing specific heat capacity (cp,rev) at 2 K min−1, together with the thermodynamic solid and liquid specific heat capacities (cp,s and cp,l) lines, constructed by extrapolating the cp,app and cp,rev data from below the glass transition, and by connecting the region above Tg to the melt, respectively. The derived cp,s and cp,l expressions are: cp,s = 1.22 + 0.0031T and cp,l = 1.79 + 0.0016T, with cp,s and cp,l in J g−1 K−1 and T in °C. The Tg value, determined at half of the cp,app increment, is −40 °C at 10 K min−1, and −42 °C at 2 K min−1. At Tg, the specific heat capacity increment (Δcp,a) is 0.63 J g−1 K−1. According to Wunderlich's “bead theory”,59 the bead number of the PBS repeating unit is 8, which means that each bead contributes to Δcp,a with 13.5 J mol−1 K−1. This value is in excellent agreement with the bead contribution reported for the homologue poly(trimethylene succinate) (13.3 J mol−1 K−1).59At temperatures higher than Tg, the amorphous PBS sample undergoes an intense cold crystallization at temperatures increasing with the heating rate. In parallel with the cold crystallization, the cp,rev curve exhibits an irregular oscillation (red dashed line in Fig. 1), which is an artefact, often occurring in TMDSC analyses upon fast and intense release of latent heat.60 The expected downward step of the cp,rev curve61 (red line in Fig. 1) has been reconstructed by interpolation. At higher temperatures, additional exothermic events occur, most likely connected to crystalline reorganization. The progressive increase in cp,rev observed in conjunction with the exothermic processes, attests that these events follow the temperature modulation, in the sense that both crystallization and fusion take place in the two different semi-periods, respectively. The intense melting peak of the cp,app and cp,ave curves is centred at 113 °C. In the final melting region, cp,rev values higher than cp,app and cp,ave indicate that recrystallization occurs extensively up to complete fusion.
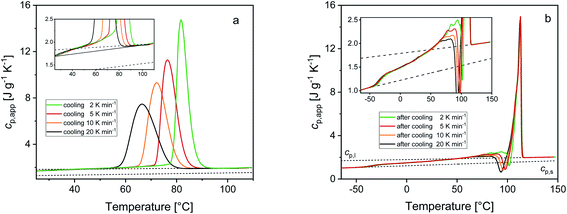
Fig. 2 shows the cp,app curves of PBS samples crystallized upon cooling at different rates and the cp,app curves upon subsequent heating at 10 K min−1. As expected, non-isothermal crystallization (Fig. 2a) shifts to lower temperatures with increasing the cooling rate. The inset of Fig. 2a suggests that crystallization could take place down to 25 °C, although in reduced percentage with respect to the peak (less than 5%). Table 1 lists the peak temperatures of the non-isothermal crystallization process (Tc), and the measured enthalpy of crystallization (Δhc) values, with absolute value progressively decreasing with increasing the heating rate. The cp,app curves upon heating after cooling at different rates (Fig. 2b) exhibit an approximate constant increment at Tg, which means that the solid fraction (crystalline + rigid amorphous fractions) at Tg is independent of the cooling rate. The presence of endothermic and exothermic peaks in the cp,app curves in the temperature range 55–105 °C proves that all the PBS samples undergo significant reorganization/recrystallization processes before final melting, in agreement with literature data.22,62 The shape of the cp,app curves after cooling at the various rates is totally reproducible.
 , mobile amorphous weight fraction at Tg(wMA) and rigid amorphous weight fraction a Tg(wRA) for PBS samples non-isothermally crystallized at different rates (estimated errors: ±0.2 °C for Tc, ±0.4 J g−1 for Δhc, ±0.02 for XC, ±10 J g−1 for
  , ±0.02 for wMA ± 0.04 for wRA)
Calculation of PBS crystallinity from the cp,app curves shown in Fig. 2 requires an accurate value for the enthalpy of melting of 100% crystalline PBS  . Unfortunately, largely scattered
  values are reported in the literature for PBS.4,18,26,63–66 The value of 110 J g−1, attained with the group contribution method described by van Krevelen,67 is often utilized, as well as values included between 200 and 230 J g−1.64–66 To overcome this problem, the crystalline fraction (XC) of the PBS samples cooled at different rates was quantified by XRD analysis. Then, the XC values were linked to the enthalpy of crystallization (Δhc) derived from the cp,app curves (Fig. 2a), to attain, in combination with the temperature dependence of the thermodynamic solid and liquid specific heat capacities, the enthalpy of melting of 100% crystalline PBS as a function of temperature.
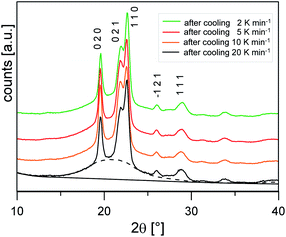
Fig. 3 shows the XRD scans at Troom after cooling at different rates. The profiles show the same set of reflections (the main ones at 2θ values: 19.6°, 21.9°, 22.6°, 26.0°, 28.8°), all ascribable to PBS α-form, the modification that commonly grows from the melt.20 The bell-shaped baseline, connected to the non-ordered regions of the samples, is roughly maintained with similar intensity, suggesting a limited variation of the samples crystallinity.
To confirm that the intense reorganization/recrystallization that occurs upon heating does not involve different crystalline structures, XRD analysis was performed on PBS samples after cooling at 2 and 5 K min−1, at selected temperatures upon heating at the average rate of 10 K min−1. Fig. 4 shows that the XRD profiles registered during heating are all due exclusively to the α-phase. The peak shift towards smaller angles observed as the temperature increases is usual for in situ measurements and it is due to thermal expansion of the unit cell, which causes an expansion of interplanar distances. These observations confirm that reorganization/recrystallization occurring upon heating concerns different crystalline populations or morphologies, without change in crystal form. However, as the transformations involve high latent heat exchanges, important modifications of the crystalline organization are expected. This topic will be investigated in detail in a forthcoming study.
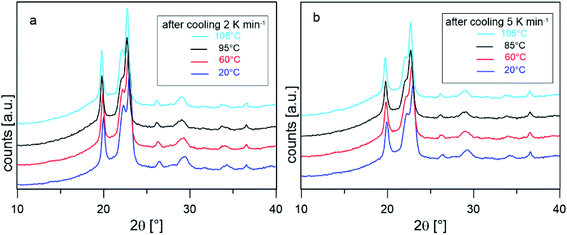 | ||
| Fig. 4 XRD scans collected in situ at the indicated temperature after cooling from the melt at 2 K min−1 (a) and 5 K min−1 (b). | ||
The crystalline fractions XC of the PBS samples crystallized at different rates are reported in Table 1. The slightly higher crystallinity after lower cooling rate is reflected in a slightly higher Tg value (Tg = −33 °C for the sample cooled at 2 K min−1, with respect to Tg = −36 °C for the sample cooled at 20 K min−1). From the experimental Δhc values and the crystal fractions XC, the enthalpies of crystallization of 100% crystalline PBS  at Tc were determined as:
  , being negligible the contribution to Δhc of the crystallization at low temperature. Table 1 shows that the absolute value of
  decreases with decreasing Tc. By taking into account that the enthalpy of melting (Δhm) is equal to −Δhc, the temperature evolution of the enthalpy of melting of 100% crystalline PBS was determined through the relationship:
 | (2) |
 with T in °C was obtained. According to this equation, the enthalpy of melting of 100% crystalline PBS at the melting temperature, which is centered at about 113 °C, is 195 ± 10 J g−1, which confirms the
  values reported in the literature close to 200 J g−1.64–66
From the cp.app increment at Tg (Δcp,app), a mobile amorphous weight fraction (wMA) of 0.37 was calculated for all the samples, as wMA = Δcp,app/Δcp,a. Consequently, the rigid amorphous weight fractions (wRA) at Tg were determined by difference, being XC + wMA + wRA = 1 (see Table 1). The trends exhibited by wRA and in parallel by wC show that the PBS crystals that grow at lower temperatures are coupled with a slightly higher rigid amorphous fraction at Tg.
Rigid amorphous fraction can develop during crystallization, especially at low crystallization temperatures, when the chain mobility is low and the segments arrangements in regular crystalline structures is hindered. But RAF can grow also upon the cooling subsequent to crystallization, due to the progressive reduction in chain mobility and the presence of constraints not completely released in proximity of the crystals. Upon cooling, RAF vitrification occurs in a wide temperature range, depending on the distance from the crystals surfaces and the relative mobility hindrance. The RAF formation is a true vitrification process, because generally mobilization of a RAF portion occurs at the same temperature at which it had previously vitrified upon cooling.50
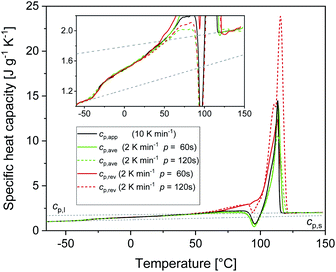
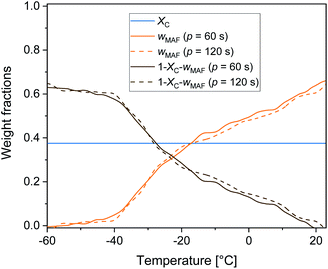
The RAF evolution of PBS at temperatures higher than Tg was determined by a comparison of the cp,app, cp,ave and cp,rev data after cooling at 10 K min−1. Fig. 5 collects the cp,app curves at 10 K min−1, and the cp,ave and cp,rev curves at 2 K min−1 and p = 60 and 120 s. Below Tg and in the temperature range from Tg to about 25 °C, the cp,app and cp,rev curves match within the experimental error. This proves that no reversing latent heat is absorbed or released upon heating from Tg to about 25 °C, which means that up to about 25 °C the cp,app and cp,rev correspond to the thermodynamic specific heat capacity of PBS after cooling at 10 K min−1. At higher temperatures, the reversing heat capacity becomes dependent on the modulation frequency, attesting the beginning of melting/recrystallization processes. From the thermodynamic specific heat capacity cp,rev, the mobile amorphous weight fraction (wMA) was determined as:
 | (3) |
Fig. 6 displays the temperature evolution of wMA and wRA up to about 25 °C, with wRA calculated by difference: wRA = 1 − XC − wMA. Also XC, which is constant up to about 25 °C is displayed. It is worth noting that below Tg the mobile amorphous fraction is vitrified, wMA = 0, so that (1 − XC − wMA) corresponds to the entire amorphous fractions wMA + wRA. The rigid amorphous weight fraction in PBS is approximately 0.25 at Tg, and decreases with increasing temperature, becoming zero in proximity of 25 °C This means that at Troom RAF is absent in PBS. This should be true also after different crystallization conditions, because the cp,app curves after solidification at different cooling rates were found perfectly overlapping up to about 50 °C (Fig. 2b). As a consequence of the RAF devitrification, the mobile amorphous fraction in parallel increases. At temperatures higher than about 25 °C, melting and recrystallization of imperfect crystals contributes to cp,rev, reversing latent heat is exchanged and, consequently, correct wMA values cannot be obtained through eqn (3). However, the beginning of the melting certainly produces a further MAF increase.
Conclusions
An accurate thermal characterization of PBS semi-crystalline samples has allowed to quantify the temperature evolution of the rigid amorphous fraction and the temperature dependence of the enthalpy of melting of 100% crystalline PBS. The rigid amorphous weight fraction in PBS is about 0.25 at Tg. It decreases with increasing temperature and becomes zero around 25 °C. Thus, at Troom and at the human body temperature, in case of biomedical applications, RAF is absent in PBS.This information is important for a detailed characterization of this biopolymer, by considering the peculiar physical properties of the rigid amorphous fraction, in particular mechanical and permeability properties, which are different from those of the mobile amorphous fraction. It is worth pointing out that an appropriate interpretation of the properties of semi-crystalline polymers as a function of the RAF amount has to be performed by taking into account the true rigid amorphous percentage at the temperature of interest, and not the RAF calculated at Tg.
In addition, it is useful to point out that in case of chemical modification of PBS, for example through copolymerization, changes in the amorphous segments mobility are expected, not only in the MAF region, i.e. far from the crystal surface, but also in proximity of the crystals, as a consequence of inclusion or, more often, rejection of the co-monomers from the crystal lattice. This could produce different temperature evolution of the RAF, so that the presence of rigid amorphous fraction at Troom could be tuned by proper co-monomer addition.
Author contributions
Maria Cristina Righetti: conceptualization, methodology, investigation, formal analysis, writing – original draft, writing – review & editing. Maria Laura Di Lorenzo: formal analysis, writing – review & editing. Patrizia Cinelli: resources, writing – review & editing. Massimo Gazzano: investigation, formal analysis, writing – review & editing.Conflicts of interest
There are no conflicts to declare.References
- P. C. Lee, W. G. Lee, Y. Lee and H. N. Chang, Biotechnol. Bioeng., 2001, 72, 41–48 CrossRef CAS PubMed.
- K.-K. Cheng, X.-B. Zhao, J. Zeng and J.-A. Zhang, Biofuels. Bioprod. Biorefin., 2012, 6, 302–318 CrossRef CAS.
- S. D. Le and S. Nishimura, ACS Sustainable Chem. Eng., 2019, 22, 18483–18492 CrossRef.
- J. Xu and B.-H. Guo, Biotechnol. J., 2010, 5, 1149–1163 CrossRef CAS PubMed.
- M. Gigli, M. Fabbri, N. Lotti, R. Gamberini, B. Rimini and A. Munari, Eur. Polym. J., 2016, 75, 431–460 CrossRef CAS.
- S.-R. Lee, H.-M. Park, H. Lim, T. Kang, X. Li and W.-J. Cho, Polymer, 2002, 43, 2495–2500 CrossRef CAS.
- S. Mallardo, V. De Vito, M. Malinconico, M. G. Volpe, G. Santagata and M. L. Di Lorenzo, Eur. Polym. J., 2016, 79, 82–96 CrossRef CAS.
- H. Li, J. Chang, A. Cao and J. Wang, Macromol. Biosci., 2005, 5, 433–440 CrossRef CAS PubMed.
- D. F. Coutinho, I. H. Pashkuleva, C. M. Alves, A. P. Marques, N. M. Neves and R. L. Reis, Biomacromolecules, 2008, 9, 1139–1145 CrossRef CAS PubMed.
- P. Hariraksapitak, O. Suwantong, P. Pavasant and P. Supaphol, Polymer, 2008, 49, 2678–2685 CrossRef CAS.
- H. Wang, J. Ji, W. Zhang, W. Wang, Y. Zhang, Z. Wu, Y. Zhang and P. K. Chu, Acta Biomater., 2010, 6, 154–159 CrossRef CAS PubMed.
- H. Wang, M. Xu, Z. Wu, W. Zhang, J. Ji and P. K. Chu, ACS Appl. Mater. Interfaces, 2012, 4, 4380–4386 CrossRef CAS PubMed.
- I. Grigoriadou, N. Nianias, A. Hoppe, Z. Terzopoulou, D. Bikiaris, J. Will, J. Hum, J. Roether, R. Detsch and A. Boccaccini, Compos. B Eng., 2014, 60, 49–59 CrossRef CAS.
- S. A. Rafiqah, A. Khalina, A. S. Harmaen, I. A. Tawakkal, K. Zaman, M. Asim, M. N. Nurrazi and C. H. Lee, Polymers, 2021, 13, 1436 CrossRef CAS PubMed.
- S. Su, R. Kopitzky, S. Tolga and S. Kabasci, Polymers, 2019, 11, 1193 CrossRef PubMed.
- M. L. Di Lorenzo, Polym. Rev., 2020 DOI:10.1080/15583724.2020.1850475.
- P. Ma, D. G. Hristova-Bogaerds, P. J. Lemstra, Y. Zhang and S. Wang, Macromol. Mater. Eng., 2012, 297, 402–410 CrossRef CAS.
- Y. J. Phua, A. Pegoretti, T. Medeiros Araujo and Z. A. Mohd Ishak, J. Appl. Polym. Sci., 2015, 132, 42815 CrossRef.
- M. Z. Pang, J. J. Qiao, J. Jiao, S. J. Wang, M. Xiao and Y. Z. Meng, J. Appl. Polym. Sci., 2008, 107, 2854–2860 CrossRef CAS.
- K. J. Ihn, E. S. Yoo and S. S. Im, Macromolecules, 1995, 28, 2460–2464 CrossRef CAS.
- Y. Ichikawa, H. Kondo, Y. Igarashi, K. Noguchi, K. Okuyama and J. Washiyama, Polymer, 2000, 41, 4719–4727 CrossRef CAS.
- D. G. Papageorgiou, E. Zhuravlev, G. Z. Papageorgiou, D. Bikiaris, K. Chrissafis and C. Schick, Polymer, 2014, 55, 6725–6734 CrossRef CAS.
- B. Wunderlich, Prog. Polym. Sci., 2003, 28, 383–450 CrossRef CAS.
- M. L. Di Lorenzo and M. C. Righetti, Polym. Crystallization, 2018, 1, e10023 CrossRef.
- F. Signori, M. Pelagaggi, S. Bronco and M. C. Righetti, Thermochim. Acta, 2012, 543, 74–81 CrossRef CAS.
- S. Charlon, L. Delbreilh, E. Dargent, N. Follain, J. Soulestin and S. Marais, Eur. Polym. J., 2016, 84, 366–376 CrossRef CAS.
- M. L. Di Lorenzo, R. Androsch and M. C. Righetti, Eur. Polym. J., 2017, 94, 384–391 CrossRef CAS.
- R. Rastogi, W. P. Vellinga, S. Rastogi, C. Schick and H. E. H. Meijer, J. Polym. Sci., Part B: Polym. Phys., 2004, 42, 2092–2210 CrossRef CAS.
- P. J. Veld, M. Hütter and G. C. Rutledge, Macromolecules, 2006, 39, 439–447 CrossRef.
- M. L. Di Lorenzo and M. C. Righetti, Polymer, 2008, 49, 1323–1331 CrossRef CAS.
- M. C. Righetti, L. Aliotta, N. Mallegni, M. Gazzano, E. Passaglia, P. Cinelli and A. Lazzeri, Front. Chem., 2019, 7, 790 CrossRef CAS.
- L. Aliotta, M. Gazzano, A. Lazzeri and M. C. Righetti, ACS Omega, 2020, 5, 20890–20902 CrossRef CAS PubMed.
- J. Lin, S. Shenogin and S. Nazarenko, Polymer, 2002, 43, 4733–4743 CrossRef CAS.
- M. Drieskens, R. Peeters, J. Mullen, D. Franco, P. J. Lemstra and D. G. Hristova-Bogaerds, J. Polym. Sci. Polym. Phys., 2009, 47, 2247–2258 CrossRef CAS.
- S. Fernandes Nassar, A. Guinault, N. Delpouve, V. Divry, V. Ducruet, C. Sollogoub and S. Domenek, Polymer, 2017, 108, 163–172 CrossRef CAS.
- R. J. Lang, W. L. Merling and D. S. Simmons, ACS Macro Lett., 2014, 3, 758–762 CrossRef CAS.
- R. Y. F. Liu, T. E. Bernal-Lara, A. Hiltner and E. Baer, Macromolecules, 2005, 38, 4819–4827 CrossRef CAS.
- D. S. Simmons, Macromol. Chem. Phys., 2016, 217, 137–148 CrossRef CAS.
- C. G. Robertson, T. E. Hogan, M. Rackaitis, J. E. Puskas and X. Wang, J. Chem. Phys., 2010, 132, 104904 CrossRef CAS PubMed.
- M. Z. Slimani, A. J. Moreno, G. Rossi and J. Colmenero, Macromolecules, 2013, 46, 5066–5079 CrossRef CAS.
- F. W. Starr, T. B. Schrøder and S. C. Glotzer, Phys. Rev. E - Stat. Nonlinear Soft Matter Phys., 2001, 64, 21802 CrossRef CAS PubMed.
- A. Bansal, H. Yang, C. Li, K. Cho, B. C. Benicewicz, S. K. Kumar and L. S. Schadler, Nat. Mater., 2005, 4, 693–698 CrossRef CAS PubMed.
- A. Sargsyan, A. Tonoyan, S. Davtyan and C. Schick, Eur. Polym. J., 2007, 43, 3113–3127 CrossRef CAS.
- A. Papon, H. Montes, M. Hanafi, F. Lequeux, L. Guy and K. Saalwächter, Phys. Rev. Lett., 2012, 108, 65702 CrossRef PubMed.
- A. Wurm, M. Ismail, B. Kretzschmar, D. Pospiech and C. Schick, Macromolecules, 2010, 43, 1480–1487 CrossRef CAS.
- Q. Ma and P. Cebe, J. Therm. Anal. Calorim., 2010, 102, 425–434 CrossRef CAS.
- Q. Ma, B. Mao and P. Cebe, Polymer, 2011, 52, 3190–3200 CrossRef CAS.
- D. Cangialosi, V. M. Boucher, A. Alegria and J. Colmenero, Soft Matter, 2013, 9, 8619–8630 RSC.
- J. Leng, N. Kang, D.-Y. Wang, A. Wurm, C. Schick and A. Schonhals, Polymer, 2017, 108, 257–264 CrossRef CAS.
- M. C. Righetti, D. Prevosto and E. Tombari, Macromol. Chem. Phys., 2016, 217, 2013–2026 CrossRef CAS.
- M. L. Di Lorenzo, M. C. Righetti and B. Wunderlich, Macromolecules, 2009, 42, 9312–9320 CrossRef CAS.
- M. C. Righetti, E. Tombari and M. L. Di Lorenzo, J. Phys. Chem. B, 2013, 117, 12303–12311 CrossRef CAS PubMed.
- M. C. Righetti, M. Laus and M. L. Di Lorenzo, Eur. Polym. J., 2014, 58, 60–68 CrossRef CAS.
- M. C. Righetti and M. L. Di Lorenzo, J. Therm. Anal. Calorim., 2016, 126, 521–530 CrossRef CAS.
- S. M. Sarge, W. Hemminger, E. Gmelin, G. W. H. Höhne and H. K. Cammenga, J. Therm. Anal., 1997, 49, 1125–1134 CrossRef CAS.
- L. Sangroniz, C. Ocando, D. Cavallo and A. J. Müller, Polymers, 2020, 12, 2796 CrossRef CAS PubMed.
- A. Wurm, M. Merzlyakov and C. Schick, Colloid Polym. Sci., 1998, 276, 289–296 CrossRef CAS.
- R. Androsch, I. Moon, S. Kreitmeier and B. Wunderlich, Thermochim. Acta, 2000, 357–358, 267–278 CrossRef CAS.
- B. Wunderlich, Thermal Analysis of Polymeric Materials, Springer-Verlag, Berlin Heidelberg, 2005 Search PubMed.
- M. L. Di Lorenzo and B. Wunderlich, J. Therm. Anal. Calorim., 1999, 57, 459–472 CrossRef CAS.
- M. C. Righetti, Materials, 2017, 10, 442 CrossRef PubMed.
- J. Jiang, E. Zhuravlev, W. Hu, C. Schick and D. Zhou, Chin. J. Polym. Sci., 2017, 35, 1009–1019 CrossRef CAS.
- V. M. Correlo, L. F. Boesel, M. Bhattacharya, J. F. Mano, N. M. Neves and R. L. Reis, Mater. Sci. Eng., A, 2005, 403, 57–68 CrossRef.
- Z. Gan, H. Abe, H. Kurokawa and Y. Doi, Biomacromolecules, 2001, 2, 605–613 CrossRef CAS PubMed.
- T. Miyata and T. Masuku, Polymer, 1998, 39, 1399–1404 CrossRef CAS.
- G. Z. Papageorgiou and D. N. Bikiaris, Polymer, 2005, 46, 12081–12092 CrossRef CAS.
- D. W. Van Krevelen and K. te Nijenhuis, Properties of Polymers, 4th edn, Elsevier, Amsterdam, 2009 Search PubMed.
| This journal is © The Royal Society of Chemistry 2021 |

