 Open Access Article
Luminescence method for detection of aflatoxin B1 using ATP-releasing nucleotides†
Dongyue Hu‡
a,
Shusen Xiao‡b,
Qiaqia Guob,
Rongrong Yueb,
Demin Genga and
Debin Ji *b
*b
aCollege of Chemistry and Chemical Engineering, Qingdao University, Qingdao, 266071, PR China
bInstitute of Molecular Sciences and Engineering, Institute of Frontier and Interdisciplinary Science, Shandong University, Qingdao, 266237, PR China. E-mail: debinji@sdu.edu.cn
First published on 7th July 2021
Abstract
Determination of aflatoxin B1 (AFB1) is still a big issue in food safety. In this paper, we developed a luminescence AFB1 detection method combined with ATP-releasing nucleotides (ARNs) and AFB1 aptamer. Firstly, using a new coupling method, we synthesized two ARNs (dTP4A and dGP4A) in a yield of 67% and 58%, respectively. The newly prepared ARNs show a much lower background. Then, we developed a new isothermal polymerase amplification method. In this method, two DNA hairpins were used to substitute the circle DNA template in rolling circle amplification. Using this amplification method and combined with AFB1 aptamer, a new AFB1 detection method is developed. A detection limit as low as 0.3 pM is achieved. This method is simple and efficient, and will have a great potential to be used for food safety and public health.
1. Introduction
Aflatoxin B1, one of the most toxic natural chemicals, widely exists in nature. It has the potential to contaminate food, such as soybeans, peanuts, corn, and grain oils.1–3 Because of its widespread existence and strong toxicity, it causes a great health problem to humans. Therefore, in order to avoid food safety problems caused by AFB1, developing a stable, reliable, and highly sensitive detection method is highly in need. At present, many kinds of methods for detecting AFB1 have been developed, such as high performance liquid chromatography (HPLC),4,5 liquid chromatography-mass spectrometry (LC-MS),6,7 and chemiluminescence methods.8 Although the above methods are sensitive and accurate, the cost of the detection equipment required is relatively high, and these methods must be operated by professionals under laboratory environment conditions. For the immunoassay method,9,10 it requires the corresponding antibody of AFB1, however, the antibody needs very harsh storage conditions. The aptamer also has high affinity for the target molecules, but is much easier to label and store. Aptamers, artificially synthesized single-stranded oligonucleotides, have been widely used in the field of analysis and sensing.11,12 Researchers have designed a large number of sensing methods based on AFB1 aptamer, such as the fluorescence method,13 electrochemical method14,15 and luminescence method.16–20 Among all of these, the luminescence methods do not need an external excitation light source, therefore, a handhold small detection equipment is possible based on this detection method. However, the signal in the traditional luminescence sensor system is relatively weak and the sensitivity is also quite low.21 The developing of a new sensitive AFB1 luminescence detection method is still in need.To increase the detection sensitivity, one best choice is link the target with nucleic acid amplification technology. Several nucleic acid amplification method have been developed, such as polymerase chain amplification reaction (PCR),22 hybrid chain reaction amplification,23,24 rolling circle amplification (RCA),25,26 strand displacement amplification.27,28 RCA is an isothermal method using a short DNA primer to amplify a circular DNA template. Among them, RCA is the most common method and has been used to develop several sensitive detection methods for a variety of targets including nucleic acids and small molecules. However, for this method, a circular DNA template is needed for every specific target, and this process always take a long time and have a low yield.29 Developing a new DNA polymerase amplification method to avoid of using the circular DNA template is in need.
To generate illuminescence signal from nucleic acid amplification, one way is using the ATP-releasing nucleotides (ARNs).30 ARNs are chimeric nucleoside tetraphosphate dimers in which ATP rather than pyrophosphate, is the leaving group during the DNA amplification. The generated ATP can react with luciferase and produce luminescence signal with high sensitivity and specificity. However, the former synthesis method using ATP as the starting material can introduce some tiny amount of ATP to the final product ARNs.30 The tiny ATP will increase the detection background. To meet this challenge, we plan to prepare ARNs by coupling of adenosine monophosphate (AMP) with deoxyribonucleoside triphosphates (dNTPs). In this paper, we first get a new method to synthesis ARNs without of using ATP as the starting material. And then, using ARNs, we developed a new luminescence method to detect a target nucleic acid. Based on this method, a new sensitive AFB1 luminescence detection method is developed.
2. Experimental section
2.1 Materials and instruments
The nucleotides (dGTP and dATP disodium salts) were purchased from Solarbio Science & Technology Co., Ltd. (Beijing, China). AMP was purchased from Sinopharm Chemical Reagents Co., Ltd. (Shanghai, China). Dimethylformamide (DMF) and Dowex-50W ion exchange resin were purchased from Acros Organics. Carbonyldiimidazole (CDI) was purchased from Sigma Aldrich. Klenow fragment DNA polymerase exo− was purchased from New England Biolabs (Beijing, China). ATP determination kit (Kinase Glo) was purchased from Promega (Beijing, China). Streptavidin-labeled magnetic beads was purchased from PuriMag Biotech (Xiamen, China). The oligonucleotides were synthesized by Sangon Biotech Co., Ltd. (Shanghai, China) and purified by HPLC. The DNA sequences are listed in Table S2.† The luminescence signal was measured by the multimode reader (BioTek, USA). NMR spectra including 1H NMR, and 31P NMR were recorded on a Bruker Ascend-600 spectrometer.2.2 Synthesis of ARNs
We synthesized ARNs by covalently linked dNTP with AMP in one step. The detail of the reaction was showed in the ESI.† ARNs was obtained in a yield of 50–60% after purification by RP-HPLC.2.3 Fabrication of the biosensor of AFB1
Firstly, the aptamer modified with biotin (1 μL, 2 μM) were incubated with T-DNA (1 μL, 2 μM) in PBS buffer (10 μL, 10 mM) and deionized water (8 μL). This mixture was heated to 80 °C for 2 min and cooled to room temperature. Then, the mixture was incubated with streptavidin-modified magnetic beads (MBs, 10 μL, 10 mg mL−1) at room temperature to shake slowly for 30 min. Next, the free state aptamer unlinked to the surface of MBs were separated with MBs/aptamer complex by magnetic field. Finally, the obtained MBs/aptamer complex was dispersed in buffer solution for further use.2.4 The detection of AFB1
Firstly, the different concentrations of AFB1 standard solution (1 μL) were mixed with the above prepared magnetic beads modified with oligonucleotides (19 μL, 5 mg mL−1) and incubated for 30 min at room temperature. After magnetic separation, the supernatant was transferred to a centrifuge tube which contains HP1 (100 nM), HP2 (100 nM), Klenow fragment (3′→5′ exo−) 5 U, dGP4A (20 μM), dTP4A (20 μM), dATP (20 μM), dCTP (20 μM). Finally, the mixture was incubated for 1.5 h at 37 °C, and 5 μL of reaction solution was mixed with luciferase detection buffer in a 384 well plate. The bioluminescence signal was recorded at 1 min intervals over 30 min by multimode reader.2.5 Detection of AFB1 in the real samples
To test the feasibility and practicability of the strategy, we determined the AFB1 in the peanuts and corns which purchased from the local farmers markets. After fully crushed, the peanuts or corns samples accurately weighed of 3 g and then extracted with 30 mL of methanol![[thin space (1/6-em)]](https://www.rsc.org/images/entities/char_2009.gif) :
:![[thin space (1/6-em)]](https://www.rsc.org/images/entities/char_2009.gif) water (4
water (4![[thin space (1/6-em)]](https://www.rsc.org/images/entities/char_2009.gif) :
:![[thin space (1/6-em)]](https://www.rsc.org/images/entities/char_2009.gif) 1, v/v) for 30 min through ultrasonic treatments. At last, the extracts were centrifuged at 10
1, v/v) for 30 min through ultrasonic treatments. At last, the extracts were centrifuged at 10![[thin space (1/6-em)]](https://www.rsc.org/images/entities/char_2009.gif) 000 rpm for 20 min and the supernatant was collected, and diluted 5 fold with ultrapure water to different standard concentrations for the detection of AFB1 content using our synthetic probe.
000 rpm for 20 min and the supernatant was collected, and diluted 5 fold with ultrapure water to different standard concentrations for the detection of AFB1 content using our synthetic probe.
3. Results and discussion
3.1 Synthesis of the ARNs probe
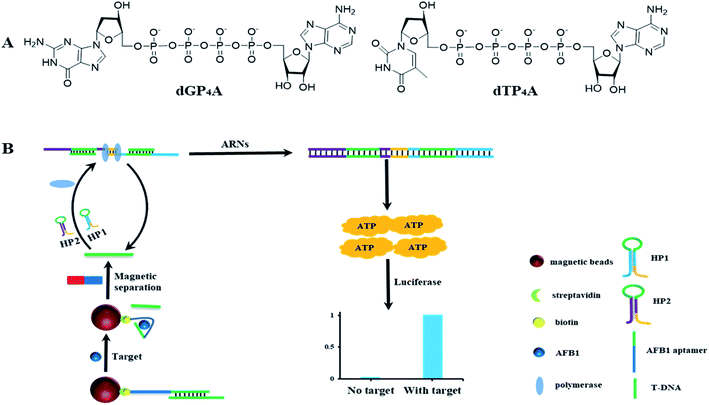
In the former paper, ARNs was prepared using ATP as the starting material.30 However, even after several separation, tiny amount of ATP still introduces to the final product. The tiny amount of ATP will increase the background signal and decrease the detection sensitivity. In order to solve this problem, we proposed a new method to synthesize the nucleotide probe ARNs by coupling of adenosine monophosphate (AMP) with deoxyribonucleoside triphosphates (dNTPs) (Fig. 1A). This method avoid of using ATP and is supposed to decrease the background signal. Using this method, we synthesized two ARNs (dGP4A and dTP4A) in a yield of 67% and 58%, respectively. Furthermore, we conducted a quantitative test about the background signal value of ARNs, and the results were shown in Table S1.† The result shows that the background signal is only 0.4% (dGP4A) and 0.2% (dTP4A) compared with ATP. The background signal decreased about 4 times than the former method.303.2 The detection strategy of AFB1
The detection strategy for AFB1 is shown in Fig. 1B. The AFB1 aptamer was immobilized on the MBs surface and then hybridized with T-DNA to form a DNA duplex. In the presence of AFB1, aptamer select to bind with AFB1 and corresponding amount of T-DNA is released to the solution. After magnetic separation, the released T-DNA is leave in supernatant. The amount of AFB1 can be calculated by detection of the released T-DNA. In order to detect T-DNA, a new DNA polymerase amplification method is developed. Basically, two DNA hairpins HP1 and HP2 are designed, in which the green part of HP1 or HP2 can hybridize with T-DNA. After hybridized with T-DNA, the two hairpins are opened. The yellow parts of hairpins (3′ end) can hybridize to each other and act as primers for polymerization. The DNA polymerase amplification can be initiated in both directions, and get the full length double strand DNA sequence. In theory, 57 molecules of ATP are released for the generation of one full length double strand DNA sequence. And at the same time, the T-DNA is released to initiate the next round of polymerase reactions. In this DNA polymerase amplification method, the two DNA hairpins can make the DNA polymerase reaction keep on running, and get the same result as RCA. This method avoids of using the circular DNA template and have a potential to be used in developing other nucleic acid detection methods. Using the high sensitive ATP detection kit, tiny amount of released T-DNA could be detected.3.3 Study the feasibility of the detection method
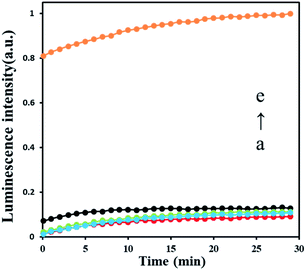
To test the feasibility of AFB1 detection strategy, we set several experiments in different condition as shown in Fig. 2. The result shows that only tiny luminescence signal were recorded in the absence of Klenow fragment exo− (a red curve), DNA hairpin HP1 (b blue curve) and HP2 (c green curve) which means no polymerase amplification happened. After adding 30 nM AFB1, a significant strong luminescence signal produced (e yellow curve), indicating that polymerase amplification processes are triggered, and ATP is released by the polymerase. The results prove that all elements in this sensing strategy are indispensable, and this strategy can be used in AFB1 detection.3.4 Study of the sensitivity of ABF1 detection method
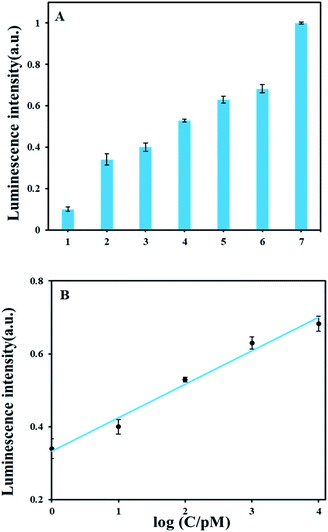
As shown in Fig. 3A, we tested the luminescence response of a series of AFB1 concentrations ranging from 0 pM to 30 nM. Luminescence detection showed signals of 1 pM AFB1 is obviously above background. In Fig. 3B, the luminescence intensity had a good linear correlation with AFB1 concentrations from 1 pM to 10 nM and the calibration equation of AFB1 and luminescence intensity is y = 0.0915x + 0.3332 (y: luminescence intensity; x: the logarithmic value of the AFB1 concentration value, pM) with the correlation coefficient of 0.9913. The detection limit of AFB1 is 0.3 pM according to the definition 3σ/slope (σ, standard deviation of corresponding the blank sample; slope, the slope of corresponding calibration equation). A comparison with other reported methods (Table S3†) demonstrates that our method has relatively high detection sensitivity.3.5 Study of specificity of ABF1 detection method
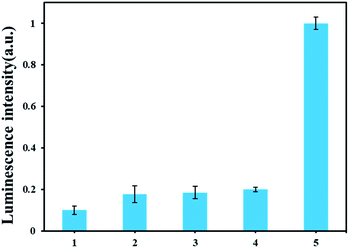
To investigate the specific analysis for detection of AFB1, its analogues, such as AFB2, AFG1 and AFG2 were tested. As displayed in Fig. 4 A, an obvious difference of the luminescence response between AFB1 and other analogues. Only AFB1 can trigger the polymerase reaction in this experiment. The results proved that our method has excellent performance for discriminating AFB1 from other interfering substrate. | ||
| Fig. 4 Selectivity of the ARNs based AFB1 detection method. From 1 to 5 are blank, AFB2, AFG1, AFG2, AFB1. The concentrations of the AFB1 and its analogues are all 30 nM. | ||
3.6 Detection of AFB1 in real samples
In order to test the practical application of this method, we analysed and verified the content of aflatoxin B1 (AFB1) in real samples (peanuts and corns from local market). AFB1 were extracted according to processes described in experiment section. Artificially contaminated real samples were prepared by spiking the AFB1 concentrations of 10 nM into AFB1free samples. The experimental results are shown in Table 1. And the recovery ratios were from 98.7% to 109.5% which implied that the proposed sensor could be applied to the quantitative determination of AFB1 in agricultural commodities samples.| Sample | Spiked (nM) | Results (nM) | Recovery rate (%) |
|---|---|---|---|
| Peanut | 10 | 9.87 | 98.7 |
| Corn | 10 | 10.95 | 109.5 |
4. Conclusions
In summary, we developed a new luminescence AFB1 detection method based on ARNs and AFB1 aptamer. We synthesized ARNs (dTP4A and dGP4A) using a new coupling method and the background signal decreased about 4 times compared with the former one. We developed a new isothermal polymerase amplification method avoid of using circle DNA template in RCA. In theory, any short nucleic acid can be detected by this method. Combined with AFB1 aptamer, we developed a new AFB1 detection method. A detection limit as low as 0.3 pM is achieved. This method show a high sensitivity and high selectivity, will have a great potential to be used on food safety and public health.Conflicts of interest
The authors declare no competing financial interest.Acknowledgements
The authors gratefully acknowledge the financial from the National Natural Science Foundation of China (21977062), the Special Funds of the Taishan Scholar Program of Shandong Province (tsqn201812053). We would like to thank Jingyao Qu, Jing Zhu and Zhifeng Li from State Key laboratory of Microbial Technology of Shandong University for help and guidance in LC-MS and NMR.References
- M. Hove, C. V. Poucke and E. Njumbe-Ediage, et al., Food Control, 2016, 59, 675–682 CrossRef CAS.
- N. M. Danesh, H. B. Bostan and K. Abnous, et al., TrAC, Trends Anal. Chem., 2018, 99, 117–128 CrossRef CAS.
- H. K. Abbas, J. R. Wilkinson and R. M. Zablotowicz, et al., Toxin Rev., 2009, 28, 142–153 CrossRef CAS.
- S. Tsuboi, T. Nakagawa and M. Tomita, et al., Cancer Res., 1984, 44, 1231–1234 CAS.
- S. M. Herzallah, Food Chem., 2009, 114, 1141–1146 CrossRef CAS.
- N. Zitomer, M. E. Rybak and Z. Li, et al., J. Agric. Food Chem., 2015, 63, 9131–9138 CrossRef CAS PubMed.
- W. A. Abia, B. Warth and M. Sulyok, et al., Food Control, 2013, 31, 438–453 CrossRef CAS.
- W. Chen and D. Xing, Proc. SPIE, 2005, 128–135 CrossRef CAS.
- A. Sasan, M. Nejad and M. S. Ghannad, et al., Toxin Rev., 2014, 33, 151–154 CrossRef.
- J. Li, X. Zhao and L. J. Chen, et al., Anal. Chem., 2019, 91, 13191–13197 CrossRef CAS.
- M. R. Dunn, R. M. Jimenez and J. C. Chaput, Nat. Rev. Chem., 2017, 1, 1–16 CrossRef.
- M. R. Gotrik, T. A. Feagin and A. T. Csordas, et al., Acc. Chem. Res., 2016, 49, 1903–1910 CrossRef CAS PubMed.
- L. Chen, F. Wen and M. Li, et al., Food Chem., 2017, 215, 377–382 CrossRef CAS.
- C. X. Zhu, D. Liu and Y. Y. Li, et al., Biosens. Bioelectron., 2021, 174, 112654 CrossRef CAS.
- G. Peng, X. Y. Li and F. Cui, et al., ACS Appl. Mater. Interfaces, 2018, 10, 17551–17559 CrossRef CAS PubMed.
- M. Hosseini, H. Khabbaz and M. Dadmehr, et al., Acta Chim. Slov., 2015, 62, 721–728 CrossRef CAS PubMed.
- L. L. Sun and Q. Zhao, Talanta, 2017, 179, 344–349 CrossRef.
- M. Hosseini, H. Khabbaz and M. Dadmehr, et al., Acta Chim. Slov., 2015, 62, 721–728 CrossRef CAS.
- W. B. Shim, H. Mun and H. A. Joung, et al., Food Control, 2014, 36, 30–35 CrossRef CAS.
- Y. Yao, H. Wang and X. Wang, et al., Talanta, 2019, 201, 52–57 CrossRef CAS.
- W. B. Shim, H. Mun and H. A. Joung, et al., Food Control, 2014, 36, 30–35 CrossRef CAS.
- J. Li, B. Yao and H. Huang, et al., Anal. Chem., 2009, 81, 5446–5451 CrossRef CAS PubMed.
- M. Oishi, Anal. Bioanal. Chem., 2015, 407, 4165–4172 CrossRef CAS.
- E. E. Augspurger, M. Rana and M. V. Yigit, ACS Sens., 2018, 3, 878–902 CrossRef CAS.
- M. M. Ali, F. Li and Z. Q. Zhang, et al., Chem. Soc. Rev., 2014, 43, 3324–3341 RSC.
- P. M. Lizardi, X. H. Huang and Z. G. Zhu, et al., Nat. Genet., 1998, 19, 225–232 CrossRef CAS PubMed.
- F. B. Dean, S. Y. Hosono and L. H. Fang, et al., Proc. Natl. Acad. Sci. U. S. A., 2002, 99, 5261–5266 CrossRef CAS PubMed.
- G. T. Walker, M. C. Little and J. G. Nadeau, et al., Proc. Natl. Acad. Sci. U. S. A., 1992, 89, 392–396 CrossRef CAS PubMed.
- M. M. Ali, F. Li and Z. Zhang, et al., Chem. Soc. Rev., 2014, 43, 3324–3341 RSC.
- D. Ji, M. G. Mohsen and E. M. Harcourt, et al., Angew. Chem., Int. Ed., 2016, 128, 2127–2131 CrossRef.
Footnotes |
| † Electronic supplementary information (ESI) available: General information, experimental procedures, copies of 1H and 31P NMR spectra for products. See DOI: 10.1039/d1ra03870b |
| ‡ Dongyue Hu and Shusen Xiao contributed equally for this research. |
| This journal is © The Royal Society of Chemistry 2021 |


