 Open Access Article
Construction of a lysosome-targetable ratiometric fluorescent probe for H2O2 tracing and imaging in living cells and an inflamed model†
Rongrong Zhou‡
bf,
Qiyao Peng‡a,
Dan Wan‡b,
Chao Yua,
Yuan Zhanga,
Yi Houa,
Quan Luod,
Xiong Lie,
Shuihan Zhangb,
Lin Xie*a,
Pinghua Ou*c and
Yongbo Peng *ab
*ab
aChongqing Key Laboratory for Pharmaceutical Metabolism Research, College of Pharmacy, The First Affiliated Hospital, Chongqing Medical University, Chongqing, 400016, China. E-mail: 992934546@qq.com; pengyongbo2000@126.com
bInstitute of Chinese Materia Medica, The Affiliated Hospital, Hunan Academy of Chinese Medicine, Hunan University of Chinese Medicine, Changsha 410013, China
cDepartment of Stomatology, The Third Xiangya Hospital, Central South University, Changsha 410013, China. E-mail: myhuahua07@163.com
dDepartment of Rehabilitation, Hunan Provincial People's Hospital, The First Affiliated Hospital of Hunan Normal University, Changsha 410000, China
eSchool of Clinical Pharmacy, The First Affiliated Hospital, Guangdong Pharmaceutical University, Guangzhou 510006, China
fCollege of Pharmacy, Changchun University of Chinese Medicine, Changchun 130117, China
First published on 7th July 2021
Abstract
Hydrogen peroxide (H2O2), an important reactive oxygen species (ROS) with unique destructive oxidation properties, can be produced in lysosomes to fight off pathogens. Although many fluorescent probes have been developed for the detection and imaging of H2O2, the development of a ratiometric fluorescent probe for H2O2 detection and imaging in lysosomes and an inflammation model remains rather scarce. Therefore, it is important to develop an efficient tool for monitoring H2O2 in inflamed tissues to evaluate the physiological and pathological relationship between inflammation and lysosomal H2O2. In this work, a new naphthalimide-based lysosome-targeting fluorescent probe (NPT-H2O2) for ratiometric detection and imaging was developed in vitro and in vivo. The probe exhibited two well-resolved emission peaks separated by 125 nm, rapid response (<40 s), and high selectivity and sensitivity toward H2O2, as well as low cytotoxicity in vitro. Inspired by prominent features of these results, we further successfully applied NPT-H2O2 for H2O2 imaging with a dual-channel in living cells, demonstrating that our probe NPT-H2O2 was targeted in the lysosomes. Finally, NPT-H2O2 was used for H2O2 detection in inflamed tissues and achieved satisfactory results. We predict that our probe can be used as a powerful tool to reveal the relationship between physiology and pathology of inflammation and lysosomal H2O2.
Introduction
Reactive oxygen species (ROS), involving hydrogen peroxide (H2O2), can be produced through cellular respiration and can regulate the original stability of various physiological processes by varieties of homeostatic mechanisms, and have attracted more and more attention in many intersecting fields such as chemistry and biology.1–3 The abnormal production and accumulation level of ROS were closely associated with many factors, such as inflammation, aging, cell signal transduction pathways disturbance, cancer, etc.4,5 Among them, H2O2 is undoubtedly the most important one, because it acts as a destructive oxidant to resist pathogens or as a fine-tuned second messenger for dynamic cellular signaling pathways. Modern biomedical research showed that H2O2 can damage a wide variety of biomacromolecules including DNA, RNA, and proteins,6,7 and excessive H2O2 could cause cell damage, disorders and even death, thereby causing a series of related diseases, such as Alzheimer's, Parkinson's, Huntington's diseases, and even cancer.8–12 In addition, lysosomes are acidic vesicles (pH 4.5–5.5) that contain various enzymes related to physiological and pathological processes,13,14 and modern biomedical studies have shown that ROS can permeabilize lysosomal membranes to cause cell death.15–17 It is therefore, developing a suitable tool and method for detecting and imaging lysosomal H2O2 in biosystems is urgent to clarify its pathophysiology in vivo is very meaningful (Scheme 1).In the near future, organic small-molecule-based fluorescent probes have become an attractive tool and widely used to investigate various biological events in living biological systems due to their merits of non-invasiveness, high spatiotemporal resolution as well as real-time detection/imaging ability.18–22 Recently, a lot of H2O2 fluorescent probes have been successfully developed for the detection and imaging of H2O2.23–32 However, most of the reported H2O2 fluorescent probes were constructed from enhancing or reducing the output signal by a single-channel, which affected by the concentration of probe molecules, environmental factors, instrumental efficiency, etc. In contrast, ratiometric fluorescent probes have a built-in correction of the two emission bands, the ratiometric fluorescent probes can eliminate most, if not all, such interference.33–37 Moreover, some reported ratiometric H2O2 fluorescent probes were affected by low water solubility, poor organelle targeting ability, and small Stokes shift. Some fluorescent probes have a large Stokes shift, which can prevent the self-quenching effect and increase the signal-to-noise ratio. Especially in biological imaging, the crosstalk between the two channels can be minimized to obtain a large signal-to-background ratio. More importantly, the organelle-targeted fluorescent probes can accurately carry out imaging analysis at the organelle level to obtain more accurate results related to the analytes and the physiological and pathological processes. Thus, it is an urgent need to develop an efficient organelle-targeting ratiometric fluorescent probe with a large Stokes shift to improve its precision and sensitivity for concentration of H2O2 detecting in biosystems.
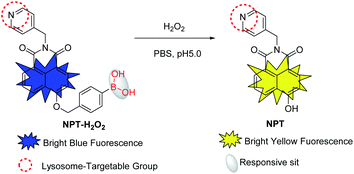
Due to the excellent optical properties of donor–π–acceptor (D–π–A)-structured naphthalimide derivatives, various fluorescent probes have been constructed based on them. Inspired by the photophysical properties of naphthalimine, prompting us to construct a new H2O2 fluorescent probe based on naphthalimine. Herein, utilizing benzyl boric acid as H2O2 reactive moiety (a well-known H2O2 responsive moiety), a new ratiometric fluorescent probe NPT-H2O2 was constructed for the selective detection of H2O2. In the absence of the H2O2, it emits a bright blue light, but in the presence of H2O2, it emits a bright yellow light, so as to achieve ratiometric detection of H2O2. Moreover, because the pyridine group is weakly basic, it can be actively targeting the lysosomes as a lysosomal targeting group. Significantly, NPT-H2O2 exhibits excellent sensing performance for H2O2: (1) it exhibits a target-regulated ratiometric fluorescence response toward H2O2; (2) a large Stokes shift with dual well-resolved channels (425 nm and 550 nm); (3) rapid response time (<1 min) and high selectivity over other analytes. In addition, for fluorescence imaging of H2O2 in living cells, and inflamed tissues, due to an obvious ratio signal between the blue channel and the yellow channel to obtain a large signal-to-background ratio, demonstrating the newly constructed ratiometric probe NPT-H2O2 was successfully applied to detect and image H2O2 in biological systems.
Experimental section
Materials and apparatus
Materials and equipment are described in the ESI.†Synthesis of 5 and dye 2 (NPT)
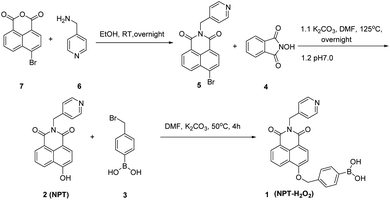
5 and 2 was synthesized according to the previous methods,38 and the synthesis steps were shown in Fig. 1. The detailed operation was as follows: 367 mg (1 mmol) 5, and 326 mg (2 mmol) 4, 417 mg (3 mmol) K2CO3, and 20 mL DMF were added to a 100 mL round bottom flask, and then the mixture was stirred at 125 °C overnight. The solvent of DMF was removed by the rotary evaporator under reduced pressure. Following, 20 mL of distilled water was added into the residue, and then the resolution of pH was adjusted to be neutral with hydrochloric acid (pH test paper), a large amount of yellow solid was formed and filtered under reduced pressure. A yellow crude product was obtained by a vacuum drying oven. Finally, the residue was purified by column chromatography with DCM/MeOH = 50![[thin space (1/6-em)]](https://www.rsc.org/images/entities/char_2009.gif) :
:![[thin space (1/6-em)]](https://www.rsc.org/images/entities/char_2009.gif) 1 (v/v) to obtain 222 mg yellow solid. 1H NMR (400 MHz, d6-DMSO) δ (ppm): 12.00 (s, 1H), 8.58–8.56 (d, J = 8.00 Hz, 1H), 8.50–8.48 (d, J = 8.00 Hz, 3H), 8.39–8.37 (d, J = 8.00 Hz, 1H), 7.80–7.76 (s, J = 8.00 Hz, 1H), 7.33–7.31 (d, J = 4.00 Hz, 2H), 7.19–7.17 (d, J = 8.00 Hz, 1H), 5.25 (s, 2H); 13C NMR (100 MHz, d6-DMSO) δ (ppm): 164.26, 163.50, 161.13, 149.91, 147.27, 131.97, 129.75, 122.94, 122.04, 112.74, 110.55, 42.46; LC-MS: m/z, C18H12N2O3, calcd 304.08, found 304.09.
1 (v/v) to obtain 222 mg yellow solid. 1H NMR (400 MHz, d6-DMSO) δ (ppm): 12.00 (s, 1H), 8.58–8.56 (d, J = 8.00 Hz, 1H), 8.50–8.48 (d, J = 8.00 Hz, 3H), 8.39–8.37 (d, J = 8.00 Hz, 1H), 7.80–7.76 (s, J = 8.00 Hz, 1H), 7.33–7.31 (d, J = 4.00 Hz, 2H), 7.19–7.17 (d, J = 8.00 Hz, 1H), 5.25 (s, 2H); 13C NMR (100 MHz, d6-DMSO) δ (ppm): 164.26, 163.50, 161.13, 149.91, 147.27, 131.97, 129.75, 122.94, 122.04, 112.74, 110.55, 42.46; LC-MS: m/z, C18H12N2O3, calcd 304.08, found 304.09.
Synthesis of ratiometric fluorescent probe 1 (NPT-H2O2)
152 mg (0.5 mmol) 2, 107 mg (0.5 mmol) 3, 139 mg (1 mmol) K2CO3 were dissolved in 10 mL DMF, and then the mixture was stirred for 4 h at 50 °C until the reaction was accomplished. The solvent of DMF was removed by the rotary evaporator under reduced pressure. Finally, the residue was purified by column chromatography with DCM/MeOH = 50![[thin space (1/6-em)]](https://www.rsc.org/images/entities/char_2009.gif) :
:![[thin space (1/6-em)]](https://www.rsc.org/images/entities/char_2009.gif) 1 (v/v) to obtain 189 mg yellow solid. 1H NMR (400 MHz, DMSO-d6) δ (ppm): 9.16–9.14 (d, J = 8.00 Hz, 2H), 8.57–8.52 (d, J = 8.00 Hz, 1H), 8.52–8.46 (m, 2H), 8.20–8.18 (d, J = 8.00 Hz, 2H), 7.89–7.82 (m, 3H), 7.50–7.41 (m, 3H), 5.86 (s, 2H), 5.49 (s, 2H), 5.26 (s, 2H); 13C NMR (100 MHz, DMSO-d6) δ (ppm): 163.52, 158.85, 158.37, 144.92, 135.29, 129.07, 128.14, 127.21, 126.52, 123.45, 122.38, 115.28, 108.25, 80.02, 78.53, 63.10, 57.43, 40.58, 35.02, ESI-MS C25H19BN2O5, calcd 438.14, found 438.15.
1 (v/v) to obtain 189 mg yellow solid. 1H NMR (400 MHz, DMSO-d6) δ (ppm): 9.16–9.14 (d, J = 8.00 Hz, 2H), 8.57–8.52 (d, J = 8.00 Hz, 1H), 8.52–8.46 (m, 2H), 8.20–8.18 (d, J = 8.00 Hz, 2H), 7.89–7.82 (m, 3H), 7.50–7.41 (m, 3H), 5.86 (s, 2H), 5.49 (s, 2H), 5.26 (s, 2H); 13C NMR (100 MHz, DMSO-d6) δ (ppm): 163.52, 158.85, 158.37, 144.92, 135.29, 129.07, 128.14, 127.21, 126.52, 123.45, 122.38, 115.28, 108.25, 80.02, 78.53, 63.10, 57.43, 40.58, 35.02, ESI-MS C25H19BN2O5, calcd 438.14, found 438.15.
Spectrophotometric measurements
10 mM stock solutions of NPT-H2O2 were obtained by dissolving the right amount of NPT-H2O2 in DMSO, and 10 mM stock solutions of H2O2 and other analytes were obtained in 10 mM PBS (pH 4.5). According to the previous references to prepare other ROS,39 and all of them were used freshly. The absorption and fluorescence spectra were measured after the probe and the analytes were incubated for 1 min. The emission range of the fluorescence spectrum was fixed at (400–700) nm, the excitation slit and emission slit widths were fixed at 5 nm and 5 nm, respectively.Fluorescence imaging of H2O2 in living cells
Before fluorescence imaging H2O2 in living cells, the MTT method was used to assess the degree of toxicity of the probe NPT-H2O2 to HeLa cells. Fluorescence images of HeLa cells were obtained by an Olympus FV1000 laser scanning confocal microscope (Japan). The fluorescent excitations wavelength were set at 405 and 635 nm, and the fluorescent emissions range were set at (410–460) nm, (500–560) nm, and (640–680) nm, respectively.Fluorescence imaging of H2O2 in inflamed tissues
In order to investigate the probe's imaging of H2O2 in the inflammation model, we injured one foot of an adult Kunming mouse, and the other normal foot was used as a control. Following, let the mouse die under the conditions of animal ethics, taken the inflamed tissues of the injured foot and normal tissues of control foot incubated with 5.0 μM probe NPT-H2O2 for 1 h for H2O2 images.Results and discussion
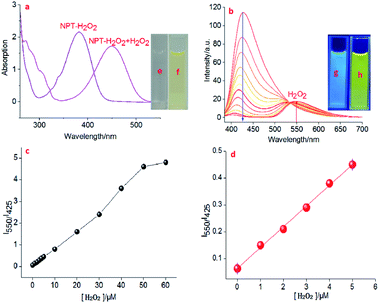
Naphthalimide-based fluorescent probes are widely used due to their D–π–A-structured and their 4-position are easily modified by a responsive group. Therefore, the targeting fluorescent probe is usually constructed by the substitution/modification of the 4-position, and the fluorescent signal change via the reaction of the probe with analytes to be regulated or activated. Such a designed structure affords naphthalimide fluorophore has some excellent optical properties. Herein, we used a well-known H2O2 responsive group (benzyl boric acid derivatives)40 to modify 4-position hydroxyl (–OH), and as well as used a pyridine group with the ability to bind H+ as a lysosome-targeting group to obtain targeting ratiometric fluorescent probe NPT-H2O2 for effectively detecting H2O2. Because lysosomes are acidic vesicles (pH 4.5–5.5),13,14 and –OH as an electron-donating group has a weak intramolecular charge transfer (ICT) effect, the fluorescence intensity is relatively weak under acidic conditions, and when –OH becomes an O− under alkaline conditions, it has a strong ICT effect and the fluorescence intensity increases. In addition, since the hydrogen proton of the 4-position –OH of the dye is replaced by the responsive group and becomes an ether bond, the ICT effect is completely ineffective, causing the fluorescence emission of a blue shift. When the probe is in the lysosomal pH range, the boric acid group quickly responds to the H2O2 to release the dye NPT and restore the weak ICT effect of the –OH, so the ratiometric detection of H2O2 can be achieved. According to the synthetic route given in Fig. 1 to synthesize the ratiometric fluorescent probe NPT-H2O2, and the targeting probe was fully characterized by 1H NMR, 13C NMR and ESI-MS (see ESI†).In order to investigate the responsive spectrum properties of the newly designed fluorescence probe NPT-H2O2 toward H2O2 under lysosomal physiological pH conditions (normal lysosomal pH 4.0 to 5.5, so, in this work, the pH 5.0 was simulated lysosomal pH value for all experiments). Therefore, the absorption and fluorescence spectra of NPT-H2O2 (5.0 μM) in the absence and in the presence of H2O2 in PBS buffer (10 mM, pH 5.0, with 1% DMSO). As shown in Fig. 2a, in the absence H2O2, the newly designed fluorescent probe NPT-H2O2 has a remarkable absorption peak at 375 nm. When in the presence of 60.0 μM H2O2, a significant new absorption peak appeared at 450 nm with a significant red shift 75 nm. At the same time, the response mechanism was also confirmed by mass spectrometry (Fig. S4†). Following, as shown in Fig. 2b–d, the response kinetic of the probe NPT-H2O2 toward H2O2 was investigated. The result showed that NPT-H2O2 had a good response kinetic. In the presence of 60.0 μM H2O2, 5.0 μM NPT-H2O2 could quickly react with H2O2 during 1 min to reach responsive equilibrium (the result was shown in Fig. S1†). Encouraged by the above experimental results, the newly designed probe NPT-H2O2 of the fluorescence intensity vs. different concentrations of (0–60.0) μM H2O2 were measured in 10 mM PBS (pH 5.0, Fig. 2b), of course, we also carried out the fluorescence response curve with pH = 7.4 (Fig. S3†). With the increase of H2O2 concentration, the emission peak at 425 nm gradually weakened, but a new emission peak was generated at 550 nm and its intensity became stronger and stronger with ∼5-fold ratio enhancement (Fig. 2c), and when H2O2 enhance from 0 to 5.0 μM with a good linear response (IF = 0.07729 × [H2O2] μM + 0.06395, R2 = 0.99878), according to 3σ/slope to obtain the limit of determination (LOD) as low as 12.8 nM (Fig. 2d). Moreover, the fluorescence of the solution changed from bright blue (Fig. 2g) to bright yellow (Fig. 2h) under the excitation of 365 nm UV lamp. Therefore, these results showed NPT-H2O2 has a potential to high sensitive for ratiometric H2O2 detection in vivo.
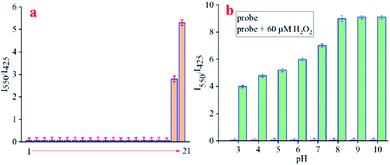
Because selectivity is a very important parameter for a newly designed probe, and high selectivity could eliminate interference from other coexisting biological species in vivo to determine whether the developed fluorescent probe could be used in biological systems. Therefore, we further carried out selectivity experiments of NPT-H2O2 with other ROS and other biological species including blank, Gly, Glu GSH, Cys, Ca2+, Na+, K+, Fe3+, Mg2+, Zn2+, NO2−, SO32−, NO, TBO˙, HO˙, t-BuOOH, ClO−, O2˙−, ONOO−, and H2O2 (Fig. 3a). Once upon reaction with H2O2, a large ratio (I550/I425) of fluorescent intensity was enhanced. Although ONOO− with slight interference for probe, the other analytes even exceeds in 10 equivalents caused the changes of the fluorescence intensity were ignored. Therefore, the experimental results showed that, except for H2O2, the addition of other analytes did not increase the fluorescence ratio value (Fig. 3a, I550/I425) of the newly designed NPT-H2O2, suggesting NPT-H2O2 to be accurately used in complex biological samples for H2O2 detection.
Additionally, responsiveness of NPT-H2O2 toward H2O2 under different pH (3.0–10.0) values further evaluated, the results as exhibited in Fig. 3b. In the absence of H2O2, no significant fluorescence intensity changes were caused by the pH from 3.0 to 9.0, but when in the presence of H2O2 (60.0 μM), the changes of the fluorescence intensity has changed significantly under different pH values, and the optimal pH response interval >4.0. All the results further demonstrated that NPT-H2O2 has the potential for H2O2 detecting in the lysosomes.
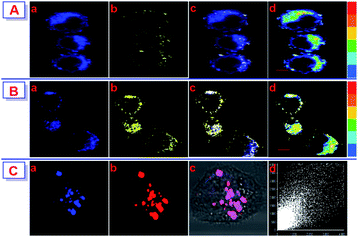
In order to investigate the potential of the probe NPT-H2O2 for H2O2 detection in living cells model. Before fluorescence imaging, the MTT method was used to evaluate the cytotoxicity of NPT-H2O2 to HeLa cells, and the results exhibited the concentration of probe from 0 to 20.0 μM was almost non-toxic to HeLa cells in Fig. S2,† and the cell viability was maintained at more than 85%. As shown in Fig. 4, when the HeLa cells were only incubated with 5.0 μM NPT-enhanced at I550/I425 with a very low limit of detection 12.8 nM. In addition, NPT-H2O2 showed low cytotoxicity, lysosome-targeting H2O2 for 30 min, a bright blue fluorescence signal was observed in the blue channel, while displayed only weakly yellow signal in the yellow channel (Fig. 4A(a) and (b)). In contrast, the HeLa cells were pre-treated with 60.0 μM of H2O2 for 30 min, and then continued to add 5.0 μM NPT-H2O2 to co-stain for 30 min. The blue fluorescence signal in the blue channel decreased dramatically while the yellow fluorescence signal in the yellow channel was dramatically increased (Fig. 4B(a) and (b)), suggesting NPT-H2O2 has the ability to H2O2 detection in the living cell. In addition, a colocalization experiment was carried out to further clarify that NPT-H2O2 could detect H2O2 in lysosomes. Specifically, NPT-H2O2 and a commercial lysosome-targeting reagent were co-stained with HeLa cells for 30 min, and then washed 3 times with 10 mM PBS to wash away the excess lysosome-targeting reagent and NPT-H2O2 to carried out colocalization imaging. From the co-localization imaging results, we can know that NPT-H2O2 located in lysosomes and have a good co-localization correlation coefficient (pc = 0.85, Fig. 4C(a)–(d)). All the results indicated NPT-H2O2 can penetrate the cell membrane and can locate the lysosomes for H2O2 detecting.
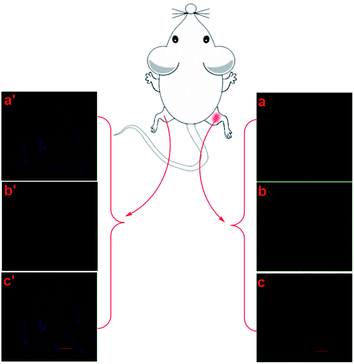
Finally, in order to evaluate the relationship between inflammation and H2O2, we constructed a mouse model to clarify the physiology and pathology of H2O2 and inflammation. Firstly, under the conditions of animal ethics, injuring the mouse's right hind foot to obtain inflamed tissue, while its left hind foot was kept normal as a control. Secondly, the model mouse was incubated in the incubator for 2 days. Thirdly, 5.0 μM probe solution was injected into the inflammation area of the right hind foot and the left hind foot symmetrical to the inflammation area of the right hind foot, respectively, and then the mouse was placed in an incubator for 1 h. At last, the mice were sacrificed according to the requirements of animal ethics, and taking the inflamed tissue of the right hind foot and the normal tissue of the left hind foot symmetrical to the right hind foot for imaging analysis. The imaging analysis of the tissue was performed with a Zeiss laser scanning confocal microscope (Germany), showing the fluorescence signal of inflamed tissues was significantly enhanced in the yellow channel, while the blue channel was significantly weakened (Fig. 5a and b). In contrast, for the normal tissues, the yellow channel has only a weak fluorescence signal, while the blue channel always has a bright fluorescent signal (Fig. 5a′ and b′). Therefore, the experimental results exhibited that the newly designed probe as an important tool could perform H2O2 detection in inflamed tissues.
Conclusions
In summary, in this work, we have designed and synthesized a naphthalimide-based lysosome-targeting ratiometric fluorescent probe NPT-H2O2 with large Stokes shift for H2O2 detection in living cells and inflamed tissues. Adopting a well-known H2O2 responsive moiety of benzyl boric acid ester to detect H2O2. In the absence of H2O2 only one fluorescent emission signal at 425 nm, while in the presence of H2O2, a new fluorescent emission peak was produced at 550 nm, the two well-resolved fluorescent emission signal separated by 125 nm. Moreover, NPT-H2O2 exhibited a large ratio ability and it was capable of H2O2 detection in living cells and inflamed tissues. Therefore, we expect that the ratiometric fluorescent probe NPT-H2O2 as a useful tool to study the physiological pathology related to H2O2 and inflammation.Ethical statement
All animal procedures were performed in accordance with the Guidelines for Care and Use of Laboratory Animals of Central South University of Forestry and Technology and approved by the Animal Ethics Committee of Central South University of Forestry and Technology.Conflicts of interest
There are no conflicts to declare.Acknowledgements
This work was partly supported by Key Research and Development Project of Hunan Province (2019NK2101).References
- J. Liu, J. Liang, C. Wu and Y. Zhao, Anal. Chem., 2019, 91, 6902 CAS.
- J. R. Stone and S. Yang, Antioxid. Redox Signaling, 2006, 8, 243 CrossRef CAS.
- J. P. Fruehauf and F. L. Meyskens, Clin. Cancer Res., 2007, 13, 789 CrossRef CAS.
- E. A. Veal, A. M. Day and B. A. Morgan, Mol. Cell., 2007, 26, 1 CrossRef CAS PubMed.
- K. Bedard and K. H. Krause, Physiol. Rev., 2007, 87, 245–313 CrossRef CAS PubMed.
- T. Münzel, T. Gori, J. F. Keaney, C. Maack and A. Daiber, Eur. Heart J., 2015, 36, 2555 CrossRef PubMed.
- E. Takimoto and D. A. Kass, Hypertension, 2007, 49, 24 CrossRef.
- J. Emerit, M. Edeas and F. Bricaire, Biomed. Pharmacother., 2004, 58, 39 CrossRef CAS.
- M. T. Lin and M. F. Beal, Nature, 2006, 443, 787 CrossRef CAS.
- J. R. Burgoyne, S. Oka, N. Ale-Agha and P. Eaton, Antioxid. Redox Signaling, 2013, 18, 1042 CrossRef CAS PubMed.
- L. C. Murfin, M. Weber, S. J. Park, W. T. Kim, C. M. Lopez-Alled, C. L. McMullin, F. Pradaux-Caggiano, C. L. Lyall, G. Kociok-Köhn, J. Wenk, S. D. Bull, J. Yoon, H. M. Kim, T. D. James and S. E. Lewis, J. Am. Chem. Soc., 2019, 141, 19389 CrossRef CAS PubMed.
- B. C. Dickinson and C. J. Chang, J. Am. Chem. Soc., 2008, 130, 9638 CrossRef CAS PubMed.
- V. Stoka, B. Turk and V. Turk, IUBMB Life, 2005, 57, 347 CrossRef CAS PubMed.
- S. L. Shiflett, J. Kaplan and D. M. Ward, Pigm. Cell Res., 2002, 15, 251 CrossRef CAS.
- S. Kornfeld and I. Mellman, Annu. Rev. Cell Biol., 1989, 5, 483 CrossRef CAS.
- E. J. Blott and G. M. Griffiths, Mol. Cell. Biol., 2002, 3, 122 CAS.
- J. Stinchcombe, G. Bossi and G. M. Griffiths, Science, 2004, 305, 55 CrossRef CAS.
- S. Singha, D. Kim, H. Seo, S. W. Cho and K. H. Ahn, Chem. Soc. Rev., 2015, 44, 4367 RSC.
- X. Li, X. Gao, W. Shi and H. Ma, Chem. Rev., 2014, 114, 590 CrossRef CAS PubMed.
- J. Liu, Y. Q. Sun, Y. Huo, H. Zhang, L. Wang, P. Zhang, D. Song, Y. Shi and W. Guo, J. Am. Chem. Soc., 2014, 136, 574 CrossRef CAS.
- K. P. Carter, A. M. Young and A. E. Palmer, Chem. Rev., 2014, 114, 4564 CrossRef CAS PubMed.
- D. P. Murale, H. Liew, Y. H. Suh and D. G. Churchill, Anal. Methods, 2013, 5, 2650 RSC.
- M. Abo, Y. Urano, K. Hanaoka, T. Terai, T. Komatsu and T. Nagano, J. Am. Chem. Soc., 2011, 133, 10629 CrossRef CAS PubMed.
- J. Liu, J. Ren, X. Bao, W. Gao, C. Wu and Y. Zhao, Anal. Chem., 2016, 88, 5865 CrossRef CAS PubMed.
- L. Yuan, W. Lin, Y. Xie, B. Chen and S. Zhu, J. Am. Chem. Soc., 2012, 134, 1305 CrossRef CAS.
- Z. Wu, M. Liu, Z. Liu and Y. Tian, J. Am. Chem. Soc., 2020, 142, 7532 CrossRef CAS PubMed.
- B. C. Dickinson, C. Huynh and C. J. Chang, J. Am. Chem. Soc., 2010, 132, 5906 CrossRef CAS PubMed.
- E. W. Miller, A. E. Albers, A. Pralle, E. Y. Isacoff and C. J. Chang, J. Am. Chem. Soc., 2005, 127, 16652 CrossRef CAS PubMed.
- M. Ren, B. Deng, K. Zhou, X. Kong, J. Y. Wang and W. Lin, Anal. Chem., 2017, 89, 552 CrossRef CAS PubMed.
- W. Shu, L. Yan, J. Liu, Z. Wang, S. Zhang and C. Tang, et al., Ind. Eng. Chem. Res., 2015, 54, 8056 CrossRef CAS.
- E. W. Miller, O. Tulyanthan, E. Y. Isacoff and C. J. Chang, Nat. Chem. Biol., 2007, 3, 263 CrossRef CAS.
- J. Liu, S. Zhou, J. Ren, C. Wu and Y. Zhao, Analyst, 2017, 142, 4522 RSC.
- D. Srikun, E. W. Miller, D. W. Domaille and C. J. Chang, J. Am. Chem. Soc., 2008, 130, 4596 CrossRef CAS PubMed.
- A. E. Albers, V. S. Okreglak and C. J. Chang, J. Am. Chem. Soc., 2006, 128, 9640 CrossRef CAS PubMed.
- C. Gao, Y. Tian, R. Zhang, J. Jing and X. Zhang, Anal. Chem., 2017, 89, 12945 CrossRef CAS.
- G. Yuan, H. Ding and L. Zhou, Spectrochim. Acta, Part A, 2020, 224, 117397 CrossRef CAS PubMed.
- W. Zhang, T. Liu, F. Huo, P. Ning, X. Meng and C. Yin, Anal. Chem., 2017, 89, 8079 CrossRef CAS PubMed.
- W. Shu, L. Yan, J. Liu, Z. Wang, S. Zhang, C. Tang, C. Liu and B. D. Zhu, Ind. Eng. Chem. Res., 2015, 54, 8056 CrossRef CAS.
- L. Zhou, Y. Peng, Q. Wang and Q. Lin, J. Photochem. Photobiol., B, 2017, 167, 264 CrossRef CAS.
- L. Zhou, H. Ding, W. Zhao and S. Hu, Spectrochim. Acta, Part A, 2019, 206, 529 CrossRef CAS PubMed.
Footnotes |
| † Electronic supplementary information (ESI) available. See DOI: 10.1039/d1ra04026j |
| ‡ These authors contributed equally to this work. |
| This journal is © The Royal Society of Chemistry 2021 |

