 Open Access Article
The electrochemical performance of fluorinated ketjenblack as a cathode for lithium/fluorinated carbon batteries
Shengbo Jiang *,
Ping Huang,
Jiachun Lu and
Zhichao Liu
Northwest Institute of Nuclear Technology, P.O. Box 69-14, Xi'an 710024, P. R. China. E-mail: jiangshengbo@nint.ac.cn
First published on 21st July 2021
Abstract
The inferior rate capacity of lithium/fluorinated carbon (Li/CFx) batteries limits their application in the field, requiring large discharge current and high power density. Herein, we report a novel type of fluorinated carbon with superior performance through gas-phase fluorination of ketjenblack. The investigation shows that the F/C ratio of the fluorinated ketjenblack (FKB) increases with the fluorination temperature, whereas the discharge voltage decreases due to the lowered content of semi-ionic C–F bonds. Accordingly, a suitable fluorination temperature of 520 °C was selected, under which the product exhibits the largest specific capacity of 924.6 mA h g−1 with discharge potential exceeding 3.1 V (vs. Li/Li+) and the highest energy density of 2544 W h kg−1 with power density of 27![[thin space (1/6-em)]](https://www.rsc.org/images/entities/char_2009.gif) 493 W kg−1. This energy density is higher than the theoretical energy density of commercial fluorinated graphite (2180 W h kg−1). In addition, the sample delivers good rate capability demonstrated by a specific capacity retention ratio of 79.5% even at a current density of 20C. Therefore, the FKB material may have very promising practical applications in lithium primary batteries.
493 W kg−1. This energy density is higher than the theoretical energy density of commercial fluorinated graphite (2180 W h kg−1). In addition, the sample delivers good rate capability demonstrated by a specific capacity retention ratio of 79.5% even at a current density of 20C. Therefore, the FKB material may have very promising practical applications in lithium primary batteries.
Introduction
As is known, solid-state lithium primary batteries compared to other primary batteries have the highest specific energy.1 The fluorinated carbon materials used as the cathode of lithium primary batteries have the advantage of high theoretical energy density, good reliability, low self-discharge capability, wide operating temperature, long storage life, etc.2 Compared with other primary lithium batteries such as Li/SOCl2 (1470 W h kg−1) and Li/MnO2 (1005 W h kg−1) batteries, the lithium/fluorinated carbon (Li/CFx) battery possesses a very high theoretical energy density (2180 W h kg−1 with x = 1 for fluorinated graphite).3–5 Due to their extraordinary performance, Li/CFx batteries are in strong demand for many military and civil applications.6As the cathode material of lithium primary batteries, fluorinated graphite, which is the most common CFx material, has its own drawbacks, such as poor rate capability, initial voltage delay and low discharge voltage platform.7–9 Consequently, various efforts have been made to enhance the rate capability of CFx compounds for improving the power density of Li/CFx batteries, including optimizing the fluorinated condition,10 screening the carbon source,11–15 surface-modifying the CFx material,3,16,17 designing hybrid materials18 and adding conductive layer-coating.19 The fluorinated condition and the carbon source are the most important factors affecting the performance of Li/CFx batteries.20
Regarding the fluorinated condition, the F/C ratio (the value of x) and the structure of the C–F bond influence the discharge capacity of the Li/CFx cell. CFx compounds can be non-stoichiometric with x varying between 0–1.3. The CFx material has the highest theoretical specific capacity of 865 mA h g−1 for x = 1.0.8,9,21,22 However, large x values indicate that most of F atoms covalently bond with the sp3 hybridization of C atoms, which leads to the poor conductivity of CFx cathode materials.13 The poor conductivity makes the actual capacity lower than the theoretical for Li/CFx batteries, and meanwhile reduces the rate capability and increase the initial voltage delay.16 In contrast, the CFx compound constructed by semi-ionic C–F bonds delivers excellent rate capability and high discharge voltage platform about 3.2 V (vs. Li/Li+).23 Therefore, optimizing the F/C ratio and composition of C–F bonds has become an effective approach to acquire fluorinated carbon with optimal performance.
In terms of carbon sources, various carbonaceous materials such as nano-structured carbon,1,24 carbon fibers,25 graphene,13,17 biomass derived carbon15 and so on were investigated for fluorination. Among these materials, the deeply fluorinated muti-wall carbon nanotubes investigated by Li et al.1 owned a maximum power density of 7117.1 W kg−1 with the discharge rate up to 5C due to the conductive networks which would be beneficial to the ion transmission, and the fluorinated biomass derived carbon prepared by Feng et al.15 delivered the highest energy density of 2585 W h kg−1 with high discharge potential and specific capacity. Recently, Zhou et al.26 developed fluorinated hard carbon prepared via F2 gas-phase fluorination possessing energy density as high as 2466 W h kg−1 and good rate capability (the specific capacity is over 600 mA h g−1 at current density of 5C). The nano-CFx materials usually have large specific surface area, small particle size and fluffy structure, which will improve the electrochemical reactivity by enabling the rapid diffusion of Li+ and reducing the reaction resistance, and thus work well at high discharge rates in Li/CFx batteries.27 Despite good electrochemical performance of these materials, high cost of nano-structured carbons and instability of production impede their practical application in lithium primary batteries.
In this paper, the ketjenblack (KB), which has been widely used in lithium ion batteries,28 capacitor29 and proton-exchange-membrane fuel cells30 as the conductive agent due to its large specific surface area and high conductivity, is adopted as the carbon source. In our previous study, pyrocarbons were obtained by heat-treatment of KB at different temperatures from 1000 °C to 2400 °C, and then the pyrocarbons were fluorinated in NF3 atmosphere to give CFx samples with high fluorine content.31 Considering that high temperature heat treatment will change the carbon structure of KB, and thus affect the electrochemical properties of CFx, in this work, we adopt the KB which is not treated at high temperature to obtain nano-CFx materials. The KB is fluorinated via gas-phase method using pure NF3 gas at high temperature (≥470 °C) to produce a series of CFx compounds denoted as fluorinated ketjenblack (FKB) with high fluorination degrees. The products deliver specific capacities over 900 mA h g−1 with the discharge potential exceeding 3.1 V (vs. Li/Li+). Furthermore, the products exhibit high energy and power densities at a high current density of 20C because of a large number of micropores which are found beneficial for increasing the contact area between the cathode active material and the electrolyte and hence improving the battery performance.32 The high specific capacity and excellent rate capability make the FKB material have a very promising practical application.
Experimental section
Material synthesis
The KB (ECP-600) was purchased directly from Japan Lion Specialty Chemicals Co., Ltd. The KB powder was placed in a pure nickel reactor and dried at 200 °C for 2 hours in vacuum. After drying, it is fluorinated using pure NF3 gas at a constant temperature within 470 to 540 °C for 5 hours to ensure complete reaction. The fluorinated products are named as FKB-1, FKB-2, FKB-3 and FKB-4 and their corresponding fluorination temperatures are 470 °C, 490 °C, 520 °C and 540 °C, respectively.Material characterization
The fluorine content of FKB materials was determined by a method of high temperature alkali fusion and ion selective electrode as average of three times.33 The morphologies of products were observed by field-emission scanning electron microscope (SEM, ZEISS MERLIN Compact) and transmission electron microscope (TEM, JEM-2100F). The chemical components of products were characterized by energy dispersive spectroscopy (EDS, INCA Energy spectrometer). The N2 adsorption/desorption isotherms were measured using an Autosorb-iQ instrument, and then the specific surface area was calculated based on the isotherms. X-ray diffraction (XRD) was studied by conventional powder X-ray diffraction (Bruker-AXS D8 Advance X-ray Diffractometer) with Cu Kα radiation. Fourier transform infrared spectroscopy (FT-IR) spectra were obtained using an infrared spectrometer (a PerkinElmer Frontier FT-IR). X-ray photoelectron spectroscopy (XPS) analysis was measured by a spectrometer (Kratos AXIS ULTRADLD) with Al anode operating at 15 kV. Thermogravimetric-differential scanning calorimetry (TG-DSC) of materials was performed on SDT Q600 V8.0 Build 95 heated to 800 °C in N2 at a rate of 10 °C min−1.Electrochemical measurements
The electrodes were composed of fluorinated compounds, acetylene black and polyvinylidene fluoride (PVDF) in a weight ratio of 8![[thin space (1/6-em)]](https://www.rsc.org/images/entities/char_2009.gif) :
:![[thin space (1/6-em)]](https://www.rsc.org/images/entities/char_2009.gif) 1
1![[thin space (1/6-em)]](https://www.rsc.org/images/entities/char_2009.gif) :
:![[thin space (1/6-em)]](https://www.rsc.org/images/entities/char_2009.gif) 1 in NMP (N-methyl-2-pyrrolidinone) to form uniform slurry. Then, the obtained slurry was evenly coated on the aluminium foil and vacuum-dried at 80 °C for 4 h. The aluminium does not contribute to the electrochemical performance and is commonly used in the preparation of cathode of lithium primary batteries.34 Finally, the electrode films were further cut into disks with diameter of 15 mm, and then vacuum-dried at 110 °C for 12 h before being transferred into a glove box for cell assembly. Each electrode comprises active materials within 1.5 to 2 mg cm−2. To assemble coin cells (CR2016), a Li foil was used as both the anode and reference electrodes, Celgard 2400 membrane was used as a separator, and 1.0 M LiBF4 in propylene carbonate/dimethoxy ethane (PC/DME, 1
1 in NMP (N-methyl-2-pyrrolidinone) to form uniform slurry. Then, the obtained slurry was evenly coated on the aluminium foil and vacuum-dried at 80 °C for 4 h. The aluminium does not contribute to the electrochemical performance and is commonly used in the preparation of cathode of lithium primary batteries.34 Finally, the electrode films were further cut into disks with diameter of 15 mm, and then vacuum-dried at 110 °C for 12 h before being transferred into a glove box for cell assembly. Each electrode comprises active materials within 1.5 to 2 mg cm−2. To assemble coin cells (CR2016), a Li foil was used as both the anode and reference electrodes, Celgard 2400 membrane was used as a separator, and 1.0 M LiBF4 in propylene carbonate/dimethoxy ethane (PC/DME, 1![[thin space (1/6-em)]](https://www.rsc.org/images/entities/char_2009.gif) :
:![[thin space (1/6-em)]](https://www.rsc.org/images/entities/char_2009.gif) 1 vol) was used as the electrolyte. Galvanostatic discharge tests at various current densities were performed with a LAND CT2001A. The battery test system was maintained at 25 °C, and the cut-off voltage was 1.5 V. The electrochemical impedance spectrum (EIS) was measured with an Advanced Electrochemical System PARSTAT 4000 in the frequency range from 0.01 Hz to 100 kHz, and the depth of discharge (DOD) was 10%.
1 vol) was used as the electrolyte. Galvanostatic discharge tests at various current densities were performed with a LAND CT2001A. The battery test system was maintained at 25 °C, and the cut-off voltage was 1.5 V. The electrochemical impedance spectrum (EIS) was measured with an Advanced Electrochemical System PARSTAT 4000 in the frequency range from 0.01 Hz to 100 kHz, and the depth of discharge (DOD) was 10%.
Results and discussion
Effect of fluorination temperature on the structure of FKB materials
It is widely known that a significant factor affecting the electrochemical performance is the fluorine content in CFx materials. By adjusting the fluorination temperature, we get the FKB materials with various fluorine content, so as to obtain the cathode materials with the best electrochemical performance. A high temperature alkali fusion and ion selective electrode measurement is used to determine the fluorine content of the FKB materials.33 The fluorine content (i.e., the F/C ratio) of the FKB materials is shown in Table 1, indicating that the F/C ratio increases with the fluorination temperature. This fact indicates that the fluorination temperature may significantly influence the properties of the obtained FKB materials. Therefore, SEM, TEM, N2 adsorption–desorption measurement, XRD, FT-IR, XPS and TG-DSC were carried out to elucidate the effects of fluorination temperature on the fluorinated ketjenblack.| FKB sample | Fluorination temperature | Fluorine content | F/C |
|---|---|---|---|
| FKB-1 | 470 °C | 48% | 0.58 |
| FKB-2 | 490 °C | 51% | 0.66 |
| FKB-3 | 520 °C | 58% | 0.87 |
| FKB-4 | 540 °C | 61% | 0.99 |
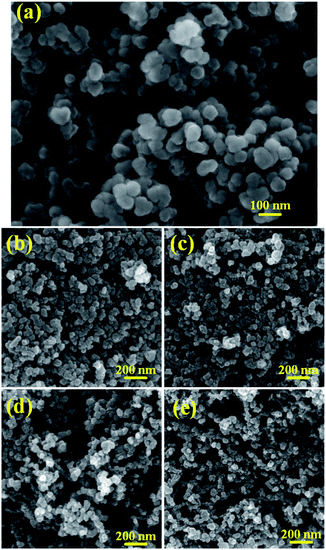
The SEM image of the pristine KB is shown in Fig. 1a, indicating that KB is formed by random accumulation of original particles in diameter of 30–50 nm with smooth surface. The microspheres stacking of particles by grafting leads to a fluffy three-dimensional structure of KB. The SEM images of FKB samples, as shown in Fig. 1b–e, reveal that the overall morphology of pristine KB is well maintained after fluorination and the particle sizes range from 20–40 nm. However, with the increase of fluorination temperature, the structure of FKB samples becomes fluffier because of the higher activation of NF3 at higher temperature which results in more serious erosion of the surface of KB and the stronger reaction between carbon atoms and fluorine ions which leads to particle fragmentation. The fluffy structure increases the contact surface area between the electrode material and electrolyte, shortening the Li+ diffusion path and thus reducing the internal resistance of the Li/CFx battery.1
The TEM image of KB (Fig. 2a) reveals that KB exhibits uniform distribution of interconnected carbon particles with random orientation, and the corresponding high-resolution TEM (HRTEM) image (Fig. 2f) demonstrates the disordered micro structure, comprising small graphitic domains of which the lattice fringe distance is 0.35 nm. The TEM images of prepared FKB samples (Fig. 2b–e) demonstrate that the randomly stacked carbon particles of KB are preserved after fluorination. From the corresponding HRTEM images (Fig. 2g–j), it can be observed that the stacked carbon particles are in irregular atomic arrangement, which is in agreement with the situation of CFx with high fluorination degrees. Some nanostructure domains in FKB have larger striped lattice spacing than the original KB, which indicates that fluorine atoms are introduced into graphitic domains of KB and vastly destroy the graphitic sheets of KB during the fluorination process.3 These results demonstrate that, compared with highly ordered structure such as graphite, the amorphous structure of KB is favorable to the fluorination process and produces obvious structural defects.26 EDS mapping (Fig. 2k–m) shows that the elemental distribution of prepared FKB-3 demonstrate the homogeneous fluorination of KB.
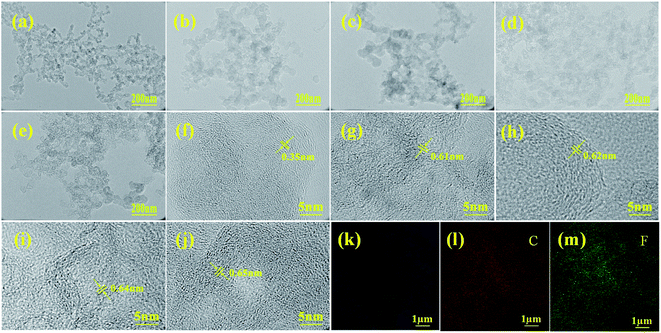 | ||
| Fig. 2 TEM (a–e) and HRTEM (f–j) images KB, FKB-1, FKB-2, FKB-3 and FKB-4, respectively. EDS mapping (k–m) of FKB-3. | ||
The surface characterizations of KB and FKB were determined by N2 adsorption–desorption isotherm measurements. The N2 adsorption–desorption isotherm of KB and FKB (Fig. 3a) samples could be classified as type IV, which means that the structures have large amount of micropores and mesopores.35 According to the isotherm, the specific surface areas of KB, FKB-1, FKB-2, FKB-3 and FKB-4 are 1321.4 m2 g−1, 704.6 m2 g−1, 697.9 m2 g−1, 596.1 m2 g−1 and 655.9 m2 g−1, respectively. Compared with the KB, the specific surface areas of FKB samples are significantly decreased, and this decrease is enhanced with the rise of the fluorination temperature except FKB-4. The reason for this result is that the disordered structure of KB becomes partially ordered after fluorination by NF3 gas. The pore sizes of KB and FKB (Fig. 3b) samples are analyzed based on nonlocalized density functional theory. The average pore sizes of the KB and FKB samples are 8.9 nm, 7.4 nm, 8.9 nm, 8.3 nm and 9.1 nm, respectively. After high temperature fluorination, the FKB materials retain the porous structure of pristine KB, which is favorable for lithium-ion transfer.36,37
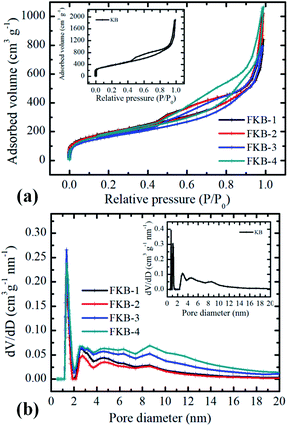 | ||
| Fig. 3 (a) Nitrogen isotherms and (b) pore size distributions of FKB samples. The inset is nitrogen isotherms and pore size distributions of KB. | ||
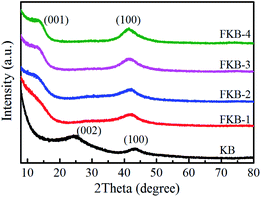
The XRD patterns of KB and FKB samples are shown in Fig. 4. The two peaks of KB located at nearly 24° and 43° are recognized to be (002) and (100) reflection of graphite structure, respectively.38 According to Bragg equation, the interlayer distance of KB is 0.37 nm corresponding to (002) reflection. After fluorination, a new diffraction peak located at around 13° appears, corresponding to the (001) lattice plane of the fluorinated carbon material. The (100) reflection peak shifts to the lower angel with the increase of fluorination temperature, signifying the increase of plane length of C–C bond, which means more and more C and F atoms combine to form fluorinated carbon compounds. Furthermore, the (001) reflection peak, corresponding to the hexagonal system compound with high fluorine content, becomes more obvious at higher temperature, indicating that more carbon layers are fluorinated. The interlayer spacing of d(001) for FKB is about 0.65 nm according to Bragg equation. These results coincide well with HRTEM analysis and the nature of fluorinated carbon materials, namely that the intensity of (001) and (100) reflection increases monotonously with the fluorination degree.39–42
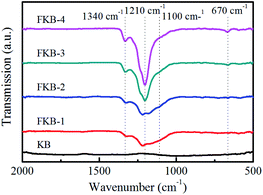
The FT-IR is used to investigate the chemical structure of the KB and FKB samples, and the result is shown in Fig. 5. There are no obvious absorption peaks in the FI-IR spectrum of KB, indicating that there is no oxygen-containing organic functional group. For the FKB samples, the intense absorption peak observed at around 1210 cm−1 corresponds to the C–F bond.38,43 It can be figured out that there is a blue shift of C–F bond in the FT-IR spectra of FKB with the increase of fluorination temperature, and meanwhile the full width at half maximum of the peak becomes narrower and the peak intensity becomes stronger. These results indicate that the bonding strength between C and F atoms has increased. The absorption peaks located at around 1340 cm−1 and 670 cm−1 are the characteristics of –CF2 groups and –CF3 groups respectively,38,44 and their strength increase with the fluorination temperature. Besides, there is a dispersive absorption peak appears at the wavenumber of 1100 cm−1 corresponding to the characteristic signal of semi-ionic C–F bond,43 and its intensity becomes weaker as the fluorination temperature increases.
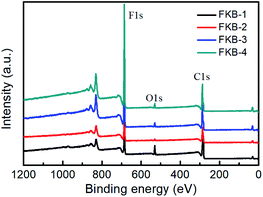
The XPS is used to determine the composition and functional species of FKB samples. As shown in Fig. 6, the peaks at about 284.6, 533 and 688.3 eV demonstrate the existence of C, O and F elements.45 The chemical compositions of all the FKB samples are shown in Table 2. It could be found that the fluorine content of FKB materials increases with the fluorination temperature. The change trend of chemical composition is in accord with the trend of FT-IR and XRD analysis.
| FKB sample | C (at%) | F (at%) | O (at%) | C 1s assignment (%) | ||||
|---|---|---|---|---|---|---|---|---|
C![[double bond, length as m-dash]](https://www.rsc.org/images/entities/char_e001.gif) C C |
C–C | C–F | –CF2 | –CF3 | ||||
| FKB-1 | 68.46 | 25.52 | 6.02 | 24.61 | 33.91 | 33.65 | 7.83 | |
| FKB-2 | 60.88 | 37.72 | 1.39 | 10.21 | 31.07 | 49.37 | 9.36 | |
| FKB-3 | 55.84 | 41.95 | 2.21 | 12.50 | 18.47 | 53.55 | 15.48 | |
| FKB-4 | 52.50 | 44.89 | 2.62 | 12.40 | 15.36 | 54.56 | 15.97 | 294.2 |
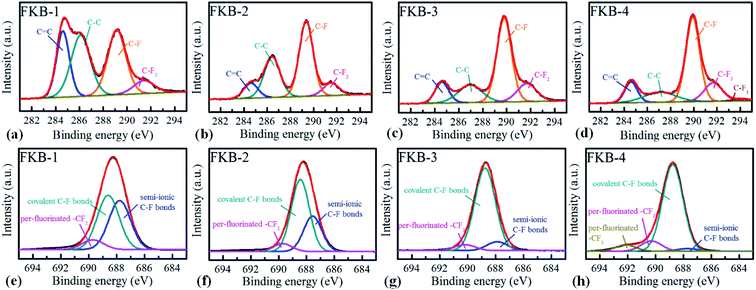
The chemical states of C and F elements are investigated by high-resolution XPS spectrum. In C 1s spectra (Fig. 7a–d), the peaks of C–F bonds significantly increase with the fluorination temperature, while the peaks of C![[double bond, length as m-dash]](https://www.rsc.org/images/entities/char_e001.gif) C bonds gradually reduce after fluorination. The results show that C
C bonds gradually reduce after fluorination. The results show that C![[double bond, length as m-dash]](https://www.rsc.org/images/entities/char_e001.gif) C bonds are gradually converted to C–F bonds through the chemical reaction of C
C bonds are gradually converted to C–F bonds through the chemical reaction of C![[double bond, length as m-dash]](https://www.rsc.org/images/entities/char_e001.gif) C and NF3. The sp2 hybridization structure (C–C) is still maintained in all FKB samples, which is helpful to enhance the conductivity. With the increase of fluorination temperature, the intensity of –CF2 and –CF3 enhances, indicating that more per-fluorinated configurations are produced. The F 1s spectra of FKB samples are also analysed, as shown in Fig. 7e–h. It can be figured out that the C–F bonds of FKB samples include semi-ionic bonds, covalent bonds and per-fluorinated bonds. With the increase of fluorination temperature, the content of semi-ionic C–F bonds decreases due to the change of C–F bonds from semi-ionic type (carbon atoms in sp2 hybridization) to covalent type (carbon atoms in sp3 hybridization).46,47 The existence of semi-ionic C–F bonds is beneficial to maintain good electrical conductivity of FKB samples, but the covalent C–F bonds reduce the conductivity drastically and make FKB samples tend to be insulating.47,48 The decrease of electrical conductivity will result in large ohmic polarization, which will lead to the decrease of discharge voltage of Li/CFx batteries.1
C and NF3. The sp2 hybridization structure (C–C) is still maintained in all FKB samples, which is helpful to enhance the conductivity. With the increase of fluorination temperature, the intensity of –CF2 and –CF3 enhances, indicating that more per-fluorinated configurations are produced. The F 1s spectra of FKB samples are also analysed, as shown in Fig. 7e–h. It can be figured out that the C–F bonds of FKB samples include semi-ionic bonds, covalent bonds and per-fluorinated bonds. With the increase of fluorination temperature, the content of semi-ionic C–F bonds decreases due to the change of C–F bonds from semi-ionic type (carbon atoms in sp2 hybridization) to covalent type (carbon atoms in sp3 hybridization).46,47 The existence of semi-ionic C–F bonds is beneficial to maintain good electrical conductivity of FKB samples, but the covalent C–F bonds reduce the conductivity drastically and make FKB samples tend to be insulating.47,48 The decrease of electrical conductivity will result in large ohmic polarization, which will lead to the decrease of discharge voltage of Li/CFx batteries.1
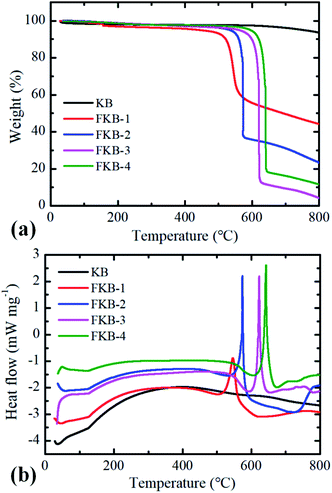
The TG-DSC under N2 atmosphere is used to test thermal stability of KB and FKB samples (Fig. 8). The decomposition of FKB-1, FKB-2, FKB-3 and FKB-4 starts at 547, 572, 621 and 642 °C, respectively. The decomposition temperature of FKB samples roughly increases with the F/C ratio. The result further confirms that the C–F bond of FKB-1 (low F/C ratio) is obviously weaker than that of the FKB-4 (high F/C ratio), agreeing well with the results obtained by XRD, FT-IR, and XPS.
Electrochemical performance of the FKB materials in Li/CFx batteries
The galvanostatic discharge tests conducted at various discharge rates with potential cut-off of 1.5 V are used to investigate the electrochemical performance of the prepared FKB samples as the cathode of Li/CFx batteries. The discharge current is scaled by the theoretical value (865 mA h g−1). From the galvanostatic discharge profiles (Fig. 9), the discharge voltage platforms at 0.01C of the four FKB samples are 3.20 V, 3.14 V, 3.04 V and 2.95 V, respectively. Although not remarkable, the FKB-1 sample possesses the highest output discharge potential because of the weaker covalence of C–F bond and the larger number of semi-ionic C–F bond.49 It can be clearly seen from the galvanostatic discharge electrogram that the discharge voltage of the FKB samples is significantly higher than that of the commercial fluorinated graphite3,50 at various discharge rates due to the semi-ionic C–F bond and the disordered structure in these samples. The fluorination degree and semi-ionic C–F bond have influence on the electrochemical properties of fluorinated carbon materials. However, with the increase of fluorination temperature, the changes of these two factors are not the same: the fluorination degree will increase while the number of semi-ionic C–F bonds will decrease. Therefore, a suitable fluorination temperature plays an important role in optimizing the electrochemical properties of fluorinated carbon materials. Under the same discharge rate, the specific discharge capacity of fluorinated carbon is proportional to the fluorine content. With cut-off potential of 1.5 V, the specific capacities of the four FKB samples at 0.01C are 702.4, 798.3, 924.6, 871.7 mA h g−1, respectively. Generally, high fluorine content leads to decreased electrical conductivity, increased ohmic polarization and decreased discharge voltage.49,51 However, when the fluorination temperature reaches 540 °C, the vigorous fluorination generates some defect structures, such as per-fluorinated groups like –CF2 and –CF3, as revealed by the FT-IR spectroscopy and XPS C1s spectrum. These per-fluorinated structures have no electrical conductivity and electrochemical activity, thus reducing the specific capacity and discharge voltage of FKB-4. Meanwhile, it can be seen that a higher discharge rate causes the decrease of specific capacity and average discharge voltage.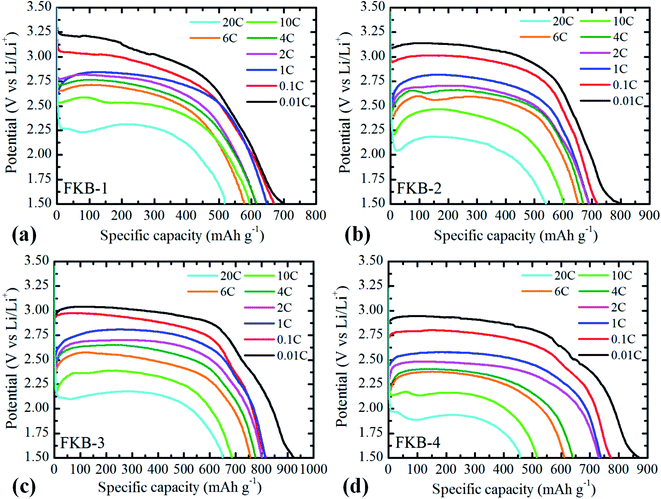 | ||
| Fig. 9 Galvanostatic discharge profiles of (a) FKB-1, (b) FKB-2, (c) FKB-3 and (d) FKB-4 at different current densities. | ||
Furthermore, the discharge rate performance of FKB samples is investigated. The output discharge potential at first drops from the open circuit discharge potential to 3.24 V–1.8 V (vs. Li/Li+) depending on the discharge rate, and then reaches a discharge voltage platform due to the two-phase nature of discharge.8 The maximum discharge rate, the specific capacity, energy density and power density obtained for FKB samples under test conditions are listed in Table 3. Compared with the commercial fluorinated graphite,3,52 of which the maximum discharge rate is usually limited to 1C, the FKB samples exhibit excellent power density and high energy density at higher discharge rates. With the increase of discharge rate, the discharge voltage and specific capacity of the FKB samples decrease due to the electrochemical polarization of the electrode reaction. As shown in Fig. 9, the discharge potential delay of the FKB cathodes is not significant until the discharge rate reaches as high as 20C, and the discharge voltage platforms of FKB-1, FKB-2, FKB-3 and FKB-4 are 2.31 V, 2.18 V, 2.17 V and 1.93 V, respectively. The capacity retention rates of the samples at different discharge rates are listed in Table 4. At the maximum discharge rate of 20C, the capacity retentions of the four FKB materials are 517.9, 539.7, 649.9 and 456.5 mA h g−1, respectively. As shown in Table 5, the electrochemical performance of FKB-3 are better than that of the commercial fluorinated carbon materials,3,52 fluorinated carbon fibers,53 fluorinated mesoporous carbon,15,26,54 fluorinated graphene47 and lots of nanostructured CFx.11,55 The highest capacity retention of FKB-3 reflects its superior rate capability due to relatively suitable semi-ionic C–F bonds and covalent C–F bonds. The lowest specific capacity retention rate of FKB-4 originates from the large number of per-fluorinated configurations.
| Sample | Maximum discharge rate | Maximum specific capacity (mA h g−1) | Maximum energy density (W h kg−1) | Maximum power density (W kg−1) |
|---|---|---|---|---|
| FKB-1 | 20C | 702.0 | 1936 | 27![[thin space (1/6-em)]](https://www.rsc.org/images/entities/char_2009.gif) 566 566 |
| FKB-2 | 20C | 798.4 | 2219 | 27![[thin space (1/6-em)]](https://www.rsc.org/images/entities/char_2009.gif) 625 625 |
| FKB-3 | 20C | 924.6 | 2544 | 27![[thin space (1/6-em)]](https://www.rsc.org/images/entities/char_2009.gif) 493 493 |
| FKB-4 | 20C | 871.7 | 2312 | 21![[thin space (1/6-em)]](https://www.rsc.org/images/entities/char_2009.gif) 380 380 |
| Sample | F/C | Theoretical specific capacity (mA h g−1) | Capacity retention rate at corresponding current density (%) | ||||
|---|---|---|---|---|---|---|---|
| 0.01C | 1C | 6C | 10C | 20C | |||
| FKB-1 | 0.58 | 675.4 | 104.0 | 96.1 | 85.6 | 88.2 | 76.7 |
| FKB-2 | 0.66 | 720.9 | 110.7 | 95.7 | 90.7 | 83.4 | 74.9 |
| FKB-3 | 0.87 | 817.4 | 113.1 | 99.7 | 92.5 | 83.9 | 79.5 |
| FKB-4 | 0.99 | 861.3 | 101.2 | 85.7 | 70.9 | 59.9 | 53.0 |
| Sample | Maximum capacity (mA h g−1) | Maximum energy density (W h kg−1) | Maximum C-rate available | Maximum power density (W kg−1) | References |
|---|---|---|---|---|---|
| Commercial CFx | 865 | 2012 | 1C | 1370 | 3 |
| Fluorinated carbon nanotubes | 785 | 1852 | 4 A g−1 | 8418 | 55 |
| Fluorinated carbon nanofiber | ∼800 | 1897 | 4C | 5564 | 53 |
| Fluorinated graphene | 775 | ∼1900 | 3C | 4038 | 47 |
| F-MWCNT | 836 | 1923 | 5C | 7114.1 | 11 |
| Daikin CFx | 825 | 1773 | 2C | ∼3500 | 52 |
| Fluorinated mesoporous carbon | 759 | 1937 | 5C | No available | 54 |
| Fluorinated hard carbon | 922.6 | 2466 | 5C | 8740 | 26 |
| Fluorinated cMNS | 949 | 2585 | 1C | No available | 15 |
| Fluorinated kejtenblack | 924.6 | 2544 | 20C | 27![[thin space (1/6-em)]](https://www.rsc.org/images/entities/char_2009.gif) 493 493 |
This study |
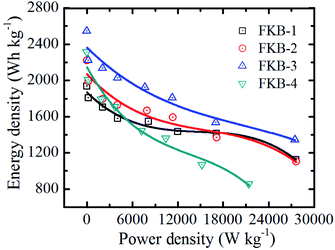
The Ragone plot of FKB cathodes (Fig. 10) depicts the variation of energy density with power density. It could be observed that the energy density decreases with the increase of power density. With the increase of discharge rate, the energy density decreases significantly due to that the output potential and discharge capacity decrease. However, under high discharge rate, the FKB material can have very excellent power density. The maximum energy densities of the four FKB cathodes occur at 0.01C, and they are 1936, 2219, 2544 and 2312 W h kg−1, respectively. With the increase of F/C ratio, the energy density could become higher than that of the commercial fluorinated graphite3,52 and many fluorinated carbons with nanostructures.11,55 Under different discharge rates, FKB-3 possessing very high-capacity retention rate exhibits extraordinary power density of 27![[thin space (1/6-em)]](https://www.rsc.org/images/entities/char_2009.gif) 493 W kg−1 and high energy density of 1344 W h kg−1 at 20C, which is comparable to fluorinated nanotubes and nanofibers.6,21,56,57
493 W kg−1 and high energy density of 1344 W h kg−1 at 20C, which is comparable to fluorinated nanotubes and nanofibers.6,21,56,57
The excellent electrochemical performance of FKB-3 is attributed to the continuous porous stacking structure, the suitable specific surface area and the appropriate number of semi-ionic C–F bonds. These increase the contact surface area between the electrode material and electrolyte, shorten the Li+ diffusion path, and facilitate electron transfer. During the discharge process, the C–F compounds react with Li+ to form LiF and conductive carbon. As the discharge reaction proceeds, LiF will continue to be generated and deposit on the surface to form a LiF shell. The LiF shell may lead to the formation of Li2F+,58 which will generate extra-capacity and improve the electrochemical performance of the FKB materials.
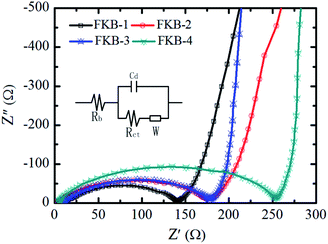
The electrochemical impedance spectra (EIS) measurements are applied to further investigate the difference among the FKB samples in the electrochemical performance.59 The EIS plots of FKB samples obtained at 10% level of DOD with discharge rate of 0.1C are shown in Fig. 11. The equivalent circuit model includes the bulk resistance Rb, the charge transfer resistance Rct, the double layer capacitance Cd, and the Warburg resistance W.60 It could be clearly found that the entire impedance spectrum is composed of a depressed semicircle in the high frequency and a 45°-sloped straight line in the low frequency. The Rct and W are responsible for the semicircle region and the straight-line region, respectively.14 According to the EIS plots, FKB-1 has the lowest Rct (130 Ω), indicating that it has the highest conductivity. Except FKB-1, FKB-3 possesses the lowest Rct (168 Ω) among other materials, which ensures its excellent power performance. The W is related to the diffusion of Li+ in the FKB electrode. Compared with FKB-1, FKB-3 possesses a much lower W, demonstrating fast diffusion of Li+ in the FKB-3 material. Under the case of low discharge rate, the C–F bond is the main factor affecting the discharge performance of fluorinated carbon materials, and the low discharge rate can promote the diffusion of lithium ions. The onset between the semicircle and the straight-line are indicative of reaction kinetics with higher frequencies representing faster reaction kinetics.3,12,61 Despite close conductivity, the effective C–F bond composition of FKB-3 is higher than that of FKB-2, and therefore the electrochemical performance of the former is better than that of the latter at low discharge rate. However, at high discharge rate, the influence of conductivity will increase and the solvated lithium ions only react with the fluorine atoms on the surface of FKB materials. AlthoughFKB-3 and FKB-4 both have good diffusion of Li+, the charge transfer resistance of FKB-3 (168 Ω) is lower than that of FKB-4 (249 Ω), which indicates that FKB-3 has better electrochemical performance than FKB-4 at high discharge rate.
Conclusions
A series of FKB materials with variable fluorine content have been prepared at various fluorination temperatures through gas-phase fluorination method. Their physical properties and electrochemical performance are researched systematically. The FKB materials as the cathode of Li/CFx batteries exhibit a high specific energy density of 2544 W h kg−1 and an extraordinary discharge rate of 20C. The FKB material prepared at 520 °C (FKB-3) exhibits a high energy density of 1344 W h kg−1 and an excellent power density of 27![[thin space (1/6-em)]](https://www.rsc.org/images/entities/char_2009.gif) 493 W kg−1 at 20C. The disordered structure of FKB derived from amorphous KB enhances the electrochemical activity of CFx, which can help to facilitate electron and Li+ transport through the electrode along with the semi-ionic C–F bonds and the porous structure after fluorination. Therefore, the FKB-3 has the characteristics of high specific energy density, high power density and excellent rate capability. Compared with nanostructured carbons, the FKB materials deliver excellent rate capability without decreasing specific energy density, which makes the FKB materials have a very promising practical application.
493 W kg−1 at 20C. The disordered structure of FKB derived from amorphous KB enhances the electrochemical activity of CFx, which can help to facilitate electron and Li+ transport through the electrode along with the semi-ionic C–F bonds and the porous structure after fluorination. Therefore, the FKB-3 has the characteristics of high specific energy density, high power density and excellent rate capability. Compared with nanostructured carbons, the FKB materials deliver excellent rate capability without decreasing specific energy density, which makes the FKB materials have a very promising practical application.
Conflicts of interest
There are no conflicts to declare.Acknowledgements
This research did not receive any specific grant from funding agencies in the public, commercial, or not-for-profit sectors.Notes and references
- Y. Li, X. Wu, C. Liu, S. Wang, P. Zhou, T. Zhou, Z. Miao, W. Xing, S. Zhuo and J. Zhou, J. Mater. Chem. A, 2019, 7, 7128–7137 RSC.
- C. A. Vincent, Solid State Ionics, 2000, 134, 159–167 CrossRef CAS.
- D. Yang, S. Cai, L. Wu, W. Yang, J. Xie, W. Wen, J.-C. Zheng and Y. Zhu, J. Mater. Chem. A, 2014, 2, 20896–20901 RSC.
- Y. Ma, H. Zhang, B. Wu, M. Wang, X. Li and H. Zhang, Sci. Rep., 2015, 5, 14949 CrossRef CAS PubMed.
- Y. Shao, H. Yue, R. Qiao, J. Hu, G. Zhong, S. Wu, M. J. McDonald, Z. Gong, Z. Zhu, W. Yang and Y. Yang, Chem. Mater., 2016, 28, 1026–1033 CrossRef CAS.
- L. Wang, Y. Li, S. Wang, P. Zhou, Z. Zhao, X. Li, J. Zhou and S. Zhu, ChemElectroChem, 2019, 6, 2201–2207 CrossRef CAS.
- K. Guérin, R. Yazami and A. Hamwi, Electrochem. Solid-State Lett., 2004, 7, A159 CrossRef.
- S. S. Zhang, D. Foster, J. Wolfenstine and J. Read, J. Power Sources, 2009, 187, 233–237 CrossRef CAS.
- Q. Zhanga, S. D'Astorga, P. Xiao, X. Zhang and L. Lu, J. Power Sources, 2010, 195, 2914–2917 CrossRef.
- P. Lam and R. Yazami, J. Power Sources, 2006, 153, 354–359 CrossRef CAS.
- L. Yu, Y. Feng and W. Feng, Electrochim. Acta, 2013, 107, 343–349 CrossRef.
- P. Meduri, H. Chen, X. Chen, J. Xiao, M. Gross, T. Carlson, J.-G. Zhang and andZ. D. Deng, Electrochem. Commun., 2011, 13, 1344–1348 CAS.
- S. Peng, S. Yan, N. Wang, W. Nan, J. Wang, X. Chen, C. Wang, X. Qi and S. Dai, RSC Adv., 2018, 8(23), 12701–12707 RSC.
- L. Yu and W. Feng, J. Power Sources, 2015, 274, 1292–1299 CrossRef.
- C. Peng, L. Yu, F. Yao, H. Fu, R. Zhou, Y. Feng and W. Feng, Carbon, 2019, 153, 783–791 CrossRef CAS.
- S. S. Zhang, D. Foster and J. Read, J. Power Sources, 2009, 191(2), 648–652 CrossRef CAS.
- D. Yang, F. Yuan, S. Cai, L. Wu, W. Yang, H. Yan, J. Xie, J.-C. Zheng, E. Takeuchi and Y. Zhu, J. Electrochem. Soc., 2017, 164(2), A1–A7 CrossRef.
- Y. Zhu, et al., J. Mater. Chem. A, 2017, 5(2), 796–803 RSC.
- X. Yin, Y. Li, Y. Feng and W. Feng, Synth. Met., 2016, 220, 560–566 CrossRef CAS.
- Y. Liu, et al., Nanotechnol. Rev., 2019, 8(1), 573–586 CAS.
- G. Zhong, H. Chen, X. Huang, H. Yue and C. Lu, Front. Chem., 2018, 6, 50 CrossRef PubMed.
- G. Nagasubramanian and B. Sanchez, J. Power Sources, 2007, 165(2), 630–634 CrossRef CAS.
- J. Bobnar, G. Kapun, R. Dominko, J. Bobnar, B. Genorio, R. Dominko, M. Lozinšek, C. Njel, R. Dedryvère, C. Njel, R. Dedryvère and R. Dominko, Sci. Rep., 2018, 8, 5819 CrossRef PubMed.
- Q. Zhang, K. J. Takeuchi, E. S. Takeuchi and A. C. Marschilok, Phys. Chem. Chem. Phys., 2015, 17(35), 2254–22518 Search PubMed.
- Y. Ahmad, K. Guérin, M. Dubois, W. Zhang and A. Hamwi, Electrochim. Acta, 2013, 114, 142–151 CrossRef CAS.
- R. Zhou, L. Yu, Y. Feng, C. Peng and W. Feng, Compos. Commun., 2020, 21, 100396 CrossRef.
- S. Al-khateeb, et al., J. Mater. Sci., 2015, 50(15), 5174–5182 CrossRef CAS.
- C.-C. Chang, H. Li-Jane, S. Huang-Kai, H. Sheng-Hsiang and Y. Yao Te, J. Electrochem. Soc., 2011, 158(5), A481 CrossRef CAS.
- D. Tashima, H. Yoshitama, M. Otsubo, S. Maeno and Y. Nagasawa, Electrochim. Acta, 2011, 56(24), 8941–8946 CrossRef CAS.
- Y. Liu, C. Ji, W. Gu, J. Jorne and H. A. Gasteiger, J. Electrochem. Soc., 2011, 158(6), B614 CrossRef CAS.
- Z. C. Liu, J. C. Lu and P. Huang, Adv. Mater. Res., 2014, 968, 16–20 CAS.
- S. Al Khateeb and T. D. Sparks, J. Mater. Res., 2019, 34, 2456–2471 CrossRef CAS.
- Z. C. Liu, Preparation and Energy Storage Performance of a Novel Carbon Fluoride Material, 2014, Northwest Institute of Nuclear Technology, Xi'an, p. 113 Search PubMed.
- S. A. Khateeb, et al., J. Electrochem. Soc., 2015, 162(8), A1667–A1674 CrossRef CAS.
- P. W. Gong, Z. F. Wang, Z. J. Fan, H. Wei, Z. G. Yang, J. Q. Wang and S. R. Yang, Carbon, 2014, 72, 176–184 CrossRef CAS.
- M. S. Whittingham, J. Electrochem. Soc., 1975, 122, 526–527 CrossRef CAS.
- H. Touhara, H. Fujimoto, N. Watanabe and A. Tressaud, Solid State Ionics, 1984, 14, 163–170 CrossRef CAS.
- C. Sun, Y. Feng, L. Yu, C. Qin, Q. Zhang and W. Feng, Nanoscale, 2013, 6(5), 2634–2641 RSC.
- S. Al Khateeb, T. W. Button and J. S. Abell, Supercond. Sci. Technol., 2010, 23(9), 095001 CrossRef.
- I. V. Trofimov and J.-I. Kim, Thin Solid Films, 2006, 495(1), 398–403 CrossRef.
- M. Ritala, et al., Thin Solid Films, 1994, 250(1), 72–80 CrossRef CAS; S. Al-Khateeb, et al., J. Supercond. Novel Magn., 2012, 25(6), 1823–1827 CrossRef.
- D. Pavlopoulos, et al., J. Phys.: Conf. Ser., 2008, 97, 012098 CrossRef.
- W. Feng, et al., Adv. Sci., 2016, 3(7), 1500413 CrossRef PubMed.
- J. Giraudet, C. Delabarre, K. Guérin, M. Dubois, F. Masin and A. Hamwi, J. Power Sources, 2006, 158(2), 1365–1372 CrossRef CAS.
- X. Wang, J. Gao, J. Huang, B. Li, C. Fan, Y. Jin and X. Liu, ACS Appl. Mater. Interfaces, 2013, 5(17), 8294–8299 CrossRef CAS PubMed.
- V. Mazanek, O. Jankovsky, J. Luxa, D. Sedmidubsky, Z. Janousek, F. Sembera, M. Mikulics and Z. Sofer, Nanoscale, 2015, 7, 13646–13655 RSC.
- C. Sun, Y. Feng, Y. Li, C. Qin, Q. Zhang and W. Feng, Nanoscale, 2014, 6, 2634–2641 RSC.
- Z. Wang, J. Wang, Z. Li, P. Gong, X. Liu, L. Zhang, J. Ren, H. Wang and S. Yang, Carbon, 2012, 50, 5403–5410 (Nanoscale, 2015, 7, 13646–13655) CrossRef CAS.
- M. Dubois, K. Guerin, W. Zhang, Y. Ahmad, A. Hamwi, Z. Fawal, H. Kharbache and F. Masin, Electrochim. Acta, 2012, 59, 485–491 CrossRef CAS.
- P. Zhou, J. Weng, X. Liu, Y. Li, L. Wang, X. Wu, T. Zhou, J. Zhou and S. Zhuo, J. Power Sources, 2019, 414, 210–217 CrossRef CAS.
- W. Zhang, M. Dubois, K. Guerin, P. Bonnet, H. Kharbache, F. Masin, A. P. Masin, A. Kharitonov and A. Hamwi, Phys. Chem. Chem. Phys., 2010, 12(6), 1388 RSC.
- P. Zhou, J. Weng, X. Liu, Y. Li, L. Wang, X. Wu, T. Zhou, J. Zhou and S. Zhuo, J. Power Sources, 2019, 414, 210–217 CrossRef CAS.
- R. Yazami, A. Hamwi, K. Guérin, Y. Ozawa, M. Dubois, J. Giraudet and F. Masin, Electrochem. Commun., 2007, 9, 1850–1855 CrossRef CAS.
- P. F. Fulvio, S. S. Brown, J. Adcock, R. T. Mayes, B. Guo, X. G. Sun, S. M. Mahurin, G. M. Veith and S. Dai, Chem. Mater., 2011, 23, 4420–4427 CrossRef CAS.
- H. Yue, W. Zhang, H. Liu, Z. Liu, G. Zhong and Y. Yang, Nanotechnology, 2013, 24, 424003–424010 CrossRef PubMed.
- L. Yu, Y. Chen, W. Feng, F. Ding and X. Liu, J. Power Sources, 2011, 196(4), 2246–2250 CrossRef.
- D. Damien, P. M. Sudeep, T. N. Narayanan, M. R. Anantharaman, P. M. Ajayan and M. M. Shaijumon, RSC Adv., 2013, 3(48), 25702 RSC.
- Y. Ahmad, M. Dubois, K. Guerin, H. Andre and W. Zhang, Carbon, 2015, 94, 1061–1070 CrossRef CAS.
- W. F. Yu Li, J. Power Sources, 2015, 274, 1292–1299 CrossRef.
- S. Gnedenkov, A. Tsvetnikov, D. Opra, S. Sinebryukhov and V. Sergienko, Phys. Procedia, 2012, 23, 86–89 CrossRef CAS.
- C. Pang, F. Ding, W. Sun, J. Liu, M. Hao, Y. Wang, X. Liu and Q. Xu, Electrochim. Acta, 2015, 174, 230 CrossRef CAS.
| This journal is © The Royal Society of Chemistry 2021 |

