 Open Access Article
Organic–inorganic hybrid sol–gel materials doped with a fluorescent triarylimidazole derivative†
Rui P. C. L. Sousa a,
Rita B. Figueira‡
 *a,
Bárbara R. Gomesa,
Susana P. G. Costa
 a,
Miguel Azenhab,
Rui F. P. Pereira
 a and
M. Manuela Raposo
 a
a
aCentre of Chemistry, University of Minho, Campus of Gualtar, 4710-057 Braga, Portugal. E-mail: rita@figueira.pt
bISISE, Engineering School, University of Minho, Campus of Azurém, 4800-058 Guimarães, Portugal
First published on 15th July 2021
Abstract
The development of sensors for pH monitoring is of extreme importance in the monitoring of concrete and reinforced concrete structures. Imidazole derivatives are promising probes for pH sensing due to the amphoteric nature of their heterocyclic ring, which can be protonated/deprotonated upon pH changes. In this work, a triarylimidazole was synthesised and used as a dopant in an organic–inorganic hybrid (OIH) sol–gel matrix to obtain a pH-sensitive membrane for further application in optical fibre sensors (OFS). The triarylimidazole probe shows fluorimetric response in pH between 9 and 13, which is the desired range for monitoring carbonation of concrete. This degradation process lowers the highly alkaline pH of concrete (12.5–13) to values below 9, which creates favourable conditions for corrosion of concrete reinforcement. The OIH membranes used were based on Jeffamine THF170 and 3-glycidoxypropytrimethoxysilane precursors, which had already been shown to be suitable and resistant in contact with cement-based materials. The OIHs were doped with three different contents of the triarylimidazole and the structural, dielectric, thermal and optical properties of the pure and doped OIH materials were evaluated. The structural analysis showed that the presence of the triarylimidazole did not change the structural properties of the OIH material. Electrochemical impedance spectroscopy showed that in the doped samples the conductivity increased with the imidazole concentration. The εr obtained for the doped samples ranged approximately from 11 to 19 and for the pure matrices was 8. Thermal analysis showed that these materials are stable up to 350 °C and that the presence of the probe did not change that feature. The optical properties showed that the prepared OIH materials have promising properties to be used as pH sensitive fluorimetric probes.
Introduction
Concrete is generally accepted by society as a very stable material, with high durability, long service life and low maintenance costs. However, its degradation may occur due to physical or chemical factors. This may be due to carbonation of concrete, corrosion of reinforcement or alkali-silica reaction.1,2Concrete structures are porous and entry of aggressive species, such as chloride ions or atmospheric CO2, may occur. The latter can lead to carbonation of concrete, a process that is generically the chemical reaction of atmospheric CO2 with alkaline constituents present in the concrete pore solution to form calcite (CaCO3). The interstitial concrete pore solution is usually highly alkaline (pH 12.5–13). However, due to carbonation, the pH can drop to values between 6 and 9,3 which compromises the integrity of the concrete4 by partially creating the necessary electrochemical conditions for corrosion of the reinforcement. Therefore, monitoring the pH of concrete is essential to ensure the durability for which civil engineering structures are dimensioned and to avoid premature deterioration of the structure. The use of sensors to monitor concrete degradation is widely accepted by the civil engineering community as it provides a rational approach to evaluating repair options and planning inspection and maintenance programmes.5 Optical fibre sensors (OFS) are considered as an interesting alternative due to their interesting advantages, i.e. reduced cost, size and weight, higher sensitivity and immunity to external factors.2 The proof of this is that several OFS have been reported in recent years for application in concrete structures.2,6–11 For instance, an OFS for chloride detection in concrete was reported by Ding and coworkers.11 Lucigenin was immobilised on a sol–gel membrane and the presence of chloride ions quenched the fluorescence of the compound with a limit of detection of 0.02 M. OFS for pH monitoring in concrete has also been reported.9 Tariq et al. reported an OFS based on a fluorescent molecular probe enclosed in a cross-linked matrix of polyvinyl alcohol (PVA), with a response time of 100 s and a detection limit of 0.1 pH units.10 Nevertheless, these OFS systems need to be further developed, as they have not achieved, hitherto, the reliability and accuracy of the destructive methods currently used.6 One of the main advantages of OFS is that they can be easily functionalised with a sensing membrane composed of a polymer or gel with properties to detect a specific analyte.9,11–13 In this context, the sol–gel technique is a versatile and widely used method that allows obtaining xerogels with interesting optical and dielectric properties suitable for the functionalisation of OFS.
In recent years, several OFS functionalised with sol–gel membranes have been reported, including for pH sensing.12–18 Pathak and Singh developed a down-tapered OFS for pH monitoring using three pH indicators in a sol–gel membrane with a maximum sensitivity of 0.49 dBm pH−1.14 Timbó et al. also used a pH indicator (bromocresol purple) on a sol–gel matrix, resulting in a sensor with acceptable linearity between a pH of 4 and 10.15 Bhardwaj et al. reported a no-core OFS using a sol–gel technique and three pH indicators to achieve a wide pH range, i.e., between 2 and 13.18 The developed sensor showed a sensitivity of 1.02 and 0.93![[thin space (1/6-em)]](https://www.rsc.org/images/entities/char_2009.gif) nm pH−1 for acidic and alkaline solutions, respectively. However, the application of this type of sensor in the field of civil engineering is still far from being ready for the market. Nguyen et al. reported the fabrication of an OFS for the pH range between 10 and 13, based on a coumarin imidazole dye covalently bonded to a polymer network.19 The sensor showed good stability, with no photobleaching and no sensitivity to ionic strength. The authors reported that the performance of the sensor was still accurate after 20 months.
nm pH−1 for acidic and alkaline solutions, respectively. However, the application of this type of sensor in the field of civil engineering is still far from being ready for the market. Nguyen et al. reported the fabrication of an OFS for the pH range between 10 and 13, based on a coumarin imidazole dye covalently bonded to a polymer network.19 The sensor showed good stability, with no photobleaching and no sensitivity to ionic strength. The authors reported that the performance of the sensor was still accurate after 20 months.
The physical and chemical properties of sol–gel materials can be tuned for the desired application by changing the precursors or synthesis conditions allowing to obtain organic–inorganic hybrid (OIH) materials.20,21 These types of materials combine the rigidity of silicates with the flexibility and hydrophobicity of organic moieties.22–29 The organic moieties of these materials include the commercial polyetheramines, particularly Jeffamines®, which have been frequently reported in the preparation of OIH materials.23,25,26,30–36 The use of Jeffamines® precursors to prepare sol–gel materials can result in urea silicates or aminoalcohol silicates matrices, depending on the silane used and type of bond established i.e., urea or aminoalcohol, respectively. These materials can be doped with chromo-fluorogenic chemosensors and become sensitive membranes that can be applied to OFS.
The development of chromo-fluorogenic molecular chemosensors for ions and neutral molecules has been extensively studied due to their potential applications in several scientific fields such as life sciences, medicine, chemistry, environment, etc.37,38 Therefore, the development of optical pH probes, besides its application in the field of civil engineering, has attracted much attention due to the crucial role of pH in various physiological processes.39,40 In this sense, imidazole derivatives are versatile compounds and interesting candidates as pH-sensitive molecules due to the amphoteric nature of the imidazole heterocycle. In fact, the imidazole ring can act as an excellent bond donor moiety in anion receptors since the acidity of the NH proton of the imidazole can be tuned by changing the electronic properties of the imidazole substituents. Moreover, the presence of a pyridine-like donor nitrogen atom within the ring, which is capable of selectively binding cationic species, also converts imidazoles into excellent cationic optical chemosensors.41–43 Therefore, imidazoles can be protonated or deprotonated depending on the pH of the environment.44,45
Recently, triaryl (heteroaryl)-imidazole based chromophores have attracted increasing attention due to their unique optical properties (linear and nonlinear) and excellent thermal stability in guest–host systems. Thus, these heterocyclic π-conjugated systems have found application as nonlinear optical materials,46,47 thermally stable fluorophores for OLEDs,48 two-photon absorbing molecules,49 DNA intercalators50 and PDI photosensitizers.51 In addition, they are also used as optical chemosensors in organic solvents and aqueous solutions, and as bioimaging probes for the detection of anions, neutral molecules and metal ions with biological/medical relevance.49,52–61 Several imidazole derivatives have been used as pH sensors. Ge et al. reported the synthesis of a 4-phenyl-pyrido[1,2-a]benzimidazole-3-carboxylic acid (PPBI-1), which exhibits a fluorescence quantum yield of 0.96 and is sensitive to pH values between 4.2 and 6.4.62 Beneto et al. synthesised a phenanthro [9,10-d]imidazole in combination with thiophene tethered pyridine (PITP).63 The probe can be protonated or deprotonated both at the imidazole and the piperidine ring, turning this molecule into a pH sensor in two different pH ranges. Horak et al. reported a benzimidazole Schiff base immobilised in PVC thin films.64 The probes showed colour changes upon protonation and fluorimetric pH sensitivity in the range of 6–7 when immobilised on the PVC matrix. Pfeifer et al. prepared a polyurethane hydrogel with a pH-sensitive dye perylene bisimide functionalised with one or two imidazole moieties.65 The protonation/deprotonation of the imidazole ring allows pH sensing at alkaline pH values. The abovementioned work by Nguyen et al. reported an imidazole-based OFS that is sensitive to pH in the desired range for concrete applications, i.e., pH 10–13.19 This work was the first to apply the pH-sensitivity of the imidazole ring to an OFS. The authors claimed that tests of the device embedded in concrete were underway. However, as far as the authors are aware, no further progress has been reported yet.
Following our previous work on imidazole derivatives for various optoelectronic and biological applications,46–61 along with OIH materials for concrete sensing,66,67 the current work reports the synthesis of an imidazole derivative and the characterization of OIH materials, pure and doped with the fluorescent triarylimidazole, to evaluate the prospect of preparing pH-sensitive membranes for use in OFS to evaluate the carbonation of concrete. The synthesised OIHs were based on Jeffamine® THF170 and 3-glycidoxipropyl-trimethoxysilane, which showed suitable properties for the desired application in previous studies.67 The structural properties of both pure and doped films were investigated by Fourier-transformed infrared spectroscopy. The dielectric properties of the films doped with the fluorescent triarylimidazole were characterised by electrochemical impedance spectroscopy. The thermal stability was evaluated by thermogravimetric analysis. The optical properties of the OIH films doped with fluorescent triarylimidazole were investigated by UV-Visible and fluorescence spectroscopy.
Experimental
Materials
Synthesis of imidazole 1 was monitored by thin layer chromatography (0.25 mm thick pre-coated silica plates: Merck Fertigplatten Kieselgel 60 F254). NMR spectra were obtained on a Bruker Avance III 400 at an operating frequency of 400 MHz for 1H and 100.6 for 13C using the solvent peak as internal reference. The solvent is indicated in parenthesis before the chemical shift values (δ relative to TMS and given in ppm). Melting point (Mp) was determined on a Gallenkamp apparatus. Infrared spectra were recorded on a BOMEM MB 104 spectrophotometer in KBr pellets. Fluorescence spectrum of imidazole 1 was collected using a FluoroMax-4 spectrofluorometer. UV-visible absorption spectra (200–700 nm) were obtained using a Shimadzu UV/2501PC spectrophotometer. Luminescence quantum yield was determined by using a 10−6 M solution of 9,10-diphenylanthracene in ethanol as standard (ΦF = 0.95).68 All commercially available reagents were used as received.Commercial reagents 3-glycidoxipropyltrimethoxysilane (GPTMS) (97%, Sigma-Aldrich, St. Louis, MO, USA), Jeffamine® THF170 (Huntsman Corporation, Pamplona, Spain), calcium hydroxide (Ca(OH)2, 95%, Riedel, Bucharest, Romania), potassium hydroxide (KOH, 90%, Panreac, Darmstadt, Germany), and solvents tetrahydrofuran (99.5% stabilised with ∼300 ppm of BHT, Panreac, Darmstadt, Germany) and absolute ethanol (EtOH, Panreac, Darmstadt, Germany) were used as received. Commercial buffer solutions of pH 4, 7 and 9 (Panreac, Darmstadt, Germany) were used in the preliminary tests. High purity deionised water with high resistivity (higher than 18 MΩ cm) obtained from a Millipore water purification system (Milli-Q®, Merck KGaA, Darmstadt, Germany) was used.
Synthesis of imidazole derivative 1 and organic–inorganic hybrid (OIH) films
![[thin space (1/6-em)]](https://www.rsc.org/images/entities/char_2009.gif) ε/M−1 cm−1) 307 (4.59). IR (KBr): ν = 3037, 2967, 2852, 2783, 2729, 2641, 1950, 1883, 1688, 1600, 1502, 1487, 1460, 1410, 1322, 1202, 1127, 1071, 967, 766, 696 cm−1. 1H NMR (DMSO-d6): δ = 7.21–7.56 (m, 13H, phenyl), 8.07 (dd, J = 8.4 and 1.2 Hz, 2H, phenyl), 12.67 (s, 1H, NH) ppm. 13C NMR (DMSO-d6): δ = 125.17, 126.49, 127.04, 127.76, 128.16, 128.22, 128.44, 128.64, 128.66, 130.33, 131.06, 135.15, 137.09, 145.47 ppm.
ε/M−1 cm−1) 307 (4.59). IR (KBr): ν = 3037, 2967, 2852, 2783, 2729, 2641, 1950, 1883, 1688, 1600, 1502, 1487, 1460, 1410, 1322, 1202, 1127, 1071, 967, 766, 696 cm−1. 1H NMR (DMSO-d6): δ = 7.21–7.56 (m, 13H, phenyl), 8.07 (dd, J = 8.4 and 1.2 Hz, 2H, phenyl), 12.67 (s, 1H, NH) ppm. 13C NMR (DMSO-d6): δ = 125.17, 126.49, 127.04, 127.76, 128.16, 128.22, 128.44, 128.64, 128.66, 130.33, 131.06, 135.15, 137.09, 145.47 ppm.![[thin space (1/6-em)]](https://www.rsc.org/images/entities/char_2009.gif) :
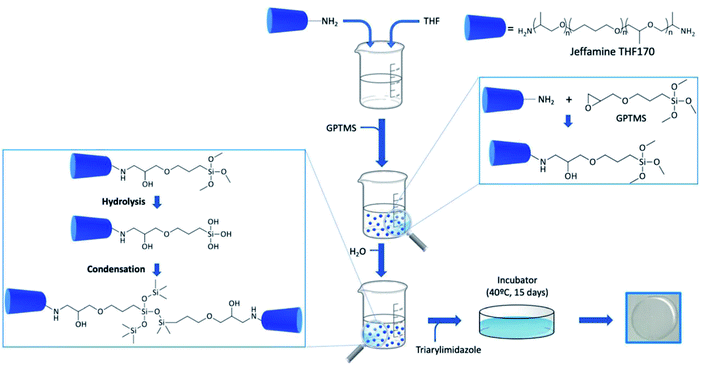
:![[thin space (1/6-em)]](https://www.rsc.org/images/entities/char_2009.gif) 2 GPTMS) and the solution was stirred for 20 min 107 μL of water were added and after 10 min, imidazole derivative 1 (dissolved in ethanol, 1 × 10⁻⁴ M) was added (for doped films). Three different volumes (500, 900 and 1000 μL) of the imidazole derivative 1 ethanolic solution were tested. When a homogeneous mixture was obtained, the gels were casted into Teflon moulds and covered with Parafilm. The films were placed in an oven (UNB 200, Memmert, Buechenbach, Germany) and kept at 40 °C for 15 days to ensure the curing of the film and remaining solvents evaporation. For details in the synthesis steps see Section 3.2 and Fig. 4.
2 GPTMS) and the solution was stirred for 20 min 107 μL of water were added and after 10 min, imidazole derivative 1 (dissolved in ethanol, 1 × 10⁻⁴ M) was added (for doped films). Three different volumes (500, 900 and 1000 μL) of the imidazole derivative 1 ethanolic solution were tested. When a homogeneous mixture was obtained, the gels were casted into Teflon moulds and covered with Parafilm. The films were placed in an oven (UNB 200, Memmert, Buechenbach, Germany) and kept at 40 °C for 15 days to ensure the curing of the film and remaining solvents evaporation. For details in the synthesis steps see Section 3.2 and Fig. 4.Characterization of organic–inorganic hybrid (OIH) films
Results and discussion
Synthesis and characterization of imidazole derivative 1
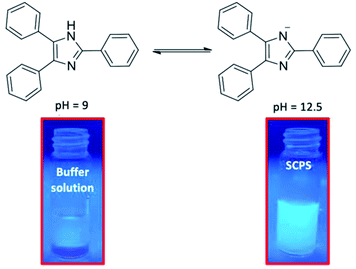
Imidazole derivative 1 was synthesised in 65% yield through the Radziszewski reaction of diphenylethanedione with benzaldehyde and ammonium acetate in refluxing glacial acetic acid for 8 h (vide Scheme 1). Earlier, the synthesis of compound 1 (2,4,5-triphenylimidazole, trivially known as lophine) was reported in a lower yield (42%) using a similar synthetic procedure.69 Compound 1 was characterised by NMR, IR and UV-Visible (absorption and emission) spectroscopies. The absorption (λmax = 307 nm) and emission spectra (λmax = 384 nm) of imidazole 1 were measured in acetonitrile (ACN) solutions. The relative fluorescence quantum yield was determined by using a 10−6 M solution of DPA in ethanol as standard (ΦF = 0.95).68 Imidazole 1 exhibited a good fluorescence quantum yield (0.64) in ACN.The imidazole derivative 1, hereafter mentioned as triarylimidazole, was tested using four solutions with different pH values to assess its optical properties change resulting from the protonation/deprotonation of the imidazole heterocycle (vide Fig. 1).
 | ||
| Fig. 1 Photoluminescence behaviour of triarylimidazole in different pH solutions, i.e., 4, 7, 9 and, 12.5, before and after an excitation with a light with a wavelength of 365 nm. | ||
A simulative concrete pore solution (SCPS) with a pH of 12.5 was prepared by addition of 0.2 M KOH to a Ca(OH)2 saturated solution.70,71 Three commercial buffer solution of pH 4, 7 and 9 were used for comparison purposes (vide Fig. 1 and 2).
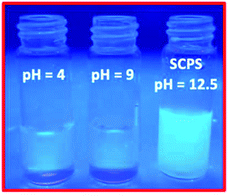 | ||
| Fig. 2 Photoluminescence of triarylimidazole on a viewing cabinet under UV lamp at 365 nm at different pH solutions, i.e., 4, 9 and, 12.5. | ||
Fig. 2 and 3 show clearly the difference between the fluorescence emission obtained for a pH = 9 and a pH = 12.5, which is the working range of interest in concrete. It can be observed that fluorescence emission increases at high pH values, i.e., at pH ∼12.5 (vide Fig. 1 and 2).
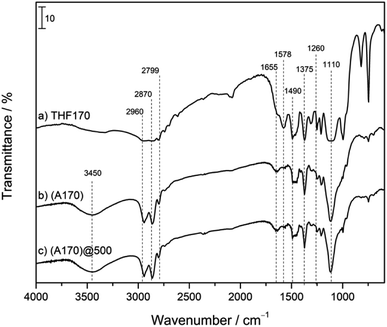
The spectrum of Jeffamine THF170 (a) shows bands at 2960, 2870 and 2799 cm−1, characteristic of C–H stretching vibrations.72 The band at 1578 cm−1 can be assigned to the bending of the terminal NH group in the Jeffamine chain. The bands at 1490 and 1375 cm−1 are assigned to simple bending vibrations of the carbon backbone of the polyetheramine.72
The GPTMS infrared spectrum has been reported previously73 and shows a small peak at 3050 cm−1 assigned to the epoxide ring. A sharp peak at 2840 cm−1 as well as the peak at 1190 cm−1 and the broad band between 1100–1080 cm−1 are assigned to the Si-alkoxy group. These three signals are characteristic of Si–OCH3 groups. The peak between 780–760 cm−1 is due to the Si–CH3, which are typical of trialkoxysilanes. The spectrum of the pure OIH material (Fig. 5b) has a broad band at 3400–3500 cm−1 that can be attributed to the O–H groups in the polyether chain which resulted from the aminoalcohol bond formation.73 O–H bonds from water molecules that may still be trapped in the polymeric hybrid may also affect this band. The bands at 2960 and 2870 cm−1 are caused by the asymmetric and symmetric C–CH2 stretching vibrations, respectively. The bands at 1490 and 1375 cm−1, also seen in the Jeffamine spectrum, are also present and confirm that the structural backbone of this precursor had not changed.72 The bond formed between the two precursors is an aminoalcohol bond, the presence of which can also be confirmed by the small peak at 1655 cm−1, typical of the C–NH–C bond bending vibration. The disappearance of the epoxy signal (3050 cm−1) from GPTMS also confirms that the reaction between the two precursors was successful. Moreover, the other characteristic signals of this precursor (peak at 1190 cm−1, broad band between 1100–1080 cm−1 and broad band between 780–760 cm−1) also disappeared, showing that the hydrolysis of the silane has taken place.73,74 The small peak at 1260 cm−1 can be assigned to the symmetric C–Si bond bending.74 The peak at 1110 cm−1 is related to Si–O–Si bonds, which are characteristic of this crosslinked OIH material.74 It can be observed that there are no significant changes between the pure (b) and doped (c) spectra, implying that the presence of the triarylimidazole in the matrix does not change the structural properties of the material. The spectra obtained for A(170)@900 and A(170)@1000 show the same typical bands as A(170)@500 and are therefore not shown in Fig. 5.
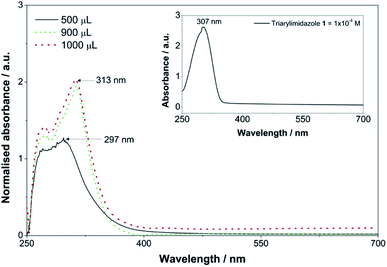
Fig. 6 shows that the triarylimidazole was successfully doped into the prepared OIH films, as the peak of this compound is present. Moreover, the intensity of the band increases with increasing concentration of triarylimidazole. It can also be observed that a small bathochromic shift of 6 nm in the absorption maxima occurred in the OIH films doped with 900 μL and 1000 μL. However, Fig. 6 also shows that the samples doped with 500 μL do not match those doped with higher amounts of triarylimidazole. Moreover, the peaks show low intensity and resolution and a hypsochromic shift of 10 nm. The low content of triarylimidazole within the OIH matrix could be the reason for this behaviour. Nevertheless, no further conclusions can be drawn from these results.
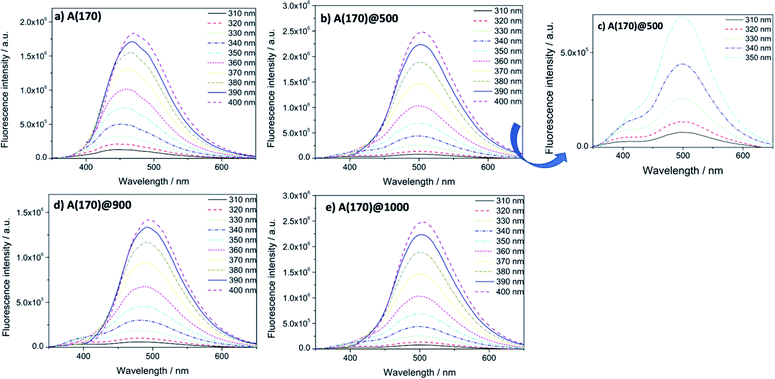
To complement the optical characterization of these materials, the OIH matrices based on A(170) were also analysed by fluorescence spectroscopy. Previous studies showed that the OIH materials exhibit intrinsic emission due to photoinduced proton transfer between NH3+/NH− defects and electron–hole recombination occurring in the siloxane nanoclusters.67,75 Studies on pure A(170) OIH matrices showed that the wavelength of the emission peak shifts to longer wavelengths as the excitation wavelength increases.67 It was shown that this dependence on excitation energy is related to transitions between localised states in non-crystalline structures and that the maximum emission wavelength is defined by the hierarchy of the silica backbone.75,76 The four OIH materials were analysed with different excitation wavelengths, from 310 to 400 nm. Fig. 9 shows fluorescence spectra obtained for the four matrices pure and doped with the triarylimidazole. It can be observed that the intensity and position of the photoluminescence emission strongly depends on the excitation wavelength and increases for all doped samples compared to undoped OIHs.
All photoluminescence emission spectra show broad bands at higher excitation energies. As the excitation energy decreases, the emission intensity of the bands increases, and the position of the emission peak shifts the lower energies. The same behaviour was observed for all doped samples.
All doped samples show two emission photoluminescence bands at λexc = 310, 320, 330, 340 and 350 nm (vide Fig. 7(b and c)), which shift to shorter wavelengths with increasing excitation wavelength. The photoluminescence emission band at lower energies arises from intrinsic matrix emission and slightly changes its position with increasing excitation wavelength. The full width at half maximum decreased in all spectra with the decrease of excitation energy.
The maximum emission wavelength of the pure matrix shows a bathochromic shift from 448 nm (λexc = 310 nm) to 471 nm (λexc = 400 nm). The presence of the triarylimidazole provokes a bathochromic shift in the matrix emission. In general, the maximum emission wavelength increases to values around 500 nm. The results of FTIR, UV-Visible and fluorescence spectroscopy are in agreement and prove that the triarylimidazole doped OIHs were successfully synthesised.
Fig. 8 shows the Nyquist plots of the pure A(170) films and the triarylimidazole doped films together with the fitting results and the electrical equivalent circuit (EEC) describing the impedance spectrum.
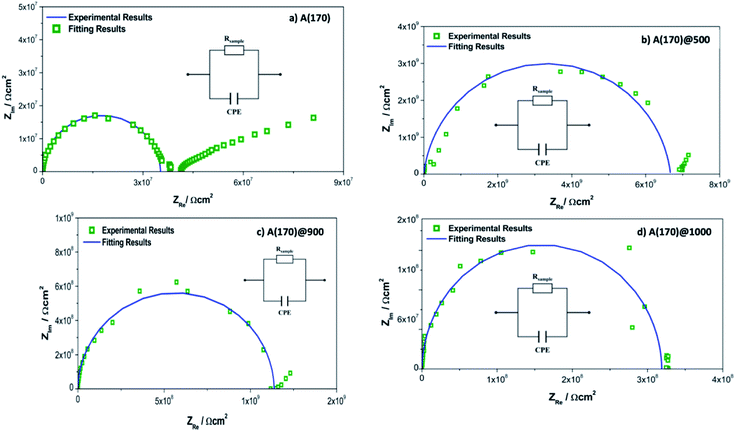 | ||
| Fig. 8 Nyquist plots obtained for the OIH films: (a) pure A(170) OIH;67 (b) A(170)@500; (c) A(170)@900; (d) A(170)@1000. All the Nyquist plots show the EEC inset. | ||
At higher frequencies, all Nyquist plots describe a semicircle intersecting the x axis. The amplitudes of the different samples change with their composition, suggesting that the concentration of triarylimidazole interferes with the impedance magnitudes by changing the dielectric properties of the OIH materials (e.g., resistivity and capacitance). The data obtained at lower frequencies suggest a different electrochemical process attributed to the Au|OIH material interface, as already discussed in previous manuscripts.66,67,78 Therefore, it will not be discussed in detail here.
The analysis of the EIS data was performed based on the EEC presented. Since the obtained results do not show ideal behaviour, constant phase elements (CPE) were used instead of pure capacitance to improve the data fitting.66,67,78,80 The fitting parameters, including the resistance of the OIH films (Rsample), CPE, the percentage of associated error, α, and the goodness of the fitting (χ2) are shown in Table 1.
| OIH sample | Rsample/Ω | CPE (Q)/Sα Ω−1 | α | χ2 |
|---|---|---|---|---|
| A(170)67 | 3.53 × 10⁷ (±0.77%) | 4.76 × 10⁻¹² (±2.29%) | 0.98 (ref. 67) | 3.20 × 10⁻⁴ |
| A(170)@500 | 6.67 × 10⁹ (±1.42%) | 1.40 × 10⁻¹¹ (±2.07%) | 0.93 | 2.69 × 10⁻² |
| A(170)@900 | 1.14 × 10⁹ (±1.23%) | 5.43 × 10⁻¹² (±1.25%) | 0.99 | 8.06 × 10⁻⁴ |
| A(170)@1000 | 3.19 × 10⁸ (±1.04%) | 4.74 × 10⁻¹² (±1.55%) | 0.99 | 1.69 × 10⁻³ |
According to Table 1, the resistance of the triarylimidazole doped OIHs range from 108 to 109 Ω. The resistance of the doped OIH films increases compared to the undoped ones. However, comparing different contents of triarylimidazole within the OIH matrices, the resistance decreases, i.e., higher contents of triarylimidazole lead to a decrease in resistance. Nevertheless, samples doped with 1000 μL of triarylimidazole show higher resistance than pure membranes. Also, the χ2 obtained for the data fitting is satisfactory considering that it is very low and ranges between 10−4 and 10−2. The values obtained for the elements of the EEC in Table 1, namely Rsample, CPE and α, were used to obtain the effective capacitance (Ceff) using the relationship of Brug et al.81 The values of resistance (R) and capacitance (C) were normalised to the dimensions of the cell geometry. R was determined using eqn 1 and C using eqn (2).
| R = Rsample × AAu disc | (1) |
| C = Ceff/AAu disc | (2) |
The conductivity (σ) was obtained using the following relation σ = (dsample/AAu disc)/Rsample. The relative permittivity (εr) was determined using the known equation εr = ((Ceff × dsample)/ε0) × AAu disc. The AAu stands for the area of the gold electrodes, dSample for the thickness of the analysed OIH film sample and, ε0 stands for the vacuum permittivity.
According to Table 2, the C values obtained for OIH doped samples are between 10−3 and 10−2. The lowest value was given by the samples doped with 900 μL of triarylimidazole. Table 2, also shows that A(170) samples doped with triarylimidazole show higher normalised resistance (R) and dielectric constant (εr) values than the undoped ones. The εr for doped samples are between 11 and 19. It can be also observed that as the content of triarylimidazole increases, the values of R and εr decrease. Conductivity (σ) is mainly determined by the content of inorganic substances, hydroxyl groups and water molecules within the membrane. Table 2 shows, that for doped samples, σ values are between 10−11 and 10−10 S cm−1. Doped samples show lower values compared to undoped ones.82 However, when comparing within doped samples it can be observed that as the content of triarylimidazole increases the σ increases. This behaviour is according to the results obtained by the author Thanganathan82 in which it was reported that the ionic conductivity increased with the imidazole concentration. These results suggest that this behaviour is related to the number of mobile charge carriers within the OIH matrix.82
| OIH sample | log![[thin space (1/6-em)]](https://www.rsc.org/images/entities/char_2009.gif) R/Ω cm2 R/Ω cm2 |
C/nF cm2 | εr | −log![[thin space (1/6-em)]](https://www.rsc.org/images/entities/char_2009.gif) σ/S cm−1 σ/S cm−1 |
|---|---|---|---|---|
| A(170)67 | 7.03 ± 0.72 | 5.01 × 10⁻³ ± 2.10 × 10⁻⁵ | 8.12 ± 0.03 | 7.87 ± 0.72 |
| A(170)@500 | 9.74 ± 0.03 | 1.78 × 10⁻² ± 1.79 × 10⁻³ | 18.93 ± 1.36 | 10.91 ± 0.03 |
| A(170)@900 | 8.85 ± 0.30 | 7.87 × 10⁻³ ± 4.03 × 10⁻³ | 15.99 ± 0.87 | 9.73 ± 0.30 |
| A(170)@1000 | 8.37 ± 0.04 | 5.73 × 10⁻³ ± 7.67 × 10⁻⁵ | 11.37 ± 0.15 | 9.13 ± 0.04 |
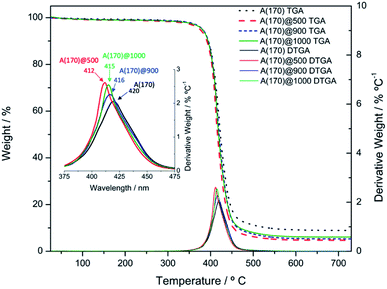
Thermogravimetric Analysis. Fig. 9 shows that the highest degradation processes occur between 375 and 450 °C.
The obtained results are in agreement with the results found in the literature, in which it was reported that the major degradation processes in amino–alcohol based OIH materials occurred between 350–500 °C.34,73,83,84 The degradation processes are explained by the depolymerization of the polyether material and condensation of residual Si–OH groups.34
Table 3 shows the 5% weight loss temperature (T5), the temperature of maximum rate of weight loss (Tmax) and char yield. No major changes on the thermal profile of the material occurred in the doped OIH films.
| OIH sample | T5 (°C) | Tmax (°C) | Char yield (%) |
|---|---|---|---|
| A(170) | 380 | 420 | 8.9 |
| A(170)@500 | 376 | 412 | 4.7 |
| A(170)@900 | 381 | 416 | 5.3 |
| A(170)@1000 | 380 | 415 | 6.1 |
The Tmax obtained for the doped samples suffered a small shift to lower temperature values. This can be linked to the lower crosslinking density,73,83,84 which may indicate that the triarylimidazole contributes to reduce the crosslinking density of the OIH matrix. This behaviour was expected and is according to the literature.82 This assumption can also be supported by the char yield values, that shows that the pure OIH material has a higher residual weight at 750 °C, suggesting higher crosslinking density. The char yield also increases (Table 3) with the content of triarylimidazole suggesting that the crosslinking of the doped samples decreases as the content of triarylimidazole increases. This may be correlated with the EIS data obtained for OIH doped samples since the conductivity increases as the triarylimidazole content increases. Lower crosslinking allows higher number of mobile charge carriers within the OIH matrix.82 The results obtained (Fig. 9 and Table 3) showed that no relevant degradation processes occurred at temperatures below 350 °C. Considering all the above exposed and the fact that the normal applications of concrete are made at service temperatures within extreme ranges between −20 °C to 60 °C (as an estimate of an envelope of environmental temperatures worldwide), it can be assumed that the produced OIH films are suitable to be applied in concrete. This assumption of stability can also be taken at early stages of curing of concrete in the first few days: in fact, due to exothermic nature of cement hydration reactions, internal heat is accumulated, and temperature rises are expected, yet normally do not reach values above 70 °C,85 which is also important to avoid other types of damage of microstructure of the hardened concrete. However, in case of fire hazard temperatures reached inside concrete can be over 1000 °C, therefore permanent and irreversible damage is expected to the films and optical fibres.
Conclusions
An imidazole derivative (triarylimidazole) was synthesised in a 65% yield. The obtained compound was characterised by NMR, FTIR and UV-Visible absorption and fluorescence spectroscopies and showed absorption λmax at 307 nm and emission λmax at 384 nm. The compound was tested in solutions with different pH values and showed fluorimetric changes with pH variations. Innovative OIH sol–gel materials based on Jeffamine THF170 and GPTMS doped with the triarylimidazole were reported for the first time and characterised by FTIR, UV-Visible spectroscopy, fluorescence spectroscopy, EIS and TGA.FTIR spectroscopy showed that the synthesis of the OIHs was successful, and that the presence of the doped imidazole did not alter the structural properties of the hybrid membranes. UV-Visible and fluorescence data suggest that the samples have optical properties with potential to be used as sensing membranes for monitoring pH in alkaline environments. However, further studies need to be carried out to clarify some aspects, namely the behaviour of the membranes doped with lower levels of imidazole derivative. The dielectric properties of the materials show that within the doped samples, the conductivity increased with the imidazole derivative content. The εr obtained for the doped samples is approximately between 11 and 19 and, 8 for pure OIH matrix. The thermogravimetric analysis showed that the OIH films are thermally stable for application in fresh concrete since the degradation processes take place at temperature values much higher than the curing temperatures of concrete.
The obtained results suggest that the synthesised doped OIH membranes have promising properties for application in the functionalization of OFS for monitoring the pH of concrete. Nevertheless, the responsiveness of the OIH membranes deposited on OFS with pH variation needs to be evaluated and validated to reach the next stage of development.
Author contributions
Conceptualization: R. B. Figueira; formal analysis: R. B. Figueira, R. P. C. L. Sousa, B. R. Gomes, R. F. P. Pereira, M. M. M. Raposo, S. P. C. Costa; funding acquisition: R. B. Figueira and C. J. R. Silva; methodology: R. B. Figueira, R. F. P. Pereira, M. M. M. Raposo, S. P. C. Costa; investigation: R. B. Figueira, B. R. Gomes; writing – original draft preparation: R. P. C. L. Sousa, R. B. Figueira, B. R. Gomes, M. M. M. Raposo, S. P. C. Costa; writing – review and editing: R. B. Figueira, R. P. C. L. Sousa, R. F. P. Pereira, M. M. M. Raposo, S. P. C. Costa, M. Azenha; project administration: R. B. Figueira; resources: R. B. Figueira, R. F. P. Pereira, M. M. M. Raposo, S. P. C. Costa, M. Azenha; supervision: R. B. Figueira. All authors have read and agreed to the published version of the manuscript.Conflicts of interest
There are no conflicts to declare.Acknowledgements
Thanks are due to Fundação para a Ciência e Tecnologia (FCT) and FEDER (European Fund for Regional Development)-COMPETE-QRENEU for financial support through the Chemistry Research Centre of the University of Minho (Ref. CQ/UM (UID/QUI/00686/2019 and UID/QUI/00686/2020)), project “SolSensors — Development of Advanced Fiber Optic Sensors for Monitoring the Durability of Concrete Structures” (http://www.solsensors.eu), reference POCI-01-0145-FEDER-031220, and a PhD grant to Rui P. C. L. Sousa (SFRH/BD/145639/2019). The NMR spectrometer Bruker Avance III 400 is part of the National NMR Network (PTNMR) and are partially supported by Infrastructure Project No 022161 (co-financed by FEDER through COMPETE 2020, POCI and PORL and FCT through PIDDAC). Thanks are also due to FCT/MCTES through national funds (PIDDAC) under the R&D Unit Institute for Sustainability and Innovation in Structural Engineering (ISISE), under reference UIDB/04029/2020.References
- R. B. Figueira, R. Sousa, L. Coelho, M. Azenha, J. M. de Almeida, P. A. S. Jorge and C. J. R. Silva, Constr. Build. Mater., 2019, 222, 903–931 CrossRef CAS.
- S. Taheri, Constr. Build. Mater., 2019, 204, 492–509 CrossRef.
- N. B. Winter, Understanding cement: an introduction to cement production, cement hydration and deleterious processes in concrete, Microanalytics Consultants, St. Ives, UK, 2012 Search PubMed.
- L. J. Parrott, A review of carbonation in reinforced concrete, Cement and Concrete Association, Wexham Springs, Liverpool, UK, 1987 Search PubMed.
- R. B. Figueira, Appl. Sci., 2017, 7, 1157 CrossRef.
- A. Behnood, K. Van Tittelboom and N. De Belie, Constr. Build. Mater., 2016, 105, 176–188 CrossRef CAS.
- C. K. Y. Leung, K. T. Wan, D. Inaudi, X. Bao, W. Habel, Z. Zhou, J. Ou, M. Ghandehari, H. C. Wu and M. Imai, Mater. Struct., 2015, 48, 871–906 CrossRef.
- A. Khadour and J. Waeytens, in Eco-Efficient Repair and Rehabilitation of Concrete Infrastructures, ed. F. Pacheco-Torgal, R. E. Melchers, X. Shi, N. D. Belie, K. V. Tittelboom and A. Sáez, Woodhead Publishing, 2018, pp. 97–121 Search PubMed.
- P. A. M. Basheer, K. Grattan, T. Sun, A. Long, D. O. Mcpolin and W. Xie, Proc. SPIE 5586, Advanced Environmental, Chemical, and Biological Sensing Technologies II, 7 December 2004 Search PubMed.
- A. Tariq, J. Baydoun, C. Remy, R. Ghasemi, J. P. Lefevre, C. Mongin, A. Dauzères and I. Leray, Sens. Actuators, B, 2021, 327, 128906 CrossRef CAS.
- L. Ding, Z. Li, Q. Ding, X. Shen, Y. Yuan and J. Huang, Sens. Actuators, B, 2018, 260, 763–769 CrossRef CAS.
- S. Islam, H. Bakhtiar, N. Bidin, S. Riaz and S. Naseem, J. Sol-Gel Sci. Technol., 2018, 86, 42–50 CrossRef CAS.
- S. Islam, R. A. Rahman, Z. B. Othaman, S. Riaz and S. Naseem, J. Ind. Eng. Chem., 2015, 23, 140–144 CrossRef CAS.
- A. K. Pathak and V. K. Singh, Optik, 2017, 149, 288–294 CrossRef CAS.
- Á. P. Timbó, P. V. F. Pinto, H. A. Pinho, L. P. de Moura, J. B. Chretien, F. W. Viana, R. G. D. Filho, E. B. da Silva, M. E. R. da Silva, J. W. M. Menezes, G. de F. Guimarães and W. B. Fraga, Sens. Actuators, B, 2016, 223, 406–410 CrossRef.
- D. Razo-Medina, E. Alvarado-Méndez and M. Trejo-Durán, Procedia Technol, 2017, 27, 271–273 CrossRef.
- N. Deepa and A. Balaji Ganesh, Measurement, 2015, 59, 337–343 CrossRef.
- V. Bhardwaj, A. K. Pathak and V. K. Singh, J. Biomed. Opt., 2017, 22, 057001 CrossRef.
- T. H. Nguyen, T. Venugopala, S. Chen, T. Sun, K. T. V. Grattan, S. E. Taylor, P. A. M. Basheer and A. E. Long, Sens. Actuators, B, 2014, 191, 498–507 CrossRef CAS.
- H. K. Schmidt, J. Non-Cryst. Solids, 1985, 73, 681–691 CrossRef CAS.
- J. D. Mackenzie, J. Sol-Gel Sci. Technol., 1994, 2, 81–86 CrossRef CAS.
- R. B. Figueira, R. Sousa and C. J. R. Silva, in Advances in smart coatings and thin films for future industrial and biomedical engineering applications, Elsevier, Amsterdam, Netherlands, 2020, pp. 57–97 Search PubMed.
- R. Figueira, E. Callone, C. Silva, E. Pereira and S. Dirè, Materials, 2017, 10, 306 CrossRef.
- P. Kumar, A. K. Yadav, A. G. Joshi, D. Bhattacharyya, S. N. Jha and P. C. Pandey, Mater. Charact., 2018, 142, 593–601 CrossRef CAS.
- R. B. Figueira, C. J. R. Silva and E. V. Pereira, J. Coat. Technol. Res., 2014, 12, 1–35 Search PubMed.
- R. B. Figueira and C. J. R. Silva, in Hybrid Organic-Inorganic Interfaces, Wiley-VCH Verlag GmbH & Co. KGaA, Weinheim, Germany, 2017, pp. 355–412 Search PubMed.
- A. C. Ianculescu, C. A. Vasilescu, M. Crisan, M. Raileanu, B. S. Vasile, M. Calugaru, D. Crisan, N. Dragan, L. Curecheriu and L. Mitoseriu, Mater. Charact., 2015, 106, 195–207 CrossRef CAS.
- N. Boaretto, A. Bittner, C. Brinkmann, B. E. Olsowski, J. Schulz, M. Seyfried, K. Vezzù, M. Popall and V. Di Noto, Chem. Mater., 2014, 26, 6339–6350 CrossRef CAS.
- A. Mujahid, P. A. Lieberzeit and F. L. Dickert, Materials, 2010, 3, 2196–2217 CrossRef CAS.
- M. Špírková, P. Duchek, A. Strachota, R. Poręba, J. Kotek, J. Baldrian and M. Šlouf, J. Coat. Technol. Res., 2011, 8, 311–328 CrossRef.
- M. Spírková, J. Brus, D. Hlavatá, H. Kamisová, L. Matejka and A. Strachota, Surf. Coat. Int., Part B, 2003, 86, 187–193 CrossRef.
- J. Brus, M. Špírková, D. Hlavatá and A. Strachota, Macromolecules, 2004, 37, 1346–1357 CrossRef CAS.
- M. Špírková, J. Brus, D. Hlavatá, H. Kamišová, L. Matějka and A. Strachota, J. App. Polym. Sci., 2004, 92, 937–950 CrossRef.
- R. B. Figueira, C. J. R. Silva and E. V. Pereira, J. Coat. Technol. Res., 2016, 13, 355–373 CrossRef CAS.
- V. Bekiari and P. Lianos, J. Hazard. Mater., 2007, 147, 184–187 CrossRef CAS PubMed.
- A. Sánchez-Ferrer, D. Rogez and P. Martinoty, Macromol. Chem. Phys., 2010, 211, 1712–1721 CrossRef.
- P. A. Gale and C. Caltagirone, Coord. Chem. Rev., 2018, 354, 2–27 CrossRef CAS.
- D. Wu, A. C. Sedgwick, T. Gunnlaugsson, E. U. Akkaya, J. Yoon and T. D. James, Chem. Soc. Rev., 2017, 46, 7105–7123 RSC.
- J. T. Hou, W. X. Ren, K. Li, J. Seo, A. Sharma, X. Q. Yu and J. S. Kim, Chem. Soc. Rev., 2017, 46, 2076–2090 RSC.
- S. Halder, A. Hazra and P. Roy, J. Lumin., 2018, 195, 326–333 CrossRef CAS.
- P. Molina, A. Tárraga and F. Otón, Org. Biomol. Chem., 2012, 10, 1711–1724 RSC.
- J. Kulhánek and F. Bureš, Beilstein, J. Org. Chem., 2012, 8, 25–49 CrossRef.
- S. Kashyap, R. Singh and U. P. Singh, Coord. Chem. Rev., 2020, 417, 213369 CrossRef CAS.
- N. Fridman, M. Kaftory and S. Speiser, Sens. Actuators, B, 2007, 126, 107–115 CrossRef CAS.
- T. Cai, A. Hatano, K. Kanatsu and T. Tomita, J. Biochem., 2020, 167, 463–471 CrossRef CAS.
- R. M. F. Batista, S. P. G. Costa, M. Belsley, C. Lodeiro and M. M. M. Raposo, Tetrahedron, 2008, 64, 9230–9238 CrossRef CAS.
- R. M. F. Batista, S. P. G. Costa, M. Belsley and M. M. M. Raposo, Dyes Pigm., 2009, 80, 329–336 CrossRef CAS.
- J. Pina, J. S. Seixas De Melo, R. M. F. Batista, S. P. G. Costa and M. M. M. Raposo, J. Phys. Chem. B, 2010, 114, 4964–4972 CrossRef CAS.
- R. C. M. Ferreira, S. P. G. Costa, H. Gonçalves, M. Belsley and M. M. M. Raposo, New J. Chem., 2017, 41, 12866–12878 RSC.
- B. Pedras, R. M. F. Batista, L. Tormo, S. P. G. Costa, M. M. M. Raposo, G. Orellana, J. L. Capelo and C. Lodeiro, Inorg. Chim. Acta, 2012, 381, 95–103 CrossRef CAS.
- X. Moreira, P. Santos, M. A. F. Faustino, M. M. M. Raposo, S. P. G. Costa, N. M. M. Moura, A. T. P. C. Gomes, A. Almeida and M. G. P. M. S. Neves, Dyes Pigm., 2020, 178, 108330 CrossRef CAS.
- E. Oliveira, R. M. F. Baptista, S. P. G. Costa, M. M. M. Raposo and C. Lodeiro, Inorg. Chem., 2010, 49, 10847–10857 CrossRef CAS PubMed.
- R. M. F. Batista, E. Oliveira, S. P. G. Costa, C. Lodeiro and M. M. M. Raposo, Tetrahedron, 2011, 67, 7106–7113 CrossRef CAS.
- R. M. F. Batista, E. Oliveira, S. P. G. Costa, C. Lodeiro and M. M. M. Raposo, Talanta, 2011, 85, 2470–2478 CrossRef CAS PubMed.
- C. Marín-Hernández, L. E. Santos-Figueroa, M. E. Moragues, M. M. M. Raposo, R. M. F. Batista, S. P. G. Costa, T. Pardo, R. Martínez-Máñez and F. Sancenón, J. Org. Chem., 2014, 79, 10752–10761 CrossRef PubMed.
- C. I. C. Esteves, M. M. M. Raposo and S. P. G. Costa, Dyes Pigm., 2016, 134, 258–268 CrossRef CAS.
- C. I. C. Esteves, R. M. F. Batista, M. M. M. Raposo and S. P. G. Costa, Dyes Pigm., 2016, 135, 134–142 CrossRef CAS.
- H. E. Okda, S. El Sayed, R. C. M. Ferreira, S. P. G. Costa, M. M. Raposo, R. Martínez-Máñez and F. Sancenón, Dyes Pigm., 2018, 159, 45–48 CrossRef CAS.
- H. E. Okda, S. El Sayed, I. Otri, R. C. M. Ferreira, S. P. G. Costa, M. M. M. Raposo, R. Martínez-Máñez and F. Sancenón, Dyes Pigm., 2019, 162, 303–308 CrossRef CAS.
- H. E. Okda, S. El Sayed, R. C. M. Ferreira, R. C. R. Gonçalves, S. P. G. Costa, M. M. M. Raposo, R. Martínez-Máñez and F. Sancenón, New J. Chem., 2019, 43, 7393–7402 RSC.
- H. E. Okda, S. El Sayed, I. Otri, R. C. M. Ferreira, S. P. G. Costa, M. M. M. Raposo, R. Martínez-Máñez and F. Sancenón, Polyhedron, 2019, 170, 388–394 CrossRef CAS.
- Y. Ge, P. Wei, T. Wang, X. Cao, D. Zhang and F. Li, Sens. Actuators, B, 2018, 254, 314–320 CrossRef CAS.
- A. J. Beneto, V. Thiagarajan and A. Siva, RSC Adv., 2015, 5, 67849–67852 RSC.
- E. Horak, P. Kassal, M. Hranjec and I. M. Steinberg, Sens. Actuators, B, 2018, 258, 415–423 CrossRef CAS.
- D. Pfeifer, I. Klimant and S. M. Borisov, Chem. -Eur. J., 2018, 24, 10711–10720 CrossRef CAS.
- R. P. C. L. Sousa, B. Ferreira, M. Azenha, S. P. G. Costa, C. J. R. Silva and R. B. Figueira, Polymers, 2020, 12, 371 CrossRef CAS PubMed.
- B. R. Gomes, R. B. Figueira, S. P. G. Costa, M. M. M. Raposo and C. J. R. Silva, Polymers, 2020, 12, 2671 CrossRef CAS PubMed.
- J. V. Morris, M. A. Mahaney and J. R. Huber, J. Phys. Chem., 1976, 80, 969–974 CrossRef CAS.
- D. Yanover and M. Kaftory, Acta Crystallogr., Sect. E: Struct. Rep. Online, 2009, 65, o711 CrossRef CAS.
- F. Recio, C. Alonso, L. Gaillet and M. Sánchez Moreno, Corros. Sci., 2011, 53, 2853–2860 CrossRef CAS.
- M. Sánchez, M. C. Alonso, P. Cecílio, M. F. Montemor and C. Andrade, Cem. Concr. Compos., 2006, 28, 256–266 CrossRef.
- J. Coates, in Encyclopedia of Analytical Chemistry, American Cancer Society, 2006 Search PubMed.
- S. D. F. C. Moreira, C. J. R. Silva, L. A. S. A. Prado, M. F. M. Costa, V. I. Boev, J. Martín-Sánchez and M. J. M. Gomes, J. Polym. Sci., Part B: Polym. Phys., 2012, 50, 492–499 CrossRef CAS.
- B. Arkles and G. Larson, Silicon Compounds: Silanes & Silicones, Gelest Inc., Morrisville PA, 3rd edn, 2013 Search PubMed.
- V. Bekiari, P. Lianos, U. Lavrencic Stangar, B. Orel and P. Judeinstein, Chem. Mater., 2000, 12, 3095–3099 CrossRef CAS.
- L. D. Carlos, V. de Zea Bermudez, R. A. Sá Ferreira, L. Marques and M. Assunção, Chem. Mater., 1999, 11, 581–588 CrossRef CAS.
- J. R. Macdonald, Impedance Spectroscopy Emphasizing Solid Materials and Analysis, John Wiley & Sons, Ltd, New York, NY, USA, 1987 Search PubMed.
- R. B. Figueira, C. J. Silva, E. V. Pereira and M. M. Salta, J. Electrochem. Soc., 2013, 160, C467–C479 CrossRef CAS.
- R. B. Figueira, C. J. Silva, E. V. Pereira and M. M. Salta, J. Electrochem. Soc., 2014, 161, C349–C362 CrossRef CAS.
- M. E. Orazem and B. Tribollet, Electrochemical Impedance Spectroscopy, Wiley, 2008 Search PubMed.
- B. Hirschorn, M. E. Orazem, B. Tribollet, V. Vivier, I. Frateur and M. Musiani, Electrochim. Acta, 2010, 55, 6218–6227 CrossRef CAS.
- U. Thanganathan, J. Mater. Chem., 2012, 22, 9684–9689 RSC.
- N. M. José, L. A. S. de Almeida Prado, M. A. Schiavon, S. U. A. Redondo and I. V. P. Yoshida, J. Polym. Sci., Part B: Polym. Phys., 2007, 45, 299–309 CrossRef.
- L. A. S. A. De Prado, I. L. Torriani and I. V. P. Yoshida, J. Polym. Sci., Part A: Polym. Chem., 2010, 48, 1220–1229 CrossRef CAS.
- H. F. W. Taylor, C. Famy and K. L. Scrivener, Cem. Concr. Res., 2001, 31, 683–693 CrossRef CAS.
Footnotes |
| † This paper is dedicated to the memory of Professor Carlos J. R. Silva who suddenly passed away on August 27th, 2020. |
| ‡ Presently at Vasco da Gama CoLAB, Rua Roberto Frias, 4200-465 Porto, Portugal. |
| This journal is © The Royal Society of Chemistry 2021 |


