 Open Access Article
Creative Commons Attribution 3.0 Unported Licence
Study of the influence of 2.5% Mg2+ insertion in the B-site of La0.8Ca0.1Pb0.1FeO3 on its structural, electrical and dielectric properties†
H. Issaoui ab,
A. Benalibc,
F. Issaouid,
E. Dhahrib,
B. F. O. Costaa,
M. P. F. Gracac,
M. A. Valentec and
Mohamed Lamjed Bouazizie
aUniversity of Coimbra, CFisUC, Physics Department, P-3004-516 Coimbra, Portugal
bLaboratoire de Physique Appliquée, Faculté des Sciences, Université de Sfax, B.P. 1171, 3000 Sfax, Tunisia
cI3N and Physics Department, University of Aveiro, 3810-193, Aveiro, Portugal
dResearch Unit Valorization and Optimization of Resource Exploitation, Faculty of Science and Technology of Sidi Bouzid, University of Kairouan, Sidi Bouzid, 9100, Tunisia
eCollege of Engineering, Prince Sattam Bin Abdulaziz University, 655, Al Kharj, 11942, Saudi Arabia
First published on 7th October 2021
Abstract
This work involves the synthesis and study of physical properties of the La0.8Ca0.1Pb0.1Fe0.975Mg0.025O3 compound, which has been characterized by various experimental techniques, such as X-ray diffraction, SEM and complex impedance spectroscopy. The structural study showed that the La0.8Ca0.1Pb0.1Fe0.975Mg0.025O3 compound crystallized in the orthorhombic structure with the Pnma space group. The particle size and the surface morphology of this compound have been analysed using SEM. The particle size was found to be around 120 nm and we confirmed that one particle contains more than one crystallite. Importantly, the studied compound presented a giant dielectric permittivity (ε′ of around 9 × 10⁴ at high temperature and low frequencies). An equivalent electric circuit has been deduced from the Nyquist plots of the complex impedance parts (Z′′ vs. Z′) to correctly describe the electrical behavior of the La0.8Ca0.1Pb0.1Fe0.975Mg0.025O3 compound. The chosen circuit consists of two cells mounted in series corresponding to the grain and grain boundary contributions. The electrode contribution has been detected from the frequency dependence of the imaginary part of modulus where the activation energy of each constitution has been calculated. The relaxation process and the electrical conductivity are attributed to the same type of charge carriers characterized by similar values of the activation energy determined from loss factor tangent (tg(δ)), the imaginary part of the permittivity and the modulus spectrum.
1 Introduction
Mixed valence oxides, of general formula A1−xMxFeO3, with A = La, and M = Ca and Pb, have attracted significant attention due to their interesting structural and physical properties, such as ferromagnetism with metallic conduction, the order of charge, the Colossal magnetoresistance (CMR)1–23 and the magnetocaloric effect (MCE).4–10 In this context, a great effort has been made on the iron oxides of formula LaFeO3 and their derivatives, both from the structural point of view and their physical properties, which have proved to be of interest, for example in the field of gas sensors. Moreover, this kind of material offers a major advantage, which is the possibility of modifying their physical properties by substitutions based on a good choice of the dopant, of the doping site and of the concentration of the dopant.11–13 Indeed, doped LaFeO3 is known for its electrocatalytic activities.In this regard, it is important to note that the substitution of LaFeO3 compound generates new structural, magnetic and dielectric properties. For example, the insertion of Ca into the A-site, reported by Andoulsi et al.14 and by Shi et al.,15 reduced the electrical resistance and improved the magnetic properties. Also, Benali et al.16 studied the effect of the introduction of lead cations in the A-site of the compound La0.8Ca0.1FeO3, on the structural, dielectric and gas detection properties. They found that insertion of the Pb ion into the A-site can restrict grain size growth and improve the response to ethanol gas. The best response to ethanol was obtained for a level equal to 0.1 mol of Pb. These properties are further improved with the cobalt cation substitution in the B-site of the compound La0.8Ca0.1Pb0.1FeO3;17 further more detailed investigations18,19 have shown that La1−xPbxFeO3 systems are of interest for the study thanks to these important physical properties for many applications and their high functional properties.
For this reason, the substitution of this type of compound has attracted a great deal of interest in recent years and several researchers are concentrating on improving these properties by the process of substitution in one or both A and B-sites.20–22
Here, we are looking essentially to enhance the electrical and dielectric properties of these materials by replacing the iron cations with those of magnesium. In fact, this is a continuation of the research conducted by our laboratory team to optimize the appropriate composition for a desired application. Therefore, the aim of this manuscript was to study the effect of the insertion of the 2.5% Mg cation into the B-site of the La0.8Ca0.1Pb0.1FeO3 compound, synthesized by the sol–gel method and annealed at 800 °C, on the structural and dielectric properties.
2 Experimental details
2.1 Sample preparation
The sol–gel technique23,24 is a process for developing solid nano-powder materials from an aqueous solution containing the starting precursors. This process is carried out under so-called soft chemistry conditions (temperatures very close to room temperature). The reaction takes place according to the following chemical equation:| 0.8La(NO3)3 + 0.1Ca(NO3)2 + 0.1Pb(NO3)2 + 0.975Fe(NO3)2 + 0.025Mg(NO3)2 → La0.8Ca0.1Pb0.1Fe0.975Mg0.025O3 + gases |
The La0.8Ca0.1Pb0.1Fe0.975Mg0.025O3 compound was prepared by mixing stoichiometric amounts of La(NO3)3, Ca(NO3)2, Pb(NO3)2, Fe(NO3)3 and Mg(NO3)2 in distilled water (all reagents are obtained from Sigma-Aldrich with a purity higher than 99.6%). The citric acid was added with maintaining a ratio of n (La3+, Ca2+, Pb2+, Fe3+, and Mg2+)![[thin space (1/6-em)]](https://www.rsc.org/images/entities/char_2009.gif) :
:![[thin space (1/6-em)]](https://www.rsc.org/images/entities/char_2009.gif) n (citric acid) = 1
n (citric acid) = 1![[thin space (1/6-em)]](https://www.rsc.org/images/entities/char_2009.gif) :
:![[thin space (1/6-em)]](https://www.rsc.org/images/entities/char_2009.gif) 2. The ethylene glycol was added to further assure the homogeneity of the solution. The obtained mixture was then heated at 70 °C until a viscous brown gel was formed. Heated at 170 °C, the gel was slowly transformed into a fine black powder and heated for 12 hours at 300 °C in order to decompose the organic residuals. Then, the resulting powder was ground and using an uniaxial pressure system (approximately 2 tones per cm2), pellets of approximately 8 mm in diameter and 1.8 mm in thickness were made and submitted to heat treatments at different temperatures of 600 °C (12 hours) and 800 °C (12 hours).The phase purity of the prepared compound was checked by X-Ray Diffraction (XRD) analysis (Siemens D5000 X-ray diffractometer, with monochromatic Cu-Kα radiation (λ = 1.5406 Å)).
2. The ethylene glycol was added to further assure the homogeneity of the solution. The obtained mixture was then heated at 70 °C until a viscous brown gel was formed. Heated at 170 °C, the gel was slowly transformed into a fine black powder and heated for 12 hours at 300 °C in order to decompose the organic residuals. Then, the resulting powder was ground and using an uniaxial pressure system (approximately 2 tones per cm2), pellets of approximately 8 mm in diameter and 1.8 mm in thickness were made and submitted to heat treatments at different temperatures of 600 °C (12 hours) and 800 °C (12 hours).The phase purity of the prepared compound was checked by X-Ray Diffraction (XRD) analysis (Siemens D5000 X-ray diffractometer, with monochromatic Cu-Kα radiation (λ = 1.5406 Å)).
2.2 Characterization tools
The X-Ray Diffraction (XRD) patterns of the prepared powder were recorded at room temperature using a Siemens D5000 diffractometer with a copper anticathode over the 10°–100° Bragg angle range. The morphology of the sample was examined using a TESCAN VEGA3 SBH scanning electron microscope (SEM) equipped with an EDS detector BrukerXFlash 410 M for analysing the elemental composition and homogeneity of the prepared sample.For dielectric measurements, two conducting silver layers were coated on both sides of the prepared pellet. Then, the transport properties of the studied materials were measured using an Agilent 4294A in the frequency range 100 Hz–1 MHz and the temperature range 200 K–400 K using a nitrogen bath cryostat setup. During the measurements, the samples were kept under a helium atmosphere to minimize thermal gradients and the temperature of the samples was controlled using an Oxford Research IT-C4 and measured using a platinum sensor.25–27
3 Structural characterization
3.1 Structural study
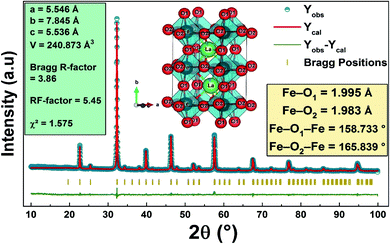
The purity and good crystallization of our synthetized compound were systematically verified using a diffractometer driven from a copper anticathode and a back graphite monochromator. X-ray diffractogram recording was performed at room temperature. The angular range varies from 10° to 90° and the recording time is 10 seconds in steps of 0.02°. The used refinement program, FULLPROF,28 is derived from the Rietveld method.Fig. 1 reveals that the diffractogram obtained from the compound La0.8Ca0.1Pb0.1Fe0.975Mg0.025O3 is almost identical to that of the compound La0.8Ca0.1Pb0.1FeO3 studied by A. Benali et al.29 with a slight modification of the positions of the peaks following the insertion of magnesium.
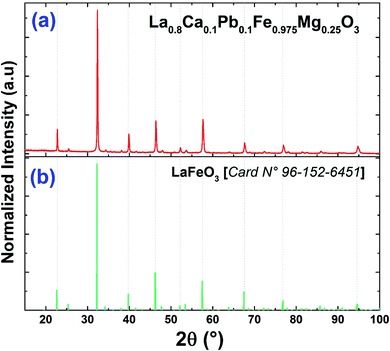 | ||
| Fig. 1 X-ray diffractograms of (a) the La0.8Ca0.1Pb0.1Fe0.975Mg0.025O3 compound and (b) the standard data of LaFeO3.49 | ||
Recall that Benali et al. confirmed the existence of two Ca2Fe2O5 and Fe3O4 secondary phases in addition to the La0.8Ca0.1Pb0.1FeO3 main phase detected using X-pert Highscore phase identification software. These secondary phases are at very low percentages compared to the main phase. We note that the substitution of iron by magnesium in the La0.8Ca0.1Pb0.1Fe0.975Mg0.025O3 compound does not modify the main phase and the secondary phases, which remain the same as those found for the case of the parent compound. As can be seen, the peak intensities of the two secondary phases decrease following the substitution of iron by magnesium.
Fig. 2 shows the refinement diagram of the La0.8Ca0.1Pb0.1Fe0.975Mg0.025O3 compound, where the experimental diffractogram is represented in red, the calculated one in a solid black line, their difference in blue and the positions of the Bragg lines in green. The main phase refinement was performed following the orthorhombic structure with the Pnma space group. The main phase refinement results are summarized in Table 1. The substitution of iron by magnesium in the La0.8Ca0.1Pb0.1FeO3 compound generates the reduction of the mesh parameters and of its volume.
| X | 0.00 | 0.025 |
|---|---|---|
| Space group | Pbnm | Pbnm |
| a (Å) | 5.539 (1) | 5.546 (0) |
| b (Å) | 7.831 (0) | 7.845 (3) |
| c (Å) | 5.543 (4) | 5.536 (0) |
| V (Å3) | 60.120 (6) | 60.218 (2) |
3.2 Calculation of grain size
The grain size was calculated by Scherrer's formula30 based on the X-ray diffraction data of the most intense peak:
 | (1) |
The average crystallite size obtained from Scherrer's formula was found to be equal to DSC = 40.87 nm while the grain size of the parent compound La0.8Ca0.1Pb0.1FeO3 is DSC = 37.42 nm. It is clear then that the insertion of magnesium with an atomic radius greater than that of iron, even at a low concentration, increases the grain size.
3.3 Calculation of porosity
In order to evaluate the porosity p of our compounds, we started by calculating the density dx of the compounds from the following relation:31
 | (2) |
 | (3) |
 | (4) |
| X | dx (g cm−3) | d (g cm−3) | Porosity p (%) |
|---|---|---|---|
| 0.00 | 2.333 | 0.838 | 64.08 |
| 0.025 | 2.181 | 0.838 | 61.59 |
3.4 Morphological study
After preparation, a morphological study with a scanning electron microscope of the TESCAN VEGA3 SBH type is carried out on the La0.8Ca0.1Pb0.1Fe0.975Mg0.025O3 compound, in order to have an overview on the particle size and the morphology of the compound surface.Fig. 3(a) shows that the grains are contiguous and present different polygonal and cubic shapes. The average particle size was calculated from these images using “Image J” software which allowed us to plot a histogram of the average size as a function of the number of grains considered as shown in Fig. 3(c).
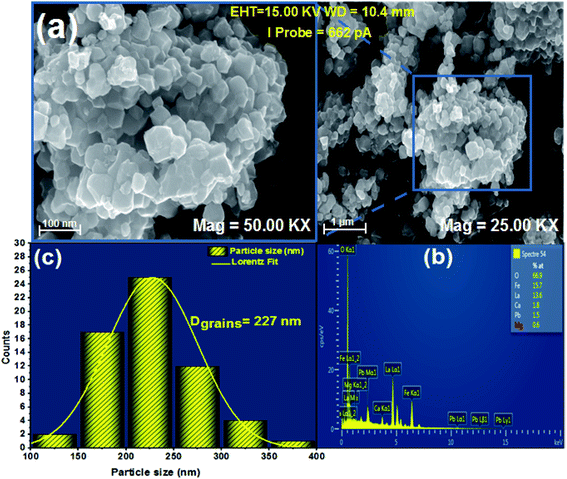 | ||
| Fig. 3 (a) SEM image, (b) EDX analysis of the compound La0.8Ca0.1Pb0.1Fe0.975Mg0.025O3 and (c) size distribution histogram. | ||
The average particle size determined from the SEM image is larger than that calculated using the Scherrer formula (DSC). This difference is probably due to the fact that each grain observed by the SEM is made up of a set of small-crystallized grains.
The elemental compositions of the synthesized sample were carefully analysed by energy dispersive spectroscopy (EDS), as shown in Fig. 3(b). This spectrum allowed the detection of the presence of all chemical elements for our compound. This shows the success of Mg-substitution in the La0.8Ca0.1Pb0.1Fe0.975Mg0.025O3 compound.
4 Dielectric study
4.1 Z′′in terms of Z′′
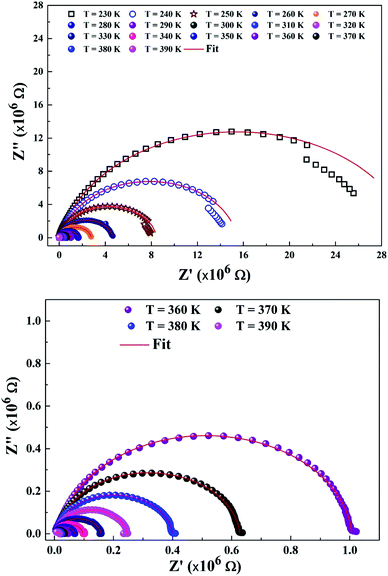
To explain the electrical behavior of a material, Bauerle proposed simple electrical circuits made up of resistors and capacitors.32 The equivalent circuit, therefore, makes it possible to establish a correlation between the electrochemical parameters and the characteristic elements of the impedance. Indeed, in order to take into account the physical phenomena responsible for conduction and relaxation phenomena, we analysed the real and imaginary parts of the impedance data using Z-view software.33 We show in Fig. 4 the variation of the imaginary part of impedance Z′′ as a function of the real part of impedance Z′ for different temperatures. In accordance with literature results, the best fit of the impedance Nyquist plots was found when using two combinations of two electrical cells; each one contains a resistance (R) connected in parallel with a capacitance (CPE) as described in Fig. 5. Each electric cell describes the electrical properties and the relaxation process of one contribution in the La0.8Ca0.1Pb0.1Fe0.975Mg0.025O3 compound. Note that the two contributions are the grain and grain boundary and that the error of all calculated parameters (Table 3) was less than 4%.| T (K) | Rjg (×105 Ω) | CPE jg (×10−11F) | α | Rg (×103 Ω) | Cg (×10−10 F) | α |
|---|---|---|---|---|---|---|
| 240 | 150 | 2.3 | 0.92 | 353.870 | 1.2 | 0.88 |
| 250 | 82.8 | 2.27 | 0.93 | 167.900 | 1.07 | 0.889 |
| 260 | 45.1 | 2.05 | 0.96 | 66.125 | 1.18 | 0.875 |
| 270 | 26.8 | 2.05 | 0.95 | 114.700 | 1.1 | 0.877 |
| 280 | 15.7 | 1.86 | 0.96 | 48.630 | 1.6 | 0.849 |
| 290 | 9.822 | 2.03 | 0.957 | 24.528 | 1.63 | 0.860 |
| 300 | 6.140 | 2.15 | 0.954 | 13.492 | 1.15 | 0.888 |
| 310 | 3.889 | 2.2 | 0.9546 | 9.492 | 2.06 | 0.853 |
| 320 | 2.40340 | 2.44 | 0.95 | 5.507 | 3.38 | 0.820 |
| 330 | 1.55040 | 2.82 | 0.938 | 2.462 | 0.253 | 0.983 |
| 340 | 0.91766 | 2.07 | 0.966 | 4.783 | 70.9 | 0.657 |
| 350 | 0.56745 | 1.77 | 0.98 | 11.926 | 51.6 | 0.674 |
| 360 | 0.36700 | 1.65 | 0.996 | 9.720 | 53.3 | 0.674 |
| 370 | 0.31720 | 2.72 | 0.947 | 0.506 | 0.267 | 1.358 |
| 380 | 0.23444 | 2.13 | 0.965 | 0.706 | 0.152 | 0.5 |
| 390 | 0.17185 | 2.437 | 1.7185 | 0.510 | 4.4 | 0.959 |
In the low frequency region, the semicircle with high diameter corresponds to the grain boundary contribution (Rgb) whereas at higher frequencies the electrical response is due to the grain contribution (Rg) as it previously confirmed.34,35
From the results regrouped in Table 3, one can see that the grain boundary resistance (Rgb) values are much higher than those of the grains (Rg) and that both resistance values decreased by increasing the temperature. This confirms well the p-type semiconductor nature of the La0.8Ca0.1Pb0.1Fe0.975Mg0.025O3 compound.
Furthermore, we present in Fig. 6 the logarithmic variation of both Rgb and Rg as a function of 1000/T. For both contributions, we found that the resistance linearly follows the increase in temperature, indicating an Arrhenius power law as can be described as follows:36
 | (5) |
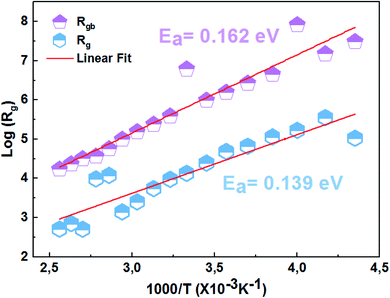 | ||
| Fig. 6 Log(R) variation as a function of 1000/T of grain contributions and grain boundaries of the La0.8Ca0.1Pb0.1Fe0.975Mg0.025O3 compound. | ||
It can be seen that the calculated activation energy value related to the grain boundary contribution is greater than that of the grain contribution.
4.2 Variation of the real part of impedance Z′
Fig. 7 presents the variation of the real part of impedance (Z′) as a function of the frequency at different temperatures of the La0.8Ca0.1Pb0.1Fe0.975Mg0.025O3 compound. As can be seen in Fig. 7, the real part of the impedance decreases with increasing frequency and temperature, indicating the increase in conductivity σac.37 At higher frequencies, the coincidence of impedance (Z′) for all temperatures indicates a possible release of space charges.38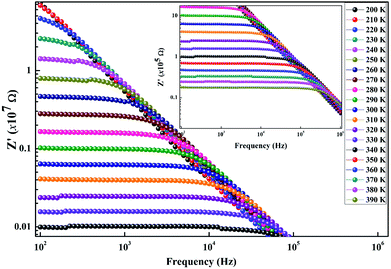 | ||
| Fig. 7 Variation of the real impedance part (Z′) as a function of the frequency at different temperatures of the La0.8Ca0.1Pb0.1Fe0.975Mg0.025O3 compound. | ||
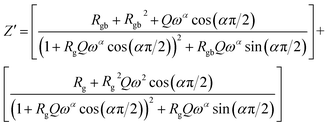
Considering the equivalent circuit adopted we can write the characteristic equation of the variation of the real part of impedance Z′.
 | (6) |
4.3 Variation of the imaginary part of impedance Z′′
To better understand the relaxation phenomenon in the La0.8Ca0.1Pb0.1Fe0.975Mg0.025O3 compound, we have presented in Fig. 8 the variation of the imaginary part of impedance (Z′′) as a function of the frequency at different temperatures. By examining these curves, we observe the appearance of a relaxation peak (Z′′max), which moves towards high frequencies when the temperature increases. According to the literature,39–42 the displacement of the relaxation peak confirms the existence of a Debye relaxation phenomenon within the material. This process is probably due to the presence of electrons and/or stationary space charges at low temperatures.43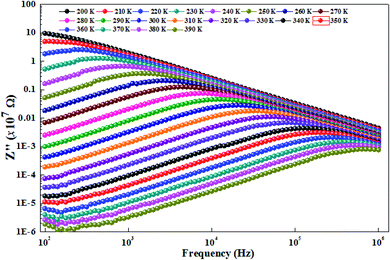 | ||
| Fig. 8 Variation of the imaginary impedance part (Z′′) as a function of the frequency at different temperatures of the La0.8Ca0.1Pb0.1Fe0.975Mg0.025O3 compound. | ||
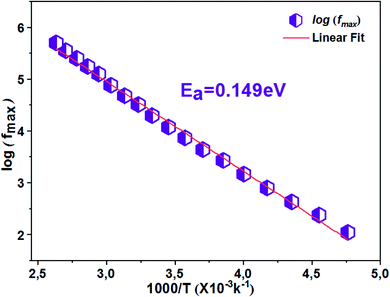
The thermal variation of log(fmax) (Fig. 9) is linear which follows Arrhenius' law:
 | (7) |
From this variation, we have deduced that the activation energy is around Ea = 0.149 eV.
4.4 Complex modulus analysis
The complex modulus can be written as a real component M′ and an imaginary component:| M* = 1/ε* = jωC0Z* = M′ + jM′′ | (8) |
| M′′ = ωC0Z′, C0 = ε0S/e | (9) |
Fig. 10 shows the variation of M′ as a function of frequency for different temperatures. The curves clearly show a very low M′ value in the low frequency region and an increase in the value of M′ in the high frequency region. In addition, the value of M′ decreases with increasing temperature and the curves are well dispersed in which the region of dispersion shifts towards higher frequencies with an increase in temperature. This behavior supports the long-distance mobility of charge carriers. The dispersive nature of the modulus implies a well-defined relaxation mechanism over several decades of frequency for all temperatures.
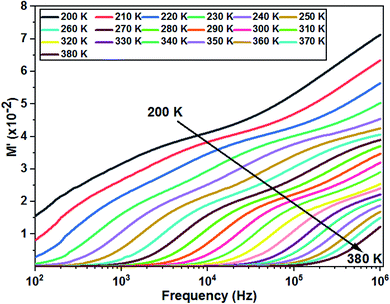 | ||
| Fig. 10 Variation of the real part of modulus as a function of the frequency at different temperatures of the La0.8Ca0.1Pb0.1Fe0.975Mg0.025O3 compound. | ||
Fig. 11 shows the variation of the imaginary part of the complex modulus (M′′) with frequency at different temperatures. The M′′(f) curves are characterized by well resolved peaks in the pattern occurring at a single frequency for each temperature. Those at low frequencies are associated with grain boundary effects and the peaks observed towards high frequencies are correlated with grain contribution.
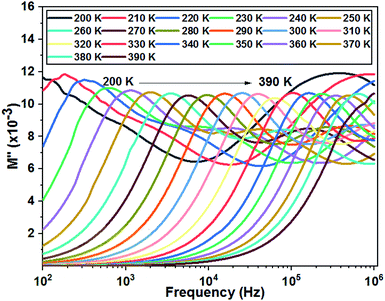 | ||
| Fig. 11 Variation of the imaginary part of modulus as a function of the frequency at different temperatures of the La0.8Ca0.1Pb0.1Fe0.975Mg0.025O3 compound. | ||
The logarithmic variations of the frequencies corresponding to the peaks as a function of the inverse of the temperature are given in Fig. 12. These variations represent straight lines following the Arrhenius law, whose slopes will be used to calculate the activation energy:
 | (10) |
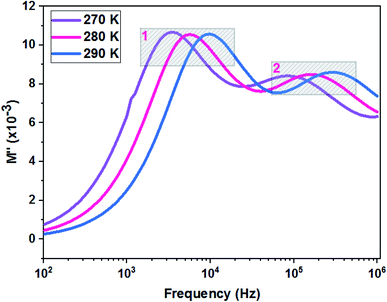 | ||
| Fig. 12 Relaxation peaks: 1 are associated with grain boundary effects and 2 are correlated with grain contribution of the La0.8Ca0.1Pb0.1Fe0.975Mg0.025O3 compound. | ||
We deduce from the slopes of the lines of log(f) as a function of temperature the activation energies of grains (Eg = 0.140 eV) and grain boundaries (Egb = 0.152 eV). These two values are very close to those determined previously from the resistances of two contributions and from Z′′ curves. This proves the good fit of the Nyquist and that the equivalent circuit is the most adequate (Fig. 13).
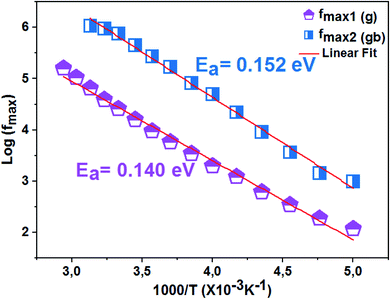 | ||
| Fig. 13 Variation of log(f) as a function of 1000/T of the La0.8Ca0.1Pb0.1Fe0.975Mg0.025O3 compound. | ||
4.5 Loss factor variation as a function of frequency
The dissipation factor tg(δ) is a complementary element for the study of the permittivity in order to determine the presence of the relaxation phenomenon in the material. Fig. 14 presents the variation of the loss factor tg(δ) as a function of the frequency at different temperatures. These curves clearly show the increase in dielectric losses in the low frequency region and the decrease in the latter in the high frequency region.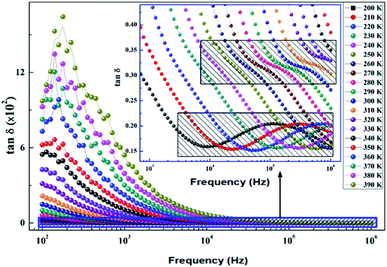 | ||
| Fig. 14 Variation of dielectric losses tg(δ) as a function of frequency at different temperatures of the La0.8Ca0.1Pb0.1Fe0.975Mg0.025O3 compound. | ||
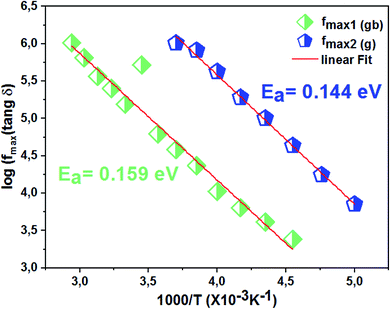
To determine the activation energy (Ea) we plot the curves of log(f) = f(1/T) (Fig. 15). The Ea values, calculated from the slopes of these curves, are found to be equal to Eg = 0.144 eV for the grains and Egb = 0.159 eV for the grain boundaries.
4.6 Dependence of conductivity on frequency
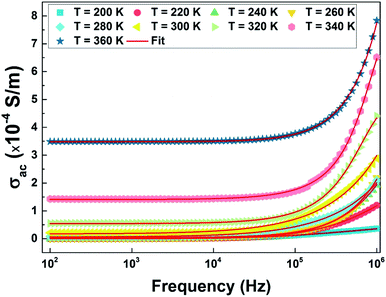
The measurement of the conductivity σac (Fig. 16) was carried out using impedance spectroscopy in the frequency range of 40 Hz–1 Mz and a temperature range of 100 to 400 K.We notice that at low frequency, the conductivity is independent of the frequency and has a wide plateau corresponding to a uniform conductance dependent on the temperature. In this case, only the diffusive aspect of ionic transport is considered and the conductivity σac is equal to the static conductivity (σac = σdc). On the other hand, we note that the value of σac increases with increasing temperature which is a characteristic of a thermally activated conduction process. However, at high frequencies the value of conductivity increases with frequency according to a power law Aωs. This regime represents the displacement current, and the conductivity is equal to the dynamic conductivity σdc.
Consequently, the conductivity σac of our compound is described according to the approach of Jonscher's law44 by the sum of two terms and is then written as
| σac = σdc + Aωs | (11) |
The exponent s is related to the variation of the polarizability induced in the material. This dimensionless parameter is generally used to characterize the electrical conduction mechanism throughout the material. In the high frequency range, the conductivity σac obeys the type of law:
| σac(ω) = Aωs | (12) |
This type of variation is characteristic of the jump conduction process. The increase in conductance with temperature indicates thermal activation of the conduction process in this material.
We performed an adjustment of the curves as shown in Fig. 16 using eqn (12) with ORIGIN8.0 software. The refinement results are shown in Table 4.
| T (K) | σdc (S m−1) | A | S |
|---|---|---|---|
| 200 | 8.050 × 10⁻⁷ | 2.996 × 10⁻¹⁰ | 0.454 |
| 220 | 7.123 × 10⁻⁷ | 3.639 × 10⁻¹⁰ | 0.497 |
| 240 | 6.562 × 10⁻⁶ | 3.933 × 10⁻¹⁰ | 0.527 |
| 260 | 1.654 × 10⁻⁶ | 6.133 × 10⁻¹⁰ | 0.571 |
| 280 | 8.731 × 10⁻⁵ | 9.553 × 10⁻¹⁰ | 0.612 |
| 300 | 3.726 × 10⁻⁵ | 1.112 × 10⁻⁹ | 0.648 |
| 320 | 1.098 × 10⁻⁵ | 6.023 × 10⁻⁹ | 0.699 |
| 340 | 7.906 × 10⁻⁴ | 7.906 × 10⁻⁹ | 0.761 |
| 360 | 2.487 × 10⁻⁴ | 2.487 × 10⁻⁹ | 0.791 |
By examining the values of the parameter “s” we notice that it increases with increasing temperature.45 Hence, the small tunnel polaron jump model (NSPT) is the most suitable model.
According to this model, the variation of this parameter as a function of the temperature can be written as follows:46–48
 | (13) |
For large values of Wm/kBT, this equation becomes
 | (14) |
In order to determine Wm, we have plotted in Fig. 17 the variation of S as a function of temperature.
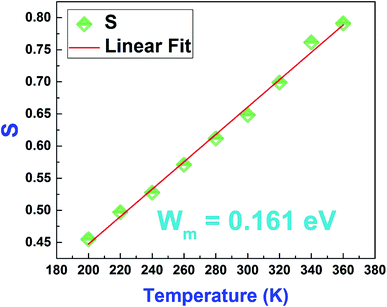 | ||
| Fig. 17 Variation of the Jonscher's power law exponent “S” as a function of temperature of the La0.8Ca0.1Pb0.1Fe0.975Mg0.025O3 compound. | ||
Based on equation eqn (14), the values of Wm (polaron energy) are determined using the slope of the curves S(T) and the obtained value was found to be around 0.161 eV.
5 Conclusion
This work focused on the development and study of the physical properties of the La0.8Ca0.1Pb0.1Fe0.975 Mg0.025O3 compound, which has been characterized by various experimental techniques such as X-ray diffraction, SEM and complex impedance spectroscopy. The XRD study showed that this compound crystallized in the orthorhombic structure with the Pnma space group. It is found that the grain sizes, determined from the SEM images, are much greater than those calculated by the Scherrer formula (DSC). This difference was related to the fact that each grain observed by the SEM is made up of a set of small crystallized grains. The study of the variation of the real part Z′ and imaginary Z′′ of the complex impedance of the La0.8Ca0.1Pb0.1Fe0.975 compound as a function of the frequency allowed us to define the equivalent circuit. The circuit chosen is made up of two cells connected in series. The first circuit is formed by a parallel combination of a resistance R1 and a fractal capacitance CPE1 related to the contribution of the grains. The second one consists of a resistor R2 and a fractal capacitor CPE2 mounted in parallel, which corresponds to the contribution of the grain boundaries. From the impedance spectroscopy measurements, we determined the different dielectric parameters to know the conductivity σac, the complex impedance Z, the complex modulus M and dielectric losses. The electrical properties of our materials have been found to be highly dependent on temperature and frequency.Conflicts of interest
There are no conflicts to declare.References
- J. Mira, J. Rivas, F. Rivadulla and C. VaHzquez, Change from first-to second-order magnetic phase transition in La2/3(Ca,Sr)1/3MnO3 perovskites, Phys. Rev. B: Condens. Matter Mater. Phys., 1999, 60, 2929 CrossRef.
- K. Chahara, T. Ohno, M. Kasai and Y. Kosono, Magnetoresistance in magnetic manganese oxide with intrinsic antiferromagnetic spin structure, Appl. Phys. Lett., 1993, 63, 1990 CrossRef CAS.
- R. von Helmolt, J. Weeker, B. Holzapfel, L. Schultz and K. Samwer, Giant negative magnetoresistance in perovskite like La2/3Ba1/3MnOx ferromagnetic films, Phys. Rev. Lett., 1993, 71, 2331 CrossRef CAS PubMed.
- M. Bejar, R. Dhahri, E. Dhahri, M. Balli and E. K. Hlil, Large magnetic entropy change at room temperature in La0. 7Ca0.3−xKxMnO3, J. Alloys Compd., 2007, 442, 136 CrossRef CAS.
- S. Othmani, R. Blel, M. Bejar, M. Sajieddine, E. Dhahri and E. K. Hlil, New complex magnetic materials for an application in Ericsson refrigerator. Solid state communications, Solid State Commun., 2009, 149, 969 CrossRef CAS.
- H. Issaoui, F. Issaoui, E. Dhahri and E. K. Hlil, Structural and Magnetic Characterizations of Ruddlesden–Popper Family (Ca2−xNdxMnO4) Compound Synthesized by Ceramic Route, J. Low Temp. Phys., 2021, 1–15 Search PubMed.
- H. Issaoui, A. Benali, M. Bejar, E. Dhahri, R. F. Santos and B. F. O. Costa, Effect of the annealing temperature and of Bi substitution on the structural and magnetic behaviors of double-doping (Bi/La,Ca)(La0.8Ca0.2)1−xBixFeO3 compounds, New J. Chem., 2020, 44(23), 9813–9821 RSC.
- A. Tozri, E. Dhahri and E. K. Hlil, Effects of vacancy and Na doping on the structural, magnetic and transport properties of La0.8Pb0.1(/Na)0.1MnO3, J. Magn. Magn. Mater., 2010, 322, 2516 CrossRef CAS.
- H. Issaoui, A. Benali, M. Bejar, E. Dhahri and B. F. O. Costa, Mössbauer and magnetic studies of (La0.8Ca0.2)1−xBixFeO3 perovskites, Hyperfine Interact., 2020, 241(1), 1–11 CrossRef.
- A. Omri, M. Bejar, M. Sajieddine, E. Dhahri, E. K. Hlil and M. Es-Souni, Structural, magnetic and magneto caloric properties of AMn1−xGaxO3 compounds with 0 ≤ x ≤ 0.2, Physica B, 2012, 407, 2566–2572 CrossRef CAS.
- A. S. Mahapatra, A. Mitra, A. Mallick, M. Ghosh and P. K. Chakrabarti, Enhanced magnetic property and phase transition in Ho3+ doped LaFeO3, Mater. Lett., 2016, 169, 160 CrossRef CAS.
- H. Wu, Z. Xia, X. Zhang, S. Huang, M. Wei, F. Yang, Y. Song, G. Xiao, Z. Ouyang and Z. Wang, Investigation of structural, morphological, optical and electrical properties of double-doping Lanthanum ferrite, Ceram. Int., 2018, 44, 146–153 CrossRef CAS.
- N. Karthikeyan, R. Ramesh Kumar, G. Jaiganesh and K. Sivakumar, Thermoelectric power factor of La0.9M0.1FeO3 (M = Ca and Ba) system: Structural, band gap and electrical transport evaluations, Physica B, 2018, 529, 1–8 CrossRef CAS.
- R. Andoulsi, K. Horchani-Naifer and M. Ferid, Electrical conductivity of La1−xCaxFeO3−δ solid solutions, Ceram. Int., 2013, 39(6), 6527–6531 CrossRef CAS.
- C. Shi, H. Qin, M. Zhao, X. Wang and J. Hu, Investigation on electrical transport, CO sensing characteristics and mechanism for nanocrystalline La1−xCaxFeO3 sensors, Sens. Actuators, B, 2014, 190, 25–31 CrossRef CAS.
- A. Benali, A. Souissi, M. Bejar, E. Dhahri and M. A. Valente, Dielectric properties and alternating current conductivity of sol–gel made La0.8Ca0.2FeO3 compound, Chem. Phys. Lett., 2015, 637, 7–12 CrossRef CAS.
- H. Saoudi, A. Benali, M. Bejar, E. Dhahri, T. Fiorido, K. Aguir and R. Hayn, Structural and NH3 gas-sensing properties of La0.8Ca0.1Pb0.1Fe1−xCoxO3 (0.00 ≤ x ≤ 0.20) perovskite compounds, J. Alloys Compd., 2018, 731, 655–661 CrossRef CAS.
- P. Song, H. Qin, L. Zhang, K. An, Z. Lin and J. Hu, The structure, electrical and ethanol-sensing properties of La1−xPbxFeO3 perovskite ceramics with x ≤ 0.3, Sens. Actuators, B, 2005, 104(2), 312–316 CrossRef CAS.
- L. Zhang, J. Hu, P. Song, H. Qin and M. Jiang, Electrical properties and ethanol-sensing characteristics of perovskite La1−xPbxFeO3, Sens. Actuators, B, 2006, 114(2), 836–840 CrossRef CAS.
- L. Sun, H. Qina, K. Wang, M. Zhaoa and J. Hua, Structure and electrical propertiesof nanocrystalline La1−xBaxFeO3 for gas sensing application, Mater. Chem. Phys., 2011, 125, 305–308 CrossRef CAS.
- A. Benali, M. Bejar, E. Dhahri, M. P. F. Graça, M. A. Valente and A. Radwan, High ethanol gas sensing property and modulation of magnetic and AC-conduction mechanism in 5% Mg-doped La0.8Ca0.1Pb0.1FeO3 compound, J. Mater. Sci.: Mater. Electron., 2019, 30(13), 12389–12398 CrossRef CAS.
- A. Bougoffa, A. Benali, M. Bejar, E. Dhahri, M. P. F. Graça, M. A. Valente and B. O. F. Costa, Mg-substitution effect on microstructure, dielectric relaxation and conduction phenomenon of Fe based perovskite nanomaterials, J. Alloys Compd., 2020, 157425 Search PubMed.
- Brinker and G. W. Scherer, Sol–Gel Science: The Physics and Chemistry of Sol–Gel Processing, Academic Press, San Diego, 1990 Search PubMed.
- H. Issaoui, A. Benali, M. Bejar, E. Dhahri, R. F. Santos, N. Kus, B. A. Nogueira, R. Fausto and B. F. O. Costa, Structural, Morphological, Raman, and Mössbauer Studies on (La0.8Ca0.2)1−x BixFeO3 (x = 0.0, 0.1, and 0.2) Compounds, J. Supercond. Novel Magn., 2018, 32(6), 1571–1582 CrossRef.
- E. V. Ramana, F. Figueiras, A. Mahajan, D. M. Tobaldi, B. F. O. Costa, M. P. F. Graça and M. A. Valente, Effect of Fe-doping on the structure and magnetoelectric properties of (Ba0.85Ca0.15)(Ti0.9Zr0.1)O3 synthesized by a chemical route, J. Mater. Chem. C, 2016, 4, 1066–1079 RSC.
- A. Benali, A. Souissi, M. Bejar, E. Dhahri and M. A. Valente, Dielectric properties and alternating current conductivity of sol–gel made La0.8Ca0.2FeO3 compound, Chem. Phys. Lett., 2015, 637, 7–12 CrossRef CAS.
- P. Kharel, S. Talebi, B. Ramachandran, A. Dixit, V. M. Naik, M. B. Sahana, C. Sudakar, R. Naik, M. S. R Rao and G. Lawes, Structural, magnetic, and electrical studies on polycrystalline transition-metal-doped BiFeO3 thin films, J. Phys.: Condens. Matter, 2009, 21(6pp), 036001 CrossRef CAS PubMed.
- H. M. Rietveld, Line profiles of neutron powder-diffraction peaks for structure refinement, Acta Crystallogr., 1967, 22, 151 CrossRef CAS.
- A. Benali, A. Aziz, M. Bejar, E. Dhahri and M. F. P. Graça, Structural, electrical and ethanol sensing properties of double-doping LaFeO3 perovskite oxides, Ceram. Int., 2014, 40(9), 14367–14373 CrossRef CAS.
- P. Sherrer, GottingerNachrichten, 1918, 2, 98 Search PubMed.
- S. Seto, S. Yamada and K. Suzuki, Structural and optical characterizations of CdTe on CdS grown by hot-wall vacuum evaporation, Sol. Energy Mater. Sol. Cells, 2001, 67, 167–171 CrossRef CAS.
- J. E. Bauerle, Electrical properties and equivalent circuit of trimethylammonium monobromodichloro mercurate, J. Phys. Chem. Solids, 1969, 30, 3657 Search PubMed.
- A. Kumar, P. Kumari, A. Das, G. D. Dwivedi, P. Shahi, K. K. Shukla, A. K. Ghosh, A. K. Nigam, K. K. Chattopadhyay and S. Chatterjee, J. Solid State Chem., 2013, 208, 120 CrossRef CAS.
- B. Bechera, P. Nayak and R. N. P. Choudhary, Structural and impedance properties of KBa2V5O15 ceramics, Mater. Res. Bull., 2008, 43, 401 CrossRef.
- B. Bechera, P. Nayak and R. N. P. Choudhary, Impedance spectroscopy of NaBa2V5O15 ceramic, J. Alloys Compd., 2007, 436, 226 CrossRef.
- M. M. Ahmed, Electrical conduction and dielectric properties of a newly synthesized single phase: Ag0.4Na0.6FeP2O7, Phys. Rev. B: Condens. Matter Mater. Phys., 2005, 72, 174303 CrossRef.
- H. Issaoui, A. Benali, M. Bejar, E. Dhahri, B. F. O. Costa, M. P. F. Graça, M. A. Valente and B. O. F. Costa, Effect of Bi-substitution into the A-site of multiferroic La0.8Ca0.2FeO3 on structural, electrical and dielectric properties, RSC Adv., 2020, 10(27), 16132–16146 RSC.
- J. Plocharski and W. Wieczoreck, PEO based composite solid electrolyte containing nasicon, Solid State Ionics, 1988, 28–30, 979–982 CrossRef.
- M. K. Adak, D. Mondal, S. Mondal, S. Kar, S. J. Mahato, U. Mahato and D. Dhak, Ferroelectric and photocatalytic behavior of Mn-and Ce-doped BaTiO3 nanoceramics prepared by chemical route, Mater. Sci. Eng., 2020, 262, 114800 CrossRef CAS.
- S. Sen, S. K. Mishra, S. S. Palit, S. K. Das and A. Tarafdar, Impedance analysis of 0.65 Pb (Mg1/3Nb2/3)O3–0.35 PbTiO3 ceramic, J. Alloys Compd., 2008, 453, 395 CrossRef CAS.
- H. Issaoui, A. Benali, M. Bejar, E. Dhahri, M. P. F. Graca, M. A. Valente and B. F. O. Costa, Investigating the structural, morphological, dielectric and electric properties of the multiferroic (La0.8Ca0.2)0.9Bi0.1FeO3 material, Chem. Phys. Lett., 2019, 731, 136588 CrossRef CAS.
- S. Chatterjee, P. K. Mahapatra, R. N. P. Choudhary and A. K. Thakur, Complex impedance studies of sodium pyrotungstate–Na2W2O7, Phys. Status Solidi A, 2004, 201, 588 CrossRef CAS.
- K. Lily, K. Kumari and R. N. P. Prasad, Choudhay, Impedance spectroscopy of (Na0. 5Bi0.5)(Zr0.25Ti0.75) O3 lead-free ceramic, J. Alloys Compd., 2008, 453, 325 CrossRef CAS.
- J. R. Macdonald and E. Barsoukov, Impedance spectroscopy: theory, experiment, and applications, History, 2005, 1(8), 1–13 Search PubMed.
- J. T. Gudmundsson, H. G. Svavarsson, S. Gudjonsson and H. P. Gislason, Frequency-dependent conductivity in lithium-diffused and annealed GaAs, J. Phys. B: At., Mol. Opt. Phys., 2003, 340, 324–328 CrossRef.
- P. Yadav and A. Sharma, Temperature and frequency dependence of AC conductivity of new quaternary Se–Te–Bi–Pb chalcogenide glasses, AIP Conf. Proc., 2016, 1728, 020189 CrossRef.
- A. Kahouli, A. Sylvestre, F. Jomni, B. Yangui and J. Legrand, Experimental and theoretical study of AC electrical conduction mechanisms of semi-crystalline parylene C thin films, J. Phys. Chem. A, 2012, 116, 1051–1058 CrossRef CAS PubMed.
- M. Dussouze, Second harmonic generation in glasses borophosphate sodium and niobium thermal polarization, Phd thesis, University Bordeaux I, France, 2005.
- L. Sangaletti, L. E. Depero, B. Allieri, P. Nunziante and E. Traversa, An X-ray study of the trimetallic LaxSm1−xFeO3 orthoferrites, J. Eur. Ceram. Soc., 2001, 21(6), 719–726 CrossRef CAS.
Footnote |
| † A. Benali, E. Dhahri and M. P. F. Graca could not be contacted to confirm the final author list prior to acceptance. |
| This journal is © The Royal Society of Chemistry 2021 |

