 Open Access Article
Creative Commons Attribution 3.0 Unported Licence
Systematic investigation of CO2 : NH3 ice mixtures using mid-IR and VUV spectroscopy – part 2: electron irradiation and thermal processing†
Rachel L. James‡
 *a,
Sergio Ioppolo
 b,
Søren V. Hoffmann
 c,
Nykola C. Jones
 c,
Nigel J. Masond and
Anita Dawes
 a
a
aSchool of Physical Sciences, The Open University, Walton Hall, Milton Keynes, UK. E-mail: Rachel.James1@open.ac.uk
bSchool of Electronic Engineering and Computer Science, Queen Mary University of London, Mile End Road, London, UK
cISA, Department of Physics and Astronomy, Aarhus University, Ny Munkegade 120, DK-8000 Aarhus C, Denmark
dSchool of Physical Sciences, University of Kent, Canterbury, Kent, UK
First published on 7th October 2021
Abstract
Many experimental parameters determine the chemical and physical properties of interstellar ice analogues, each of which may influence the molecular synthesis that occurs in such ices. In part 1, James et al., RSC Adv., 2020, 10, 37517, we demonstrated the effects that the stoichiometric mixing ratio had on the chemical and physical properties of CO2 : NH3 mixtures and the impact on molecular synthesis induced by thermal processing. Here, in part 2, we extend this to include 1 keV electron irradiation at 20 K of several stoichiometric mixing ratios of CO2![[thin space (1/6-em)]](https://www.rsc.org/images/entities/char_2009.gif) :
:![[thin space (1/6-em)]](https://www.rsc.org/images/entities/char_2009.gif) NH3 ices followed by thermal processing. We demonstrate that not all stoichiometric mixing ratios of CO2 : NH3 ice form the same products. Not only did the 4
NH3 ices followed by thermal processing. We demonstrate that not all stoichiometric mixing ratios of CO2 : NH3 ice form the same products. Not only did the 4![[thin space (1/6-em)]](https://www.rsc.org/images/entities/char_2009.gif) :
:![[thin space (1/6-em)]](https://www.rsc.org/images/entities/char_2009.gif) 1 ratio form a different residue after thermal processing, but O3 was observed after electron irradiation at 20 K, which was not observed in the other ratios. For the other ratios, the residue formed from a thermal reaction similar to the work shown in Part 1. However, conversion of ammonium carbamate to carbamic acid was hindered due to electron irradiation at 20 K. Our results demonstrate the need to systematically investigate stoichiometric mixing ratios to better characterise the chemical and physical properties of interstellar ice analogues to further our understanding of the routes of molecular synthesis under different astrochemical conditions.
1 ratio form a different residue after thermal processing, but O3 was observed after electron irradiation at 20 K, which was not observed in the other ratios. For the other ratios, the residue formed from a thermal reaction similar to the work shown in Part 1. However, conversion of ammonium carbamate to carbamic acid was hindered due to electron irradiation at 20 K. Our results demonstrate the need to systematically investigate stoichiometric mixing ratios to better characterise the chemical and physical properties of interstellar ice analogues to further our understanding of the routes of molecular synthesis under different astrochemical conditions.
1 Introduction
Interstellar ice analogue experiments play an important role in understanding molecular synthesis in the interstellar medium (ISM), and systematic investigations into the experimental parameters can provide a wealth of information. In James et al.,1 henceforth referred to as RJ20, we demonstrated the impact that one discrete experimental parameter, the stoichiometric mixing ratio, has on both the chemical and physical properties of CO2![[thin space (1/6-em)]](https://www.rsc.org/images/entities/char_2009.gif) :
:![[thin space (1/6-em)]](https://www.rsc.org/images/entities/char_2009.gif) NH3 ice mixtures from deposition at 20 K and throughout thermal processing. For example, the NH3-rich CO2
NH3 ice mixtures from deposition at 20 K and throughout thermal processing. For example, the NH3-rich CO2![[thin space (1/6-em)]](https://www.rsc.org/images/entities/char_2009.gif) :
:![[thin space (1/6-em)]](https://www.rsc.org/images/entities/char_2009.gif) NH3 mixtures (e.g. 1
NH3 mixtures (e.g. 1![[thin space (1/6-em)]](https://www.rsc.org/images/entities/char_2009.gif) :
:![[thin space (1/6-em)]](https://www.rsc.org/images/entities/char_2009.gif) 3, 1
3, 1![[thin space (1/6-em)]](https://www.rsc.org/images/entities/char_2009.gif) :
:![[thin space (1/6-em)]](https://www.rsc.org/images/entities/char_2009.gif) 10) formed higher amounts of residue material where more NH3 crystallite grain boundaries existed, suggesting that structural diffusion of reactants may be linked to enhanced reactivity of this system.
10) formed higher amounts of residue material where more NH3 crystallite grain boundaries existed, suggesting that structural diffusion of reactants may be linked to enhanced reactivity of this system.
In this follow-up paper, we extend our study of the discrete experimental parameter of stoichiometric mixing ratios of CO2![[thin space (1/6-em)]](https://www.rsc.org/images/entities/char_2009.gif) :
:![[thin space (1/6-em)]](https://www.rsc.org/images/entities/char_2009.gif) NH3 ices to include 1 keV electron irradiation at 20 K followed by thermal processing. Non-thermal processing due to electrons is thought to occur in the ISM due to the interaction of cosmic rays with solids releasing secondary electrons.2 Electron irradiation of CO2
NH3 ices to include 1 keV electron irradiation at 20 K followed by thermal processing. Non-thermal processing due to electrons is thought to occur in the ISM due to the interaction of cosmic rays with solids releasing secondary electrons.2 Electron irradiation of CO2![[thin space (1/6-em)]](https://www.rsc.org/images/entities/char_2009.gif) :
:![[thin space (1/6-em)]](https://www.rsc.org/images/entities/char_2009.gif) NH3 ice analogues has been previously studied3,4 as well as other methods of non-thermal processing such as UV photons5 and ions.6 These previous studies are summarised in Table 1. Ammonium carbamate ([NH4][H2NCO2]) and carbamic acid (H2NCOOH) were reported as UV processing products at 10 K, ammonium carbamate was reported as a product for 9–20 eV electron irradiation at 10 K and carbamic acid as a product for 144 keV S9+ ion processing at 16 K. We note that ammonium carbamate, or both ammonium carbamate and carbamic acid, were identified as the thermal products in previous non-irradiated studies.1,3,5–12 In addition to ammonium carbamate and/or carbamic acid CO,4,5 OCN−,4,5 N2O (ref. 6) and ammonium formate5,6 were reported. In the previous studies of non-thermal processing of CO2
NH3 ice analogues has been previously studied3,4 as well as other methods of non-thermal processing such as UV photons5 and ions.6 These previous studies are summarised in Table 1. Ammonium carbamate ([NH4][H2NCO2]) and carbamic acid (H2NCOOH) were reported as UV processing products at 10 K, ammonium carbamate was reported as a product for 9–20 eV electron irradiation at 10 K and carbamic acid as a product for 144 keV S9+ ion processing at 16 K. We note that ammonium carbamate, or both ammonium carbamate and carbamic acid, were identified as the thermal products in previous non-irradiated studies.1,3,5–12 In addition to ammonium carbamate and/or carbamic acid CO,4,5 OCN−,4,5 N2O (ref. 6) and ammonium formate5,6 were reported. In the previous studies of non-thermal processing of CO2![[thin space (1/6-em)]](https://www.rsc.org/images/entities/char_2009.gif) :
:![[thin space (1/6-em)]](https://www.rsc.org/images/entities/char_2009.gif) NH3 ices summarised in Table 1 only two different stoichiometric mixing ratios were investigated, a 1
NH3 ices summarised in Table 1 only two different stoichiometric mixing ratios were investigated, a 1![[thin space (1/6-em)]](https://www.rsc.org/images/entities/char_2009.gif) :
:![[thin space (1/6-em)]](https://www.rsc.org/images/entities/char_2009.gif) 1 ratio and a 0.75
1 ratio and a 0.75![[thin space (1/6-em)]](https://www.rsc.org/images/entities/char_2009.gif) :
:![[thin space (1/6-em)]](https://www.rsc.org/images/entities/char_2009.gif) 1 ratio. As such, this paper presents the first study dedicated to investigating the non-thermal processing of different stoichiometric mixing ratios of CO2 : NH3 ices.
1 ratio. As such, this paper presents the first study dedicated to investigating the non-thermal processing of different stoichiometric mixing ratios of CO2 : NH3 ices.
| Reference | CO2![[thin space (1/6-em)]](https://www.rsc.org/images/entities/char_2009.gif) : :![[thin space (1/6-em)]](https://www.rsc.org/images/entities/char_2009.gif) NH3 ratio NH3 ratio |
Td (K) | Processing type | Processing fluence (particles per cm2) | Main products & Tf (K) |
|---|---|---|---|---|---|
| a Method of determining the ratio not specified.b Ratios derived from partial pressures of the mixture in the gas line.c Ratios derived from column density, AC = ammonium carbamate, CA = carbamic acid. | |||||
| Bossa et al.5 | 1![[thin space (1/6-em)]](https://www.rsc.org/images/entities/char_2009.gif) : :![[thin space (1/6-em)]](https://www.rsc.org/images/entities/char_2009.gif) 1a 1a |
10 | VUV photons | 4.3 × 10¹⁹ | AC (10 K, 110–230 K), AF (10 K), CA (10 K, 110–230 K), CO (10 K) & OCN− (10 K) |
| Bertin et al.3 | 1![[thin space (1/6-em)]](https://www.rsc.org/images/entities/char_2009.gif) : :![[thin space (1/6-em)]](https://www.rsc.org/images/entities/char_2009.gif) 1b 1b |
10 | 9–20 eV electrons + thermal | Few 1014 | AC (10 & 140 K), CA (140 K) |
| Jheeta et al.4 | 1![[thin space (1/6-em)]](https://www.rsc.org/images/entities/char_2009.gif) : :![[thin space (1/6-em)]](https://www.rsc.org/images/entities/char_2009.gif) 1c 1c |
30 | 1 keV electrons + thermal | 4.6 × 10¹⁷ | CO (30 K), NH+4 (30 K), OCN− (30 K) & AC (254 K) |
| Lv et al.6 | 1![[thin space (1/6-em)]](https://www.rsc.org/images/entities/char_2009.gif) : :![[thin space (1/6-em)]](https://www.rsc.org/images/entities/char_2009.gif) 1, 0.75 1, 0.75![[thin space (1/6-em)]](https://www.rsc.org/images/entities/char_2009.gif) : :![[thin space (1/6-em)]](https://www.rsc.org/images/entities/char_2009.gif) 1b 1b |
16 | 144 keV S9+ ions | (1.3 & 6.8) × 1014 | AF (16 K), CA (16 K), N2O (16 K) & OCN− (16 K) |
Similar to RJ20, in this paper, we present combined mid-IR and vacuum-ultraviolet (VUV) studies of CO2 : NH3 ice mixtures. For the studies summarised in Table 1, in situ mid-IR spectroscopy was used to study the evolution of the CO2 : NH3 ices. For some studies, mass spectrometry5 and high-resolution low energy electron loss spectroscopy3 were also used. VUV spectroscopy not only provides an additional technique to study the formation of products, but variations in Rayleigh scattering tails in CO2 : NH3 ices observed in VUV spectra in RJ20 can provide insight into the physical changes occurring with the ice analogues due to initial stoichiometric mixing ratios.
In this paper, we present the results of CO2 : NH3 mixtures deposited at 20 K and then irradiated with 1 keV electrons at 20 K, and subsequent thermal processing. Henceforth ices processed in this way are referred to as e-irradiated. Mid-IR spectra of CO2![[thin space (1/6-em)]](https://www.rsc.org/images/entities/char_2009.gif) :
:![[thin space (1/6-em)]](https://www.rsc.org/images/entities/char_2009.gif) NH3 mixtures with differing ratios of 4
NH3 mixtures with differing ratios of 4![[thin space (1/6-em)]](https://www.rsc.org/images/entities/char_2009.gif) :
:![[thin space (1/6-em)]](https://www.rsc.org/images/entities/char_2009.gif) 1, 2
1, 2![[thin space (1/6-em)]](https://www.rsc.org/images/entities/char_2009.gif) :
:![[thin space (1/6-em)]](https://www.rsc.org/images/entities/char_2009.gif) 1, 1
1, 1![[thin space (1/6-em)]](https://www.rsc.org/images/entities/char_2009.gif) :
:![[thin space (1/6-em)]](https://www.rsc.org/images/entities/char_2009.gif) 1, 1
1, 1![[thin space (1/6-em)]](https://www.rsc.org/images/entities/char_2009.gif) :
:![[thin space (1/6-em)]](https://www.rsc.org/images/entities/char_2009.gif) 2, 1
2, 1![[thin space (1/6-em)]](https://www.rsc.org/images/entities/char_2009.gif) :
:![[thin space (1/6-em)]](https://www.rsc.org/images/entities/char_2009.gif) 5 & 1
5 & 1![[thin space (1/6-em)]](https://www.rsc.org/images/entities/char_2009.gif) :
:![[thin space (1/6-em)]](https://www.rsc.org/images/entities/char_2009.gif) 10 are complemented by a VUV spectroscopic study of mixtures with ratios of 4
10 are complemented by a VUV spectroscopic study of mixtures with ratios of 4![[thin space (1/6-em)]](https://www.rsc.org/images/entities/char_2009.gif) :
:![[thin space (1/6-em)]](https://www.rsc.org/images/entities/char_2009.gif) 1, 2
1, 2![[thin space (1/6-em)]](https://www.rsc.org/images/entities/char_2009.gif) :
:![[thin space (1/6-em)]](https://www.rsc.org/images/entities/char_2009.gif) 1 & 1
1 & 1![[thin space (1/6-em)]](https://www.rsc.org/images/entities/char_2009.gif) :
:![[thin space (1/6-em)]](https://www.rsc.org/images/entities/char_2009.gif) 3. The results presented in RJ20, which were also thermally processed, but not irradiated with electrons, are used as a set of control experiments to make direct comparisons and, therefore, investigate the effect of electron irradiation on the chemical and physical properties of the ice mixtures. The astrophysical implications of this study combined with that of RJ20 will be presented in a further publication.
3. The results presented in RJ20, which were also thermally processed, but not irradiated with electrons, are used as a set of control experiments to make direct comparisons and, therefore, investigate the effect of electron irradiation on the chemical and physical properties of the ice mixtures. The astrophysical implications of this study combined with that of RJ20 will be presented in a further publication.
2 Experimental
Both the mid-IR and VUV experiments were performed using The Open University Portable Astrochemistry Chamber (PAC). This was the same experimental system used in RJ20, using a Nicolet Nexus 670 FTIR spectrometer with an external MCT detector for mid-IR measurements and the AU-UV beamline on ASTRID2 (Aarhus University, Denmark) to record the VUV spectra. A more detailed description can be found in Section 2 of RJ20 and Section S1.1 of the ESI for RJ20. Physical vapour deposition of the ices was conducted at a base pressure of low 10−9 mbar and a base temperature of 20 K. CO2 (99.8%, BOC) and NH3 (99.96%, ARGO International Ltd) were premixed in the gas line prior to deposition and deposited onto a cooled substrate (mid-IR: ZnSe, Crystran; VUV: MgF2, Crystran). After deposition, the ice samples were irradiated with 1 keV electrons using a Kimball Physics FRA-2X1-5549 electron gun with a current of 10 μA. Electron irradiation was conducted at set intervals, cumulating in a total electron irradiation time of 30 min or a total fluence of 3.37 × 10¹⁶ e− cm−2, and spectroscopic measurements were taken after each interval. The acquisition time for each mid-IR spectrum was approximately 2 min. After electron irradiation, the ices in the mid-IR study were allowed to rest for ∼1 h. For the VUV spectrum, the acquisition time is dependent on the step size used: for spectra below 110 K, this corresponded to ∼1 h, and for temperatures at or above 120 K, this corresponded to ∼10 min. The ice samples were then thermally processed to set temperatures and held at this temperature while spectroscopic measurements were taken.The film thickness and ratios of the CO2 : NH3 mixtures were calculated in the same way as described in the ESI of RJ20. Deposition rates were between 0.8–1.9 nm s−1 for both mid-IR and VUV spectroscopic studies. The average film thickness for the mid-IR study was 437 nm. Thinner films for the VUV measurements were required to prevent saturation of the absorption peaks, and the average film thickness was 204 nm for the VUV study. The spectra of the mixtures were normalised to a specific thickness when compared, 400 nm for the mid-IR samples and 200 nm for the VUV samples, and indicated in the figure captions. The individual sample thickness and normalisation factors are given in Table S1 in the ESI.†
All mid-IR and VUV spectra are freely available on the Open Research Data Online (ORDO) Repository.13
2.1 Penetration depth of 1 keV electrons
To negate any substrate effects which may occur during electron irradiation the ice samples were grown to a thickness larger than the electron penetration depth. The penetration depths of the 1 keV electrons within the ice samples were estimated using the CASINO (monte CArlo SImulation of electroN trajectory in sOlids) program.14 The CASINO program requires inputs of the electron energy, the angle of the electron beam with respect to the sample, the composition, and density of the sample. A weighted density was used for the CO2 : NH3 mixtures which was calculated using the density of pure CO2 (1.11 g cm−3) and pure NH3 (0.74 g cm−3)15 and specific values are given in Table S2 of the ESI.† The estimated average penetration depth of the electrons was 65 nm, well below the sample thicknesses.3 Mid-IR results
3.1 Deposition at 20 K
The following CO2 : NH3 mixtures were deposited at 20 K: 4![[thin space (1/6-em)]](https://www.rsc.org/images/entities/char_2009.gif) :
:![[thin space (1/6-em)]](https://www.rsc.org/images/entities/char_2009.gif) 1, 2
1, 2![[thin space (1/6-em)]](https://www.rsc.org/images/entities/char_2009.gif) :
:![[thin space (1/6-em)]](https://www.rsc.org/images/entities/char_2009.gif) 1, 1
1, 1![[thin space (1/6-em)]](https://www.rsc.org/images/entities/char_2009.gif) :
:![[thin space (1/6-em)]](https://www.rsc.org/images/entities/char_2009.gif) 1, 1
1, 1![[thin space (1/6-em)]](https://www.rsc.org/images/entities/char_2009.gif) :
:![[thin space (1/6-em)]](https://www.rsc.org/images/entities/char_2009.gif) 2, 1
2, 1![[thin space (1/6-em)]](https://www.rsc.org/images/entities/char_2009.gif) :
:![[thin space (1/6-em)]](https://www.rsc.org/images/entities/char_2009.gif) 5 & 1
5 & 1![[thin space (1/6-em)]](https://www.rsc.org/images/entities/char_2009.gif) :
:![[thin space (1/6-em)]](https://www.rsc.org/images/entities/char_2009.gif) 10. These ratios are similar to the ratios used in the mid-IR study of RJ20 (3
10. These ratios are similar to the ratios used in the mid-IR study of RJ20 (3![[thin space (1/6-em)]](https://www.rsc.org/images/entities/char_2009.gif) :
:![[thin space (1/6-em)]](https://www.rsc.org/images/entities/char_2009.gif) 1, 2
1, 2![[thin space (1/6-em)]](https://www.rsc.org/images/entities/char_2009.gif) :
:![[thin space (1/6-em)]](https://www.rsc.org/images/entities/char_2009.gif) 1, 1
1, 1![[thin space (1/6-em)]](https://www.rsc.org/images/entities/char_2009.gif) :
:![[thin space (1/6-em)]](https://www.rsc.org/images/entities/char_2009.gif) 1, 1
1, 1![[thin space (1/6-em)]](https://www.rsc.org/images/entities/char_2009.gif) :
:![[thin space (1/6-em)]](https://www.rsc.org/images/entities/char_2009.gif) 3 & 1
3 & 1![[thin space (1/6-em)]](https://www.rsc.org/images/entities/char_2009.gif) :
:![[thin space (1/6-em)]](https://www.rsc.org/images/entities/char_2009.gif) 10), with slight differences arising due to practical difficulties during gas mixing prior to deposition. In this study, the 4
10), with slight differences arising due to practical difficulties during gas mixing prior to deposition. In this study, the 4![[thin space (1/6-em)]](https://www.rsc.org/images/entities/char_2009.gif) :
:![[thin space (1/6-em)]](https://www.rsc.org/images/entities/char_2009.gif) 1 ratio is comparable to the RJ20 3
1 ratio is comparable to the RJ20 3![[thin space (1/6-em)]](https://www.rsc.org/images/entities/char_2009.gif) :
:![[thin space (1/6-em)]](https://www.rsc.org/images/entities/char_2009.gif) 1 ratio, and the 1
1 ratio, and the 1![[thin space (1/6-em)]](https://www.rsc.org/images/entities/char_2009.gif) :
:![[thin space (1/6-em)]](https://www.rsc.org/images/entities/char_2009.gif) 2 & 1
2 & 1![[thin space (1/6-em)]](https://www.rsc.org/images/entities/char_2009.gif) :
:![[thin space (1/6-em)]](https://www.rsc.org/images/entities/char_2009.gif) 5 ratios are comparable to the RJ20 1
5 ratios are comparable to the RJ20 1![[thin space (1/6-em)]](https://www.rsc.org/images/entities/char_2009.gif) :
:![[thin space (1/6-em)]](https://www.rsc.org/images/entities/char_2009.gif) 3 ratio.
3 ratio.
Deposition spectra are shown in Section 2.1, Fig. S2.1 of the ESI,† and band assignments and positions are given in Table S3 of the ESI.† The same general trends in the mid-IR spectra were observed for the ratios used in this study and for the ratios used RJ20. In brief, the stoichiometric mixing ratio affected the CO2 bonding environment. For the NH3-rich 1![[thin space (1/6-em)]](https://www.rsc.org/images/entities/char_2009.gif) :
:![[thin space (1/6-em)]](https://www.rsc.org/images/entities/char_2009.gif) 10 mixture, CO2 was essentially a defect within the NH3 ice and existed in the form of isolated CO2 molecules. For the NH3-rich 1
10 mixture, CO2 was essentially a defect within the NH3 ice and existed in the form of isolated CO2 molecules. For the NH3-rich 1![[thin space (1/6-em)]](https://www.rsc.org/images/entities/char_2009.gif) :
:![[thin space (1/6-em)]](https://www.rsc.org/images/entities/char_2009.gif) 5 mixture CO2 complexed to NH3 to form a CO2 : NH3 molecular complex as well as existing as isolated CO2 molecules. Within the other ratios (4
5 mixture CO2 complexed to NH3 to form a CO2 : NH3 molecular complex as well as existing as isolated CO2 molecules. Within the other ratios (4![[thin space (1/6-em)]](https://www.rsc.org/images/entities/char_2009.gif) :
:![[thin space (1/6-em)]](https://www.rsc.org/images/entities/char_2009.gif) 1, 2
1, 2![[thin space (1/6-em)]](https://www.rsc.org/images/entities/char_2009.gif) :
:![[thin space (1/6-em)]](https://www.rsc.org/images/entities/char_2009.gif) 1, 1
1, 1![[thin space (1/6-em)]](https://www.rsc.org/images/entities/char_2009.gif) :
:![[thin space (1/6-em)]](https://www.rsc.org/images/entities/char_2009.gif) 1 & 1
1 & 1![[thin space (1/6-em)]](https://www.rsc.org/images/entities/char_2009.gif) :
:![[thin space (1/6-em)]](https://www.rsc.org/images/entities/char_2009.gif) 2) CO2 was in the form of CO2 dimers, CO2 : NH3 molecular complexes and isolated CO2. For a detailed characterisation of the CO2 : NH3 mixtures deposited at 20 K, see Section 3.1 of RJ20.
2) CO2 was in the form of CO2 dimers, CO2 : NH3 molecular complexes and isolated CO2. For a detailed characterisation of the CO2 : NH3 mixtures deposited at 20 K, see Section 3.1 of RJ20.
3.2 Electron irradiation at 20 K
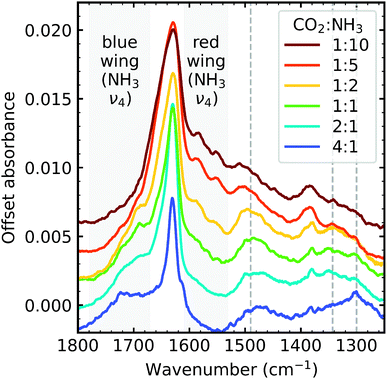
After deposition at 20 K, the CO2 : NH3 mixtures were irradiated with 1 keV electrons at discrete intervals cumulating in a total fluence of 3.37 × 10¹⁶ e− cm−2. Fig. 1 shows the mid-IR spectra of a CO2 : NH3 mixture in a 1![[thin space (1/6-em)]](https://www.rsc.org/images/entities/char_2009.gif) :
:![[thin space (1/6-em)]](https://www.rsc.org/images/entities/char_2009.gif) 1 ratio after set intervals of 1 keV electron irradiation. Mid-IR spectra of the irradiated ices in other ratios can be found in Section S2.2, Fig. S4 to S7 of the ESI.† For reference, the 1 keV electron irradiation mid-IR spectra of pure CO2 and pure NH3 are shown in Fig. S2 and S3 of the ESI,† respectively.
1 ratio after set intervals of 1 keV electron irradiation. Mid-IR spectra of the irradiated ices in other ratios can be found in Section S2.2, Fig. S4 to S7 of the ESI.† For reference, the 1 keV electron irradiation mid-IR spectra of pure CO2 and pure NH3 are shown in Fig. S2 and S3 of the ESI,† respectively.
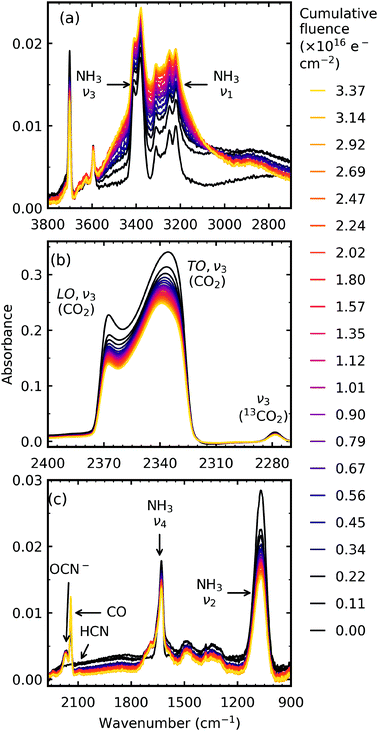 | ||
Fig. 1 Example mid-IR spectra of a CO2![[thin space (1/6-em)]](https://www.rsc.org/images/entities/char_2009.gif) : :![[thin space (1/6-em)]](https://www.rsc.org/images/entities/char_2009.gif) NH3 mixture in a 1 NH3 mixture in a 1![[thin space (1/6-em)]](https://www.rsc.org/images/entities/char_2009.gif) : :![[thin space (1/6-em)]](https://www.rsc.org/images/entities/char_2009.gif) 1 ratio irradiated with 1 keV electrons at 20 K to a total fluence of 3.37 × 10¹⁶ e− cm−2. See Section S2.2 of the ESI† for the mid-IR spectra of the 4 1 ratio irradiated with 1 keV electrons at 20 K to a total fluence of 3.37 × 10¹⁶ e− cm−2. See Section S2.2 of the ESI† for the mid-IR spectra of the 4![[thin space (1/6-em)]](https://www.rsc.org/images/entities/char_2009.gif) : :![[thin space (1/6-em)]](https://www.rsc.org/images/entities/char_2009.gif) 1, 2 1, 2![[thin space (1/6-em)]](https://www.rsc.org/images/entities/char_2009.gif) : :![[thin space (1/6-em)]](https://www.rsc.org/images/entities/char_2009.gif) 1, 1 1, 1![[thin space (1/6-em)]](https://www.rsc.org/images/entities/char_2009.gif) : :![[thin space (1/6-em)]](https://www.rsc.org/images/entities/char_2009.gif) 2, 1 2, 1![[thin space (1/6-em)]](https://www.rsc.org/images/entities/char_2009.gif) : :![[thin space (1/6-em)]](https://www.rsc.org/images/entities/char_2009.gif) 5 & 1 5 & 1![[thin space (1/6-em)]](https://www.rsc.org/images/entities/char_2009.gif) : :![[thin space (1/6-em)]](https://www.rsc.org/images/entities/char_2009.gif) 10 ratios. (a) O–H/N–H stretching region between 3500–2900 cm−1. (b) LO–TO splitting of the ν3 vibrational mode of CO2. (c) Several new features formed including OCN−, CO & HCN and broad absorptions between 1750–1250 cm−1. 10 ratios. (a) O–H/N–H stretching region between 3500–2900 cm−1. (b) LO–TO splitting of the ν3 vibrational mode of CO2. (c) Several new features formed including OCN−, CO & HCN and broad absorptions between 1750–1250 cm−1. | ||
Irradiation with 1 keV electrons induced several changes within the 1![[thin space (1/6-em)]](https://www.rsc.org/images/entities/char_2009.gif) :
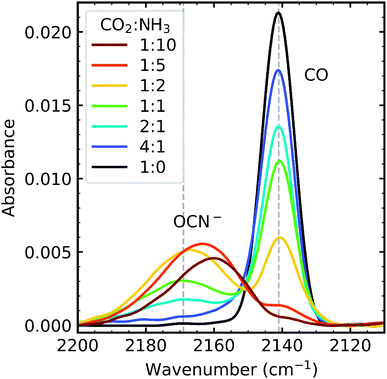
:![[thin space (1/6-em)]](https://www.rsc.org/images/entities/char_2009.gif) 1 CO2 : NH3 mixture as shown in Fig. 1. The intensity of all the CO2 absorption bands decreased throughout electron irradiation. Within the O–H/N–H stretching region, between 3550–2900 cm−1 (Fig. 1a), an overall increase in intensity was observed with the appearance of shoulders on the higher wavenumber side of the NH3 ν3 absorption band and on the lower wavenumber side of the NH3 ν1 absorption band. A broad feature around 2800 cm−1 also appeared. The appearance of several distinct features was also observed in Fig. 1c: OCN− (2170 cm−1), CO (2140 cm−1) and HCN (2092 cm−1). Several broad features also appeared between 1750–1250 cm−1: broad shoulders on both sides of the NH3 ν2 absorption band, and broad features centred around 1485 cm−1 and 1343 cm−1.
1 CO2 : NH3 mixture as shown in Fig. 1. The intensity of all the CO2 absorption bands decreased throughout electron irradiation. Within the O–H/N–H stretching region, between 3550–2900 cm−1 (Fig. 1a), an overall increase in intensity was observed with the appearance of shoulders on the higher wavenumber side of the NH3 ν3 absorption band and on the lower wavenumber side of the NH3 ν1 absorption band. A broad feature around 2800 cm−1 also appeared. The appearance of several distinct features was also observed in Fig. 1c: OCN− (2170 cm−1), CO (2140 cm−1) and HCN (2092 cm−1). Several broad features also appeared between 1750–1250 cm−1: broad shoulders on both sides of the NH3 ν2 absorption band, and broad features centred around 1485 cm−1 and 1343 cm−1.
Differences between the stoichiometric ratios were observed, and the positions at which new features formed are listed in Table 2. Notably, the new absorption features due to electron irradiation in the region between 1800–1250 cm−1 were not present in all ratios and are discussed further in Section 3.2.1. The new absorption features which were present also varied in position. The ratio-dependent formation of CO and OCN− are discussed in Section 3.2.2.
![[thin space (1/6-em)]](https://www.rsc.org/images/entities/char_2009.gif) :
:![[thin space (1/6-em)]](https://www.rsc.org/images/entities/char_2009.gif) 0), pure NH3 ice (0
0), pure NH3 ice (0![[thin space (1/6-em)]](https://www.rsc.org/images/entities/char_2009.gif) :
:![[thin space (1/6-em)]](https://www.rsc.org/images/entities/char_2009.gif) 1) and CO2:NH3 mixtures (4
1) and CO2:NH3 mixtures (4![[thin space (1/6-em)]](https://www.rsc.org/images/entities/char_2009.gif) :
:![[thin space (1/6-em)]](https://www.rsc.org/images/entities/char_2009.gif) 1, 2
1, 2![[thin space (1/6-em)]](https://www.rsc.org/images/entities/char_2009.gif) :
:![[thin space (1/6-em)]](https://www.rsc.org/images/entities/char_2009.gif) 1, 1
1, 1![[thin space (1/6-em)]](https://www.rsc.org/images/entities/char_2009.gif) :
:![[thin space (1/6-em)]](https://www.rsc.org/images/entities/char_2009.gif) 1, 1
1, 1![[thin space (1/6-em)]](https://www.rsc.org/images/entities/char_2009.gif) :
:![[thin space (1/6-em)]](https://www.rsc.org/images/entities/char_2009.gif) 2, 1
2, 1![[thin space (1/6-em)]](https://www.rsc.org/images/entities/char_2009.gif) :
:![[thin space (1/6-em)]](https://www.rsc.org/images/entities/char_2009.gif) 5 & 1
5 & 1![[thin space (1/6-em)]](https://www.rsc.org/images/entities/char_2009.gif) :
:![[thin space (1/6-em)]](https://www.rsc.org/images/entities/char_2009.gif) 10) deposited at 20 K
10) deposited at 20 K
| Molecule | Vib. mode | Assignment | Ref. | Position (cm−1) | |||||||
|---|---|---|---|---|---|---|---|---|---|---|---|
1![[thin space (1/6-em)]](https://www.rsc.org/images/entities/char_2009.gif) : :![[thin space (1/6-em)]](https://www.rsc.org/images/entities/char_2009.gif) 0 0 |
4![[thin space (1/6-em)]](https://www.rsc.org/images/entities/char_2009.gif) : :![[thin space (1/6-em)]](https://www.rsc.org/images/entities/char_2009.gif) 1 1 |
2![[thin space (1/6-em)]](https://www.rsc.org/images/entities/char_2009.gif) : :![[thin space (1/6-em)]](https://www.rsc.org/images/entities/char_2009.gif) 1 1 |
1![[thin space (1/6-em)]](https://www.rsc.org/images/entities/char_2009.gif) : :![[thin space (1/6-em)]](https://www.rsc.org/images/entities/char_2009.gif) 1 1 |
1![[thin space (1/6-em)]](https://www.rsc.org/images/entities/char_2009.gif) : :![[thin space (1/6-em)]](https://www.rsc.org/images/entities/char_2009.gif) 2 2 |
1![[thin space (1/6-em)]](https://www.rsc.org/images/entities/char_2009.gif) : :![[thin space (1/6-em)]](https://www.rsc.org/images/entities/char_2009.gif) 5 5 |
1![[thin space (1/6-em)]](https://www.rsc.org/images/entities/char_2009.gif) : :![[thin space (1/6-em)]](https://www.rsc.org/images/entities/char_2009.gif) 10 10 |
0![[thin space (1/6-em)]](https://www.rsc.org/images/entities/char_2009.gif) : :![[thin space (1/6-em)]](https://www.rsc.org/images/entities/char_2009.gif) 1 1 |
||||
| OCN− | ν3 | C–N stretch | 16 | 2170 | 2169 | 2166 | 2162 | 2159 | |||
| CO | ν1 | C=O | 17 | 2140 | 2140 | 2140 | 2140 | 2140 | 2140 | 2139 | |
| HCN | ν3 | C–N stretch | 18 | 2092 | 2092 | 2095 | |||||
| CO−3 | ν1 | C![[double bond, length as m-dash]](https://www.rsc.org/images/entities/char_e001.gif) O stretch O stretch |
19 | 2050 | |||||||
C![[double bond, length as m-dash]](https://www.rsc.org/images/entities/char_e001.gif) O stretch O stretch |
1715 | 1720sh | 1724sh | 1718sh | 1704sh | ||||||
C![[double bond, length as m-dash]](https://www.rsc.org/images/entities/char_e001.gif) O stretch O stretch |
1682sh | 1689sh | 1690sh | ||||||||
| 1583 | 1584 | 1583 | |||||||||
| COO− asym. stretch | 1550 | 1551 | 1551 | ||||||||
| 1500 | 1505 | 1508 | |||||||||
| 1477 | 1481 | 1485 | |||||||||
| COO− asym. stretch | 1380 | 1384 | 1381 | ||||||||
| 1343 | 1340 | 1337 | 1339 | 1342 | |||||||
| C–O stretch | 1305 | 1302 | 1302 | 1300 | 1301 | ||||||
| O3 | ν3 | O–O asym. stretch | 20 | 1040 | |||||||
![[thin space (1/6-em)]](https://www.rsc.org/images/entities/char_2009.gif) :
:![[thin space (1/6-em)]](https://www.rsc.org/images/entities/char_2009.gif) NH3 mixtures. For example, on the blue wing of the NH3 ν4 absorption band one distinct absorption feature was identified in the 4
NH3 mixtures. For example, on the blue wing of the NH3 ν4 absorption band one distinct absorption feature was identified in the 4![[thin space (1/6-em)]](https://www.rsc.org/images/entities/char_2009.gif) :
:![[thin space (1/6-em)]](https://www.rsc.org/images/entities/char_2009.gif) 1 ratio at 1715 cm−1. For the 2
1 ratio at 1715 cm−1. For the 2![[thin space (1/6-em)]](https://www.rsc.org/images/entities/char_2009.gif) :
:![[thin space (1/6-em)]](https://www.rsc.org/images/entities/char_2009.gif) 1, 1
1, 1![[thin space (1/6-em)]](https://www.rsc.org/images/entities/char_2009.gif) :
:![[thin space (1/6-em)]](https://www.rsc.org/images/entities/char_2009.gif) 1 & 1
1 & 1![[thin space (1/6-em)]](https://www.rsc.org/images/entities/char_2009.gif) :
:![[thin space (1/6-em)]](https://www.rsc.org/images/entities/char_2009.gif) 2 ratios, the absorption feature on the blue wing of the NH3 ν4 absorption band was broad with two shoulder features. On the red wing of the NH3 ν4 absorption band, two distinct absorption features were observed near 1583 and 1550 cm−1 but only in the NH3-rich mixtures. Broad, asymmetric features were observed in the NH3-rich mixtures at ∼1505 cm−1 shifting to ∼1480 cm−1 in the other mixtures. Absorption features at ∼1380 cm−1 were observed for the NH3-rich mixtures. Broad absorption bands were observed for all ratios, except for the 4
2 ratios, the absorption feature on the blue wing of the NH3 ν4 absorption band was broad with two shoulder features. On the red wing of the NH3 ν4 absorption band, two distinct absorption features were observed near 1583 and 1550 cm−1 but only in the NH3-rich mixtures. Broad, asymmetric features were observed in the NH3-rich mixtures at ∼1505 cm−1 shifting to ∼1480 cm−1 in the other mixtures. Absorption features at ∼1380 cm−1 were observed for the NH3-rich mixtures. Broad absorption bands were observed for all ratios, except for the 4![[thin space (1/6-em)]](https://www.rsc.org/images/entities/char_2009.gif) :
:![[thin space (1/6-em)]](https://www.rsc.org/images/entities/char_2009.gif) 1 ratio, near 1340 cm−1. An absorption feature was observed near ∼1300 cm−1 for all ratios except the 1
1 ratio, near 1340 cm−1. An absorption feature was observed near ∼1300 cm−1 for all ratios except the 1![[thin space (1/6-em)]](https://www.rsc.org/images/entities/char_2009.gif) :
:![[thin space (1/6-em)]](https://www.rsc.org/images/entities/char_2009.gif) 10 ratio.
10 ratio.
Absolute band assignments of these irradiation features are very difficult without theoretical calculations and are beyond the focus of this paper. Broadly, the overall profile of the mixtures shown in Fig. 2 is similar for all ratios, except for the 4![[thin space (1/6-em)]](https://www.rsc.org/images/entities/char_2009.gif) :
:![[thin space (1/6-em)]](https://www.rsc.org/images/entities/char_2009.gif) 1 ratio, indicative of products with similar functional groups. However, we do note that NH3-rich mixtures had additional absorption features at ∼1583 cm−1, ∼1550 cm−1, and ∼1380 cm−1 which could either indicate a more complex product, additional products or both.
1 ratio, indicative of products with similar functional groups. However, we do note that NH3-rich mixtures had additional absorption features at ∼1583 cm−1, ∼1550 cm−1, and ∼1380 cm−1 which could either indicate a more complex product, additional products or both.
![[thin space (1/6-em)]](https://www.rsc.org/images/entities/char_2009.gif) :
:![[thin space (1/6-em)]](https://www.rsc.org/images/entities/char_2009.gif) 1 ratio had the highest amount of CO, and the 1
1 ratio had the highest amount of CO, and the 1![[thin space (1/6-em)]](https://www.rsc.org/images/entities/char_2009.gif) :
:![[thin space (1/6-em)]](https://www.rsc.org/images/entities/char_2009.gif) 10 ratio had the lowest amount of CO. The formation of OCN− occurs via several steps, first requiring CO formation.4,5 The highest amount of OCN− formed was in the 1
10 ratio had the lowest amount of CO. The formation of OCN− occurs via several steps, first requiring CO formation.4,5 The highest amount of OCN− formed was in the 1![[thin space (1/6-em)]](https://www.rsc.org/images/entities/char_2009.gif) :
:![[thin space (1/6-em)]](https://www.rsc.org/images/entities/char_2009.gif) 5 ratio followed by, in descending order, the 1
5 ratio followed by, in descending order, the 1![[thin space (1/6-em)]](https://www.rsc.org/images/entities/char_2009.gif) :
:![[thin space (1/6-em)]](https://www.rsc.org/images/entities/char_2009.gif) 2, 1
2, 1![[thin space (1/6-em)]](https://www.rsc.org/images/entities/char_2009.gif) :
:![[thin space (1/6-em)]](https://www.rsc.org/images/entities/char_2009.gif) 10, 1
10, 1![[thin space (1/6-em)]](https://www.rsc.org/images/entities/char_2009.gif) :
:![[thin space (1/6-em)]](https://www.rsc.org/images/entities/char_2009.gif) 1 & 2
1 & 2![[thin space (1/6-em)]](https://www.rsc.org/images/entities/char_2009.gif) :
:![[thin space (1/6-em)]](https://www.rsc.org/images/entities/char_2009.gif) 1 ratios. While the amount of OCN− seems to depend on the concentration of NH3, the 1
1 ratios. While the amount of OCN− seems to depend on the concentration of NH3, the 1![[thin space (1/6-em)]](https://www.rsc.org/images/entities/char_2009.gif) :
:![[thin space (1/6-em)]](https://www.rsc.org/images/entities/char_2009.gif) 10 does not fit this trend. This suggests that the formation of OCN− depends on an N-bearing intermediate but requires a minimum amount of CO, of which there is not enough in the 1
10 does not fit this trend. This suggests that the formation of OCN− depends on an N-bearing intermediate but requires a minimum amount of CO, of which there is not enough in the 1![[thin space (1/6-em)]](https://www.rsc.org/images/entities/char_2009.gif) :
:![[thin space (1/6-em)]](https://www.rsc.org/images/entities/char_2009.gif) 10 mixture. No detectable amounts of OCN− were observed in the 4
10 mixture. No detectable amounts of OCN− were observed in the 4![[thin space (1/6-em)]](https://www.rsc.org/images/entities/char_2009.gif) :
:![[thin space (1/6-em)]](https://www.rsc.org/images/entities/char_2009.gif) 1 ratio. The position of the OCN− peak is also ratio-dependent, blueshifting as the concentration of NH3 decreases in the mixing ratios.
1 ratio. The position of the OCN− peak is also ratio-dependent, blueshifting as the concentration of NH3 decreases in the mixing ratios.
3.3 Thermal processing
After 1 keV electron irradiation at 20 K, the CO2 : NH3 mixtures were thermally processed and analysed at discrete temperatures until desorption. Fig. 4 shows the mid-IR spectra of the thermal processing results of a CO2 : NH3 mixture in a 1![[thin space (1/6-em)]](https://www.rsc.org/images/entities/char_2009.gif) :
:![[thin space (1/6-em)]](https://www.rsc.org/images/entities/char_2009.gif) 1 ratio. Mid-IR spectra of the other ratios can be found in Section S2.3 of the ESI.† Thermal processing after electron irradiation for pure CO2 and pure NH3 ices are given for reference in Fig. S8 and S9 of the ESI,† respectively.
1 ratio. Mid-IR spectra of the other ratios can be found in Section S2.3 of the ESI.† Thermal processing after electron irradiation for pure CO2 and pure NH3 ices are given for reference in Fig. S8 and S9 of the ESI,† respectively.
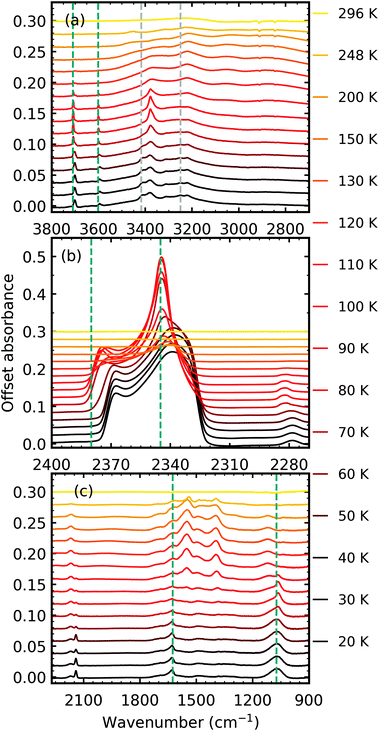 | ||
Fig. 4 Example mid-IR spectra of thermal processing results of a CO2![[thin space (1/6-em)]](https://www.rsc.org/images/entities/char_2009.gif) : :![[thin space (1/6-em)]](https://www.rsc.org/images/entities/char_2009.gif) NH3 mixture in a 1 NH3 mixture in a 1![[thin space (1/6-em)]](https://www.rsc.org/images/entities/char_2009.gif) : :![[thin space (1/6-em)]](https://www.rsc.org/images/entities/char_2009.gif) 1 ratio after deposition and irradiation with 1 keV electrons to a fluence of 3.37 × 10¹⁶ e− cm−2 at 20 K. Spectra are offset on the y-axis for clarity. See Section S2.3 in the ESI† for the mid-IR spectra of the 4 1 ratio after deposition and irradiation with 1 keV electrons to a fluence of 3.37 × 10¹⁶ e− cm−2 at 20 K. Spectra are offset on the y-axis for clarity. See Section S2.3 in the ESI† for the mid-IR spectra of the 4![[thin space (1/6-em)]](https://www.rsc.org/images/entities/char_2009.gif) : :![[thin space (1/6-em)]](https://www.rsc.org/images/entities/char_2009.gif) 1, 2 1, 2![[thin space (1/6-em)]](https://www.rsc.org/images/entities/char_2009.gif) : :![[thin space (1/6-em)]](https://www.rsc.org/images/entities/char_2009.gif) 1, 1 1, 1![[thin space (1/6-em)]](https://www.rsc.org/images/entities/char_2009.gif) : :![[thin space (1/6-em)]](https://www.rsc.org/images/entities/char_2009.gif) 2, 1 2, 1![[thin space (1/6-em)]](https://www.rsc.org/images/entities/char_2009.gif) : :![[thin space (1/6-em)]](https://www.rsc.org/images/entities/char_2009.gif) 5 & 1 5 & 1![[thin space (1/6-em)]](https://www.rsc.org/images/entities/char_2009.gif) : :![[thin space (1/6-em)]](https://www.rsc.org/images/entities/char_2009.gif) 10 ratios. (a) Segregation of the mixture was observed through the shift in position of the CO2 vibrational modes towards pure CO2 position which are indicated by blue dashed lines. Grey dashed lines indicate CO2 10 ratios. (a) Segregation of the mixture was observed through the shift in position of the CO2 vibrational modes towards pure CO2 position which are indicated by blue dashed lines. Grey dashed lines indicate CO2![[thin space (1/6-em)]](https://www.rsc.org/images/entities/char_2009.gif) : :![[thin space (1/6-em)]](https://www.rsc.org/images/entities/char_2009.gif) NH3 molecular complex vibrational modes which disappeared between 60–70 K. (b) LO–TO splitting of the ν3 vibrational mode of CO2. Segregation of the mixture was observed through the shift in the position of the LO and TO modes towards pure CO2 positions which are indicated by blue dashed lines. (c) Thermally induced reaction at 80 K. NH3 molecular complex vibrational modes which disappeared between 60–70 K. (b) LO–TO splitting of the ν3 vibrational mode of CO2. Segregation of the mixture was observed through the shift in the position of the LO and TO modes towards pure CO2 positions which are indicated by blue dashed lines. (c) Thermally induced reaction at 80 K. | ||
Thermal processing, after electron irradiation, induced several changes within the 1![[thin space (1/6-em)]](https://www.rsc.org/images/entities/char_2009.gif) :
:![[thin space (1/6-em)]](https://www.rsc.org/images/entities/char_2009.gif) 1 CO2
1 CO2![[thin space (1/6-em)]](https://www.rsc.org/images/entities/char_2009.gif) :
:![[thin space (1/6-em)]](https://www.rsc.org/images/entities/char_2009.gif) NH3 mixtures as shown in Fig. 4. Similar to the non-irradiated 1
NH3 mixtures as shown in Fig. 4. Similar to the non-irradiated 1![[thin space (1/6-em)]](https://www.rsc.org/images/entities/char_2009.gif) :
:![[thin space (1/6-em)]](https://www.rsc.org/images/entities/char_2009.gif) 1 CO2
1 CO2![[thin space (1/6-em)]](https://www.rsc.org/images/entities/char_2009.gif) :
:![[thin space (1/6-em)]](https://www.rsc.org/images/entities/char_2009.gif) NH3 mixture in RJ20, segregation of the homogeneous mixtures was identified through blue shifts in the CO2 vibrational modes towards pure CO2 wavenumbers between 60–70 K (Fig. 4a and b). Again similar to the non-thermally processed mixtures in RJ20, splitting of the ν2 fundamental mode of NH3 between 60–70 K signified a phase change in NH3. The CO peak area decreased throughout thermal processing until the CO desorbed between 130–150 K, whereas the OCN− peak area increased until it reached a maximum near 130 K before decreasing until the residue material desorbed near 296 K. Between 70–80 K, a thermally induced reaction was initiated similar to the non-irradiated results in RJ20 with the absorption bands of the CO2
NH3 mixture in RJ20, segregation of the homogeneous mixtures was identified through blue shifts in the CO2 vibrational modes towards pure CO2 wavenumbers between 60–70 K (Fig. 4a and b). Again similar to the non-thermally processed mixtures in RJ20, splitting of the ν2 fundamental mode of NH3 between 60–70 K signified a phase change in NH3. The CO peak area decreased throughout thermal processing until the CO desorbed between 130–150 K, whereas the OCN− peak area increased until it reached a maximum near 130 K before decreasing until the residue material desorbed near 296 K. Between 70–80 K, a thermally induced reaction was initiated similar to the non-irradiated results in RJ20 with the absorption bands of the CO2![[thin space (1/6-em)]](https://www.rsc.org/images/entities/char_2009.gif) :
:![[thin space (1/6-em)]](https://www.rsc.org/images/entities/char_2009.gif) NH3 molecular complex also disappearing at this temperature. While CO2 desorbed at a similar temperature in both the e-irradiated and non-irradiated 1
NH3 molecular complex also disappearing at this temperature. While CO2 desorbed at a similar temperature in both the e-irradiated and non-irradiated 1![[thin space (1/6-em)]](https://www.rsc.org/images/entities/char_2009.gif) :
:![[thin space (1/6-em)]](https://www.rsc.org/images/entities/char_2009.gif) 1 mixture of RJ20, the NH3 in the e-irradiated mixture desorbed at a higher temperature compared to NH3 in the non-irradiated mixture. A residue material was present after both CO2 and NH3 had desorbed with slight changes observed in the residue mixture between 150 and 200 K. The residue material from the e-irradiated mixtures desorbed at higher temperatures compared to the non-irradiated mixtures in RJ20.
1 mixture of RJ20, the NH3 in the e-irradiated mixture desorbed at a higher temperature compared to NH3 in the non-irradiated mixture. A residue material was present after both CO2 and NH3 had desorbed with slight changes observed in the residue mixture between 150 and 200 K. The residue material from the e-irradiated mixtures desorbed at higher temperatures compared to the non-irradiated mixtures in RJ20.
The temperatures at which these changes occurred were dependent on the stoichiometric mixing ratio and are listed in Table 3.
| Observation | Ratio | |||||
|---|---|---|---|---|---|---|
4![[thin space (1/6-em)]](https://www.rsc.org/images/entities/char_2009.gif) : :![[thin space (1/6-em)]](https://www.rsc.org/images/entities/char_2009.gif) 1 1 |
2![[thin space (1/6-em)]](https://www.rsc.org/images/entities/char_2009.gif) : :![[thin space (1/6-em)]](https://www.rsc.org/images/entities/char_2009.gif) 1 1 |
1![[thin space (1/6-em)]](https://www.rsc.org/images/entities/char_2009.gif) : :![[thin space (1/6-em)]](https://www.rsc.org/images/entities/char_2009.gif) 1 1 |
1![[thin space (1/6-em)]](https://www.rsc.org/images/entities/char_2009.gif) : :![[thin space (1/6-em)]](https://www.rsc.org/images/entities/char_2009.gif) 2 2 |
1![[thin space (1/6-em)]](https://www.rsc.org/images/entities/char_2009.gif) : :![[thin space (1/6-em)]](https://www.rsc.org/images/entities/char_2009.gif) 5 5 |
1![[thin space (1/6-em)]](https://www.rsc.org/images/entities/char_2009.gif) : :![[thin space (1/6-em)]](https://www.rsc.org/images/entities/char_2009.gif) 10 10 |
|
| CO2 segregation (K) | 30–40 | 50–60 | 60–70 | 60–70 | 70–80 | 70–80 |
| NH3 phase change (K) | 30–40 | 60–70 | 60–70 | 70–80 | 70–80 | 70–80 |
| Thermal reaction (K) | >90 | >90 | >90 | >90 | >90 | >90 |
Disappearance of CO2![[thin space (1/6-em)]](https://www.rsc.org/images/entities/char_2009.gif) : :![[thin space (1/6-em)]](https://www.rsc.org/images/entities/char_2009.gif) NH3 complex (K) NH3 complex (K) |
30–40 | 50–60 | 60–70 | |||
| CO2 desorption (K) | 100–110 | 131–150 | 120–130 | 120–130 | 120–130 | 120–130 |
| NH3 desorption (K) | 90–100 | 100–110 | 100–110 | 130–150 | 130–150 | 130–150 |
| CO desorption (K) | 80–90 | 110–121 | 130–150 | 130–150 | 110–120 | 70–80 |
| OCN− desorption (K) | 223–250 | 248–296 | 250–298 | 250–268 | 250–285 | |
| Change in residue (K) | 150–170 | 150–200 | 150–200 | 150–200 | 150–200 | 150–200 |
| Residue desorption (K) | 198–247 | 250–300 | 248–296 | 250–298 | 250–268 | 250–285 |
An overall comparison of the ratios from the e-irradiated CO2![[thin space (1/6-em)]](https://www.rsc.org/images/entities/char_2009.gif) :
:![[thin space (1/6-em)]](https://www.rsc.org/images/entities/char_2009.gif) NH3 mixtures with the non-irradiated mixtures of RJ20 shows that the temperatures at which segregation of the CO2
NH3 mixtures with the non-irradiated mixtures of RJ20 shows that the temperatures at which segregation of the CO2![[thin space (1/6-em)]](https://www.rsc.org/images/entities/char_2009.gif) :
:![[thin space (1/6-em)]](https://www.rsc.org/images/entities/char_2009.gif) NH3 mixtures commenced and the onset phase change temperature of NH3 were very similar. The estimated electron penetration depth was at most 17%. Therefore, the observed shift in the CO2 absorption bands associated with segregation and the splitting pattern of the ν3 absorption band of NH3 associated with the onset of phase change of NH3 was likely representative of the non-irradiated part of the CO2 : NH3 ice samples.
NH3 mixtures commenced and the onset phase change temperature of NH3 were very similar. The estimated electron penetration depth was at most 17%. Therefore, the observed shift in the CO2 absorption bands associated with segregation and the splitting pattern of the ν3 absorption band of NH3 associated with the onset of phase change of NH3 was likely representative of the non-irradiated part of the CO2 : NH3 ice samples.
The desorption temperatures of CO2 and NH3 were generally higher when subjected to electron irradiation compared to the desorption temperatures of CO2 and NH3 from the non-irradiated study of RJ20. Refractory material overlaying a more volatile material can elevate desorption temperatures due to trapping of molecules beneath the refractory layer21,22 and products formed from e-irradiation likely formed a more refractory layer in our ice mixtures.
3.4 Residue
In addition to e-irradiation induced reaction at 20 K from 1 keV electrons, a thermally induced reaction was observed for all CO2![[thin space (1/6-em)]](https://www.rsc.org/images/entities/char_2009.gif) :
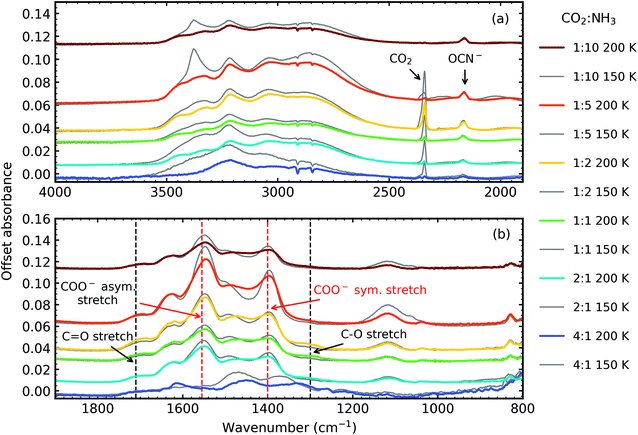
:![[thin space (1/6-em)]](https://www.rsc.org/images/entities/char_2009.gif) NH3 mixtures near ∼90 K. Electron irradiation introduces the formation of new molecules (e.g. CO and OCN−), but the electrons are estimated to only penetrate to a depth of 17% of the thickness of the ice. Although sputtering will reduce the ice thickness, the majority of the mixtures were still mainly composed of CO2 and NH3, as evidenced through the strong absorption bands of CO2 and NH3 observed after e-irradiation shown in Fig. 1 and S10–S14 of the ESI.† The thermal reaction present in the e-irradiated CO2 : NH3 mixtures was, therefore, likely to be the same as the non-irradiated ices in RJ20. Similar to RJ20, ammonium carbamate was identified via the COO− asymmetric and symmetric stretches, and carbamic acid via the C–O and C
NH3 mixtures near ∼90 K. Electron irradiation introduces the formation of new molecules (e.g. CO and OCN−), but the electrons are estimated to only penetrate to a depth of 17% of the thickness of the ice. Although sputtering will reduce the ice thickness, the majority of the mixtures were still mainly composed of CO2 and NH3, as evidenced through the strong absorption bands of CO2 and NH3 observed after e-irradiation shown in Fig. 1 and S10–S14 of the ESI.† The thermal reaction present in the e-irradiated CO2 : NH3 mixtures was, therefore, likely to be the same as the non-irradiated ices in RJ20. Similar to RJ20, ammonium carbamate was identified via the COO− asymmetric and symmetric stretches, and carbamic acid via the C–O and C![[double bond, length as m-dash]](https://www.rsc.org/images/entities/char_e001.gif) O stretches.
O stretches.
Fig. 5 shows the residue spectra at 150 K and 200 K for all CO2 : NH3 ratios. Ammonium carbamate and carbamic acid were identified in the residue spectra at 150 K and 200 K for all mixtures except the 4![[thin space (1/6-em)]](https://www.rsc.org/images/entities/char_2009.gif) :
:![[thin space (1/6-em)]](https://www.rsc.org/images/entities/char_2009.gif) 1 ratio. Among these ratios, the 1
1 ratio. Among these ratios, the 1![[thin space (1/6-em)]](https://www.rsc.org/images/entities/char_2009.gif) :
:![[thin space (1/6-em)]](https://www.rsc.org/images/entities/char_2009.gif) 5 ratio had the highest amount of residue material, followed by the 1
5 ratio had the highest amount of residue material, followed by the 1![[thin space (1/6-em)]](https://www.rsc.org/images/entities/char_2009.gif) :
:![[thin space (1/6-em)]](https://www.rsc.org/images/entities/char_2009.gif) 2 and 1
2 and 1![[thin space (1/6-em)]](https://www.rsc.org/images/entities/char_2009.gif) :
:![[thin space (1/6-em)]](https://www.rsc.org/images/entities/char_2009.gif) 1 ratios, with the 1
1 ratios, with the 1![[thin space (1/6-em)]](https://www.rsc.org/images/entities/char_2009.gif) :
:![[thin space (1/6-em)]](https://www.rsc.org/images/entities/char_2009.gif) 10 and 2
10 and 2![[thin space (1/6-em)]](https://www.rsc.org/images/entities/char_2009.gif) :
:![[thin space (1/6-em)]](https://www.rsc.org/images/entities/char_2009.gif) 1 ratios forming the least amount of residue. Ammonium carbamate to carbamic acid conversion was observed between 150–200 K in all mixtures except the 4
1 ratios forming the least amount of residue. Ammonium carbamate to carbamic acid conversion was observed between 150–200 K in all mixtures except the 4![[thin space (1/6-em)]](https://www.rsc.org/images/entities/char_2009.gif) :
:![[thin space (1/6-em)]](https://www.rsc.org/images/entities/char_2009.gif) 1 ratio.
1 ratio.
From Fig. 5 it is clear that the 4![[thin space (1/6-em)]](https://www.rsc.org/images/entities/char_2009.gif) :
:![[thin space (1/6-em)]](https://www.rsc.org/images/entities/char_2009.gif) 1 residue at 150 K lacks the strong COO− asymmetric and symmetric stretches suggesting that little to no ammonium carbamate formed, the overall residue spectral profile is different from the other ratios. Focussing on the region between 1900–800 cm−1, at 150 K, the 4
1 residue at 150 K lacks the strong COO− asymmetric and symmetric stretches suggesting that little to no ammonium carbamate formed, the overall residue spectral profile is different from the other ratios. Focussing on the region between 1900–800 cm−1, at 150 K, the 4![[thin space (1/6-em)]](https://www.rsc.org/images/entities/char_2009.gif) :
:![[thin space (1/6-em)]](https://www.rsc.org/images/entities/char_2009.gif) 1 residue spectra has broad absorption peaks centred around 1470 cm−1 and 1368 cm−1 and a much weaker absorption peak at 1262 cm−1. Thermal processing to 200 K redshifts the broad peaks observed at 150 K to 1448 cm−1 and 1332 cm−1 and the weaker absorption peak to 1257 cm−1. The appearance of the absorption peak at 1612 cm−1 suggests thermal conversion occurred between 150 K and 200 K. While it is clear that the 4
1 residue spectra has broad absorption peaks centred around 1470 cm−1 and 1368 cm−1 and a much weaker absorption peak at 1262 cm−1. Thermal processing to 200 K redshifts the broad peaks observed at 150 K to 1448 cm−1 and 1332 cm−1 and the weaker absorption peak to 1257 cm−1. The appearance of the absorption peak at 1612 cm−1 suggests thermal conversion occurred between 150 K and 200 K. While it is clear that the 4![[thin space (1/6-em)]](https://www.rsc.org/images/entities/char_2009.gif) :
:![[thin space (1/6-em)]](https://www.rsc.org/images/entities/char_2009.gif) 1 residue was different from the other ratios, identification of this residue is not possible without further experimental and computational investigations.
1 residue was different from the other ratios, identification of this residue is not possible without further experimental and computational investigations.
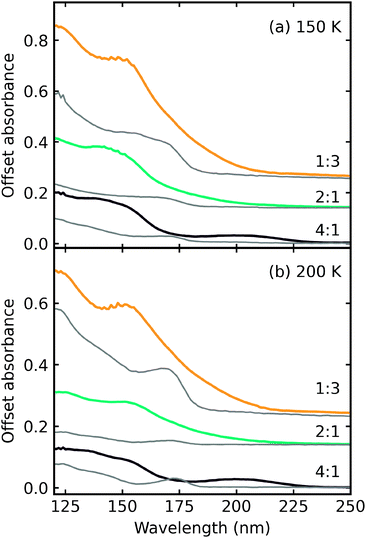
Fig. 6 shows the comparison between the residue spectra of the mid-IR 2![[thin space (1/6-em)]](https://www.rsc.org/images/entities/char_2009.gif) :
:![[thin space (1/6-em)]](https://www.rsc.org/images/entities/char_2009.gif) 1, 1
1, 1![[thin space (1/6-em)]](https://www.rsc.org/images/entities/char_2009.gif) :
:![[thin space (1/6-em)]](https://www.rsc.org/images/entities/char_2009.gif) 1 & 1
1 & 1![[thin space (1/6-em)]](https://www.rsc.org/images/entities/char_2009.gif) :
:![[thin space (1/6-em)]](https://www.rsc.org/images/entities/char_2009.gif) 10 ratios at 150 K and 200 K for the non-irradiated mixtures of RJ20 and the e-irradiated mixtures of this paper. The 1
10 ratios at 150 K and 200 K for the non-irradiated mixtures of RJ20 and the e-irradiated mixtures of this paper. The 1![[thin space (1/6-em)]](https://www.rsc.org/images/entities/char_2009.gif) :
:![[thin space (1/6-em)]](https://www.rsc.org/images/entities/char_2009.gif) 10 residues at 150 K were remarkably similar in profile, suggesting that the thermally induced reaction, initiated at ∼90 K, was not significantly impacted by electron irradiation at 20 K. At 200 K, we observed a thermal conversion of ammonium carbamate to carbamic acid in the RJ20 1
10 residues at 150 K were remarkably similar in profile, suggesting that the thermally induced reaction, initiated at ∼90 K, was not significantly impacted by electron irradiation at 20 K. At 200 K, we observed a thermal conversion of ammonium carbamate to carbamic acid in the RJ20 1![[thin space (1/6-em)]](https://www.rsc.org/images/entities/char_2009.gif) :
:![[thin space (1/6-em)]](https://www.rsc.org/images/entities/char_2009.gif) 10 residue through the increase in the C
10 residue through the increase in the C![[double bond, length as m-dash]](https://www.rsc.org/images/entities/char_e001.gif) O and C–O stretches at ∼1707 cm-1 and ∼1327 cm−1, respectively. However, very little thermal conversion of ammonium carbamate to carbamic acid was observed in the e-irradiated 1
O and C–O stretches at ∼1707 cm-1 and ∼1327 cm−1, respectively. However, very little thermal conversion of ammonium carbamate to carbamic acid was observed in the e-irradiated 1![[thin space (1/6-em)]](https://www.rsc.org/images/entities/char_2009.gif) :
:![[thin space (1/6-em)]](https://www.rsc.org/images/entities/char_2009.gif) 10 ratio. Additionally, OCN− was observed at 150 K and 200 K for the e-irradiated 1
10 ratio. Additionally, OCN− was observed at 150 K and 200 K for the e-irradiated 1![[thin space (1/6-em)]](https://www.rsc.org/images/entities/char_2009.gif) :
:![[thin space (1/6-em)]](https://www.rsc.org/images/entities/char_2009.gif) 10 residue. The e-irradiated residues at 150 K and 200 K were much more intense compared to the non-irradiated residues of RJ20, indicating the formation of higher amounts of residue material.
10 residue. The e-irradiated residues at 150 K and 200 K were much more intense compared to the non-irradiated residues of RJ20, indicating the formation of higher amounts of residue material.
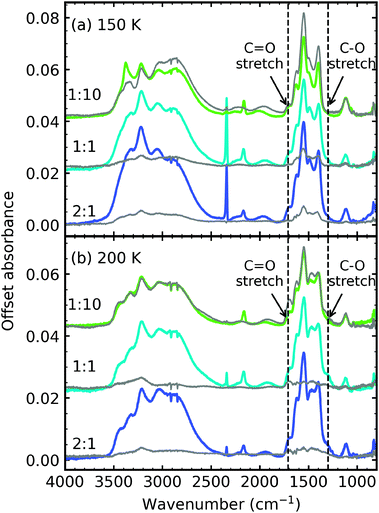 | ||
| Fig. 6 Comparison of the mid-IR residue spectra of the non-irradiated ices from RJ20 (grey traces) and e-irradiated ices of this paper (coloured traces) at (a) 150 K and (b) 200 K. | ||
Electron irradiation at 20 K clearly influences the thermal reactivity of the 2![[thin space (1/6-em)]](https://www.rsc.org/images/entities/char_2009.gif) :
:![[thin space (1/6-em)]](https://www.rsc.org/images/entities/char_2009.gif) 1 & 1
1 & 1![[thin space (1/6-em)]](https://www.rsc.org/images/entities/char_2009.gif) :
:![[thin space (1/6-em)]](https://www.rsc.org/images/entities/char_2009.gif) 1 ratios. In the non-irradiated study of RJ20 the 1
1 ratios. In the non-irradiated study of RJ20 the 1![[thin space (1/6-em)]](https://www.rsc.org/images/entities/char_2009.gif) :
:![[thin space (1/6-em)]](https://www.rsc.org/images/entities/char_2009.gif) 1 and CO2-rich ratios formed lower amounts of residue material compared to the NH3-rich ratios. This was attributed to the different bonding environment of CO2 within the different CO2 : NH3 mixtures. CO2 dimers, which formed mainly in the CO2-rich and 1
1 and CO2-rich ratios formed lower amounts of residue material compared to the NH3-rich ratios. This was attributed to the different bonding environment of CO2 within the different CO2 : NH3 mixtures. CO2 dimers, which formed mainly in the CO2-rich and 1![[thin space (1/6-em)]](https://www.rsc.org/images/entities/char_2009.gif) :
:![[thin space (1/6-em)]](https://www.rsc.org/images/entities/char_2009.gif) 1 mixtures, desorbed at lower temperatures compared to isolated CO2 within an NH3 matrix and CO2
1 mixtures, desorbed at lower temperatures compared to isolated CO2 within an NH3 matrix and CO2![[thin space (1/6-em)]](https://www.rsc.org/images/entities/char_2009.gif) :
:![[thin space (1/6-em)]](https://www.rsc.org/images/entities/char_2009.gif) NH3 complexes found largely in NH3-rich mixtures. As discussed in Section 3.3, e-irradiation of the CO2 : NH3 mixtures appeared to elevate the desorption temperatures of CO2 and NH3 increasing the probability for a thermal reaction to occur before desorption of CO2 and NH3. Also, the residence of CO may play a part, with CO desorption delayed to higher temperatures in the 1
NH3 complexes found largely in NH3-rich mixtures. As discussed in Section 3.3, e-irradiation of the CO2 : NH3 mixtures appeared to elevate the desorption temperatures of CO2 and NH3 increasing the probability for a thermal reaction to occur before desorption of CO2 and NH3. Also, the residence of CO may play a part, with CO desorption delayed to higher temperatures in the 1![[thin space (1/6-em)]](https://www.rsc.org/images/entities/char_2009.gif) :
:![[thin space (1/6-em)]](https://www.rsc.org/images/entities/char_2009.gif) 1 & 1
1 & 1![[thin space (1/6-em)]](https://www.rsc.org/images/entities/char_2009.gif) :
:![[thin space (1/6-em)]](https://www.rsc.org/images/entities/char_2009.gif) 2 and 2
2 and 2![[thin space (1/6-em)]](https://www.rsc.org/images/entities/char_2009.gif) :
:![[thin space (1/6-em)]](https://www.rsc.org/images/entities/char_2009.gif) 1 & 1
1 & 1![[thin space (1/6-em)]](https://www.rsc.org/images/entities/char_2009.gif) :
:![[thin space (1/6-em)]](https://www.rsc.org/images/entities/char_2009.gif) 5 mixtures.
5 mixtures.
4 VUV results
4.1 Electron irradiation and thermal processing of pure CO2 and NH3
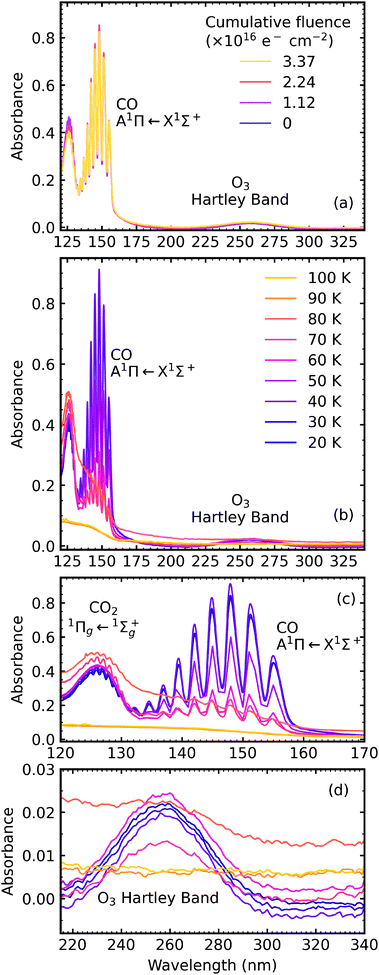
The VUV spectra of pure CO2 ice and pure NH3 ice deposited at 20 K and irradiated with 1 keV electrons at discrete intervals to a total fluence of 3.37 × 10¹⁶ e− cm−2 are shown in Fig. 7a and 8a, respectively. We also present the subsequent thermal processing of the e-irradiated CO2 and NH3 ices in Fig. 7b–d and 8b, respectively.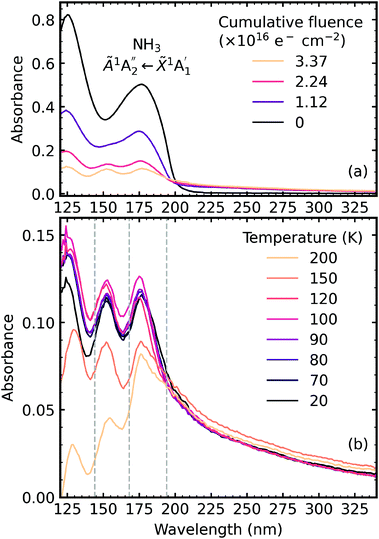 | ||
| Fig. 8 VUV spectra of pure NH3 deposited at 20 K (a) irradiated with 1 keV electrons at discrete intervals to a total fluence of 3.37 × 10¹⁶ e− cm−2 and (b) thermally processed. Grey dashed lines indicate the absorption maxima for gas phase hydrazine.34 | ||
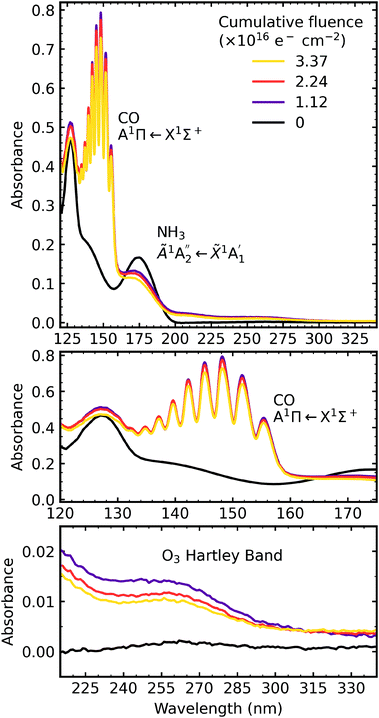
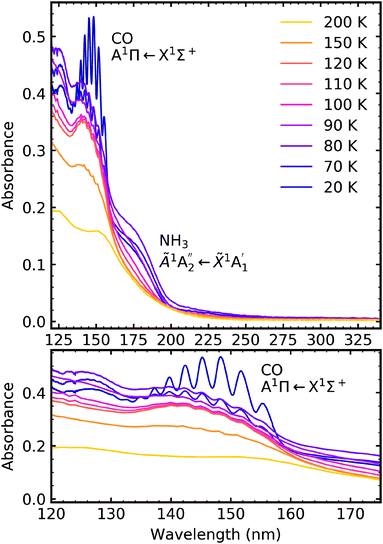
Fig. 7a shows the result of e-irradiation of pure CO2 at 20 K with 1 keV electrons at discrete intervals. The formation of CO was observed by the appearance of an absorption band centred around 147 nm, which had intense vibrational structure, and was due to the A1Π ← X1Σ+ transition.23–25 We tentatively assign the observation of O3 to the broad absorption peak centred around 258 nm, which is known as the Hartley band.26,27 We note that this broad absorption peak may also be ascribed to the Cameron band of CO28 or a combination of both the Hartley band of O3 and the Cameron band of CO. However, interpretation of our e-irradiated CO2 : NH3 mixtures in Section 4.3, suggests that this band was more likely due to the presence of O3. After electron irradiation at 20 K pure CO2 was thermally processed, and VUV spectra were acquired at discrete temperatures until desorption. VUV spectra of the thermal processing of e-irradiated CO2 ice is shown in Fig. 7b with close-ups of the CO absorption band in Fig. 7c and O3 in Fig. 7d. The absorption band of CO due to the A1Π ← X1Σ+ transition disappeared between 80–90 K, as did the absorption band of the Hartley band of O3 with CO2 desorbing around 100 K.
Fig. 8a shows the irradiation of pure NH3 ice at 20 K with 1 keV electrons at discrete intervals. A new absorption feature centred around 150 nm was observed after an irradiation fluence of 1.12 × 10¹⁶ e− cm−2. The intensity of the NH3 absorption peaks decreased significantly throughout electron irradiation. Due to the relatively strong VUV absorption cross-section of NH3 compared to CO2,24 a thinner ice sample was required to prevent saturation of the absorption peaks. The estimated electron penetration depth of the NH3 ice was 54% compared to the CO2 ice which was at 23%. After electron irradiation at 20 K, pure NH3 was thermally processed, and spectra were acquired at discrete temperatures until desorption. VUV spectra of the thermal processing of e-irradiated NH3 ice is shown in Fig. 8b. The e-irradiated absorption features shown in Fig. 8b persisted as a residue until 200 K. We believe a good candidate for this residue profile is hydrazine (N2H4). Previous studies identify hydrazine as a product of non-thermal processing (e.g. electrons, UV photons) of pure NH3 (ref. 29–32) with a desorption temperature between 155–172 K.30,32,33 The gas-phase VUV spectra of N2H4 and N2D4 are characterised by three absorption peaks with maxima near 144 nm, 168 nm & 194 nm.34,35 The three absorption peak maxima in Fig. 8b are at 129 nm, 152 nm & 176 nm, which may represent these the N2H4 bands since a shift in the absorption peaks from the gas phase to the solid phase is common.24
4.2 Deposition at 20 K
The following CO2 : NH3 mixtures were deposited at 20 K: 4![[thin space (1/6-em)]](https://www.rsc.org/images/entities/char_2009.gif) :
:![[thin space (1/6-em)]](https://www.rsc.org/images/entities/char_2009.gif) 1, 2
1, 2![[thin space (1/6-em)]](https://www.rsc.org/images/entities/char_2009.gif) :
:![[thin space (1/6-em)]](https://www.rsc.org/images/entities/char_2009.gif) 1 & 1
1 & 1![[thin space (1/6-em)]](https://www.rsc.org/images/entities/char_2009.gif) :
:![[thin space (1/6-em)]](https://www.rsc.org/images/entities/char_2009.gif) 3 and were the same as the ratios used in the VUV study of RJ20. For detailed characterisation of the CO2 : NH3 mixtures deposited at 20 K see Section 3.1 of RJ20. Deposition spectra are shown in Fig. S3.2 of the ESI.† Briefly, the absorption band due to the
3 and were the same as the ratios used in the VUV study of RJ20. For detailed characterisation of the CO2 : NH3 mixtures deposited at 20 K see Section 3.1 of RJ20. Deposition spectra are shown in Fig. S3.2 of the ESI.† Briefly, the absorption band due to the  electronic transition of NH3 largely overlaps and obscures the CO2 absorption bands due to the 1Πg ← 1Σg+ and 1Δu ← 1Σg+ electronic transitions in the 1
![[thin space (1/6-em)]](https://www.rsc.org/images/entities/char_2009.gif) :
:![[thin space (1/6-em)]](https://www.rsc.org/images/entities/char_2009.gif) 3 ratio. However, in the 4
3 ratio. However, in the 4![[thin space (1/6-em)]](https://www.rsc.org/images/entities/char_2009.gif) :
:![[thin space (1/6-em)]](https://www.rsc.org/images/entities/char_2009.gif) 1 & 2
1 & 2![[thin space (1/6-em)]](https://www.rsc.org/images/entities/char_2009.gif) :
:![[thin space (1/6-em)]](https://www.rsc.org/images/entities/char_2009.gif) 1 ratios the absorption band due to the 1Πg ← 1Σg+ electronic transition of CO2 is visible.
1 ratios the absorption band due to the 1Πg ← 1Σg+ electronic transition of CO2 is visible.
4.3 Electron irradiation at 20 K
After deposition at 20 K the CO2![[thin space (1/6-em)]](https://www.rsc.org/images/entities/char_2009.gif) :
:![[thin space (1/6-em)]](https://www.rsc.org/images/entities/char_2009.gif) NH3 mixtures were irradiated with 1 keV electrons at discrete intervals. Fig. 9–11 show the VUV spectra of the electron irradiation of CO2 : NH3 mixtures in a 4
NH3 mixtures were irradiated with 1 keV electrons at discrete intervals. Fig. 9–11 show the VUV spectra of the electron irradiation of CO2 : NH3 mixtures in a 4![[thin space (1/6-em)]](https://www.rsc.org/images/entities/char_2009.gif) :
:![[thin space (1/6-em)]](https://www.rsc.org/images/entities/char_2009.gif) 1, 2
1, 2![[thin space (1/6-em)]](https://www.rsc.org/images/entities/char_2009.gif) :
:![[thin space (1/6-em)]](https://www.rsc.org/images/entities/char_2009.gif) 1 & 1
1 & 1![[thin space (1/6-em)]](https://www.rsc.org/images/entities/char_2009.gif) :
:![[thin space (1/6-em)]](https://www.rsc.org/images/entities/char_2009.gif) 3 ratio at 20 K, respectively.
3 ratio at 20 K, respectively.
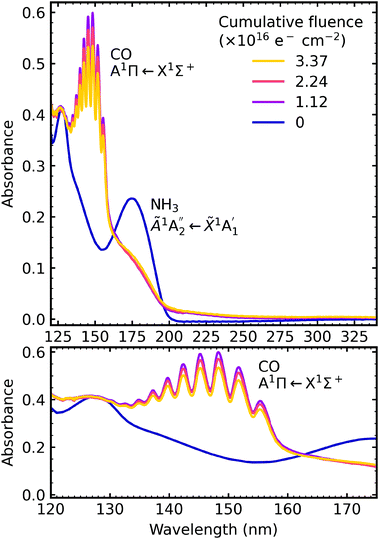
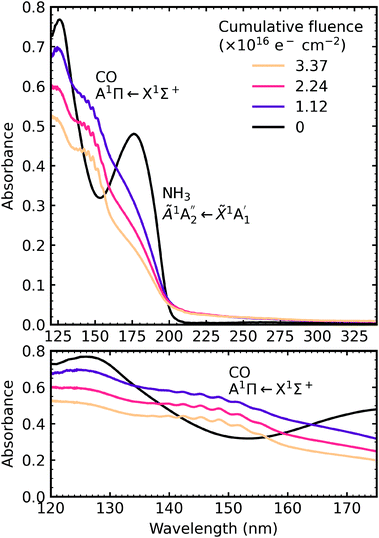
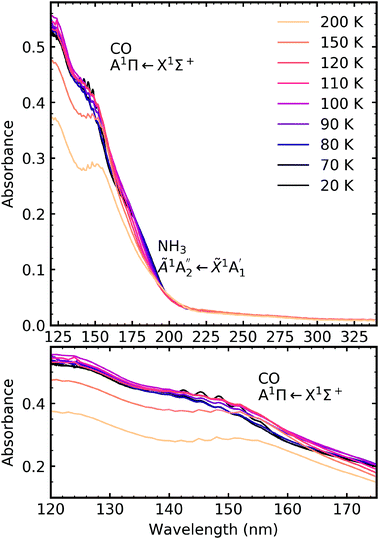
Similar to the mid-IR spectra, the VUV spectra showed changes after electron irradiation. CO formed in all ratios, and was observed via the appearance of an absorption band centred around 147 nm, which was due to the A1Π ← X1Σ+ electronic transition. This transition had vibrational structure, which was most intense for the 4![[thin space (1/6-em)]](https://www.rsc.org/images/entities/char_2009.gif) :
:![[thin space (1/6-em)]](https://www.rsc.org/images/entities/char_2009.gif) 1 ratio, followed by the 2
1 ratio, followed by the 2![[thin space (1/6-em)]](https://www.rsc.org/images/entities/char_2009.gif) :
:![[thin space (1/6-em)]](https://www.rsc.org/images/entities/char_2009.gif) 1 ratio and the 1
1 ratio and the 1![[thin space (1/6-em)]](https://www.rsc.org/images/entities/char_2009.gif) :
:![[thin space (1/6-em)]](https://www.rsc.org/images/entities/char_2009.gif) 3 ratio. All of the ratios showed a decrease in the intensity of the absorption band due to the
3 ratio. All of the ratios showed a decrease in the intensity of the absorption band due to the  electronic transition of NH3, with the excess NH3 ratio (1
![[thin space (1/6-em)]](https://www.rsc.org/images/entities/char_2009.gif) :
:![[thin space (1/6-em)]](https://www.rsc.org/images/entities/char_2009.gif) 3), having the highest relative decrease.
3), having the highest relative decrease.
In addition, the 4![[thin space (1/6-em)]](https://www.rsc.org/images/entities/char_2009.gif) :
:![[thin space (1/6-em)]](https://www.rsc.org/images/entities/char_2009.gif) 1 ratio had a broad absorption peak centred around 258 nm. We believe this absorption peak is due to the Hartley band of O3, rather than the Cameron band of CO. If the peak was due to the Cameron band of CO, we would expect to see it in the 2
1 ratio had a broad absorption peak centred around 258 nm. We believe this absorption peak is due to the Hartley band of O3, rather than the Cameron band of CO. If the peak was due to the Cameron band of CO, we would expect to see it in the 2![[thin space (1/6-em)]](https://www.rsc.org/images/entities/char_2009.gif) :
:![[thin space (1/6-em)]](https://www.rsc.org/images/entities/char_2009.gif) 1 ratio where relatively large amounts of CO were still observed. The formation of O3 was not observed in the mid-IR spectra due to the intense absorption peak of the ν2 absorption band of NH3 obscuring the O3 ν3 absorption peak at 1038 cm−1.
1 ratio where relatively large amounts of CO were still observed. The formation of O3 was not observed in the mid-IR spectra due to the intense absorption peak of the ν2 absorption band of NH3 obscuring the O3 ν3 absorption peak at 1038 cm−1.
4.4 Thermal processing
After electron irradiation at 20 K the CO2 : NH3 mixtures were thermally processed and VUV spectra were measured at discrete temperatures until desorption. Fig. 12–14 show the VUV thermal processing spectra of the e-irradiated 4![[thin space (1/6-em)]](https://www.rsc.org/images/entities/char_2009.gif) :
:![[thin space (1/6-em)]](https://www.rsc.org/images/entities/char_2009.gif) 1, 2
1, 2![[thin space (1/6-em)]](https://www.rsc.org/images/entities/char_2009.gif) :
:![[thin space (1/6-em)]](https://www.rsc.org/images/entities/char_2009.gif) 1 & 1
1 & 1![[thin space (1/6-em)]](https://www.rsc.org/images/entities/char_2009.gif) :
:![[thin space (1/6-em)]](https://www.rsc.org/images/entities/char_2009.gif) 3 ratios, respectively.
3 ratios, respectively.
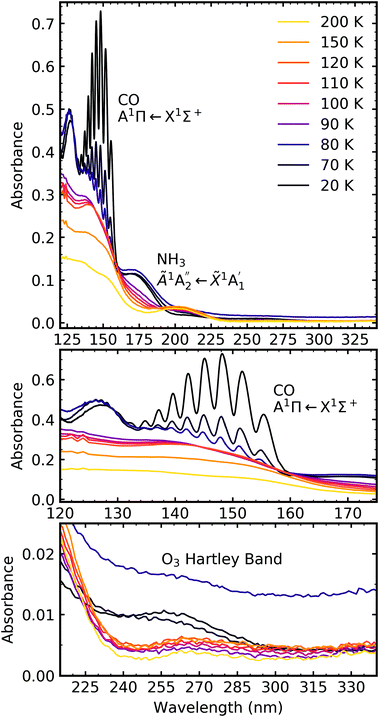
For the 4![[thin space (1/6-em)]](https://www.rsc.org/images/entities/char_2009.gif) :
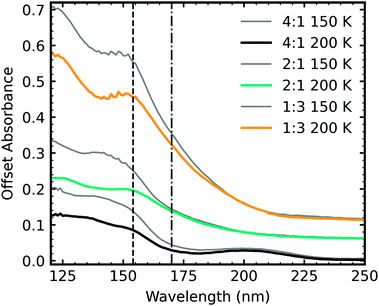
:![[thin space (1/6-em)]](https://www.rsc.org/images/entities/char_2009.gif) 1 ratio, the VUV spectra changed quite significantly between 80–90 K. Desorption of CO was marked by the disappearance of the intense vibrational structure on the absorption band due to the A1Π ← X1Σ+ electronic transition between 80–90 K corroborating the mid-IR results shown in Section 3.3 and consistent with the CO2 desorption temperature in pure irradiated CO2 ice. The Hartley band of O3 also disappeared at the same temperature as CO, indicating O3 desorption. The absorption band due to the
1 ratio, the VUV spectra changed quite significantly between 80–90 K. Desorption of CO was marked by the disappearance of the intense vibrational structure on the absorption band due to the A1Π ← X1Σ+ electronic transition between 80–90 K corroborating the mid-IR results shown in Section 3.3 and consistent with the CO2 desorption temperature in pure irradiated CO2 ice. The Hartley band of O3 also disappeared at the same temperature as CO, indicating O3 desorption. The absorption band due to the  electronic transition of NH3 also decreased significantly between 80–90 K and an absorption band centred around 205 nm also formed at this temperature, indicating a thermal reaction, which continued to increase in intensity until 150 K.
The thermal processing of the VUV spectra for the 2![[thin space (1/6-em)]](https://www.rsc.org/images/entities/char_2009.gif) :
:![[thin space (1/6-em)]](https://www.rsc.org/images/entities/char_2009.gif) 1 and 1
1 and 1![[thin space (1/6-em)]](https://www.rsc.org/images/entities/char_2009.gif) :
:![[thin space (1/6-em)]](https://www.rsc.org/images/entities/char_2009.gif) 3 ratios did not change as significantly as the 4
3 ratios did not change as significantly as the 4![[thin space (1/6-em)]](https://www.rsc.org/images/entities/char_2009.gif) :
:![[thin space (1/6-em)]](https://www.rsc.org/images/entities/char_2009.gif) 1 ratio. The vibrational structure on the absorption band of CO due to the A1Π ← X1Σ+ electronic transition disappeared between 110–120 K for the 2
1 ratio. The vibrational structure on the absorption band of CO due to the A1Π ← X1Σ+ electronic transition disappeared between 110–120 K for the 2![[thin space (1/6-em)]](https://www.rsc.org/images/entities/char_2009.gif) :
:![[thin space (1/6-em)]](https://www.rsc.org/images/entities/char_2009.gif) 1 ratio and 120–150 K for the 1
1 ratio and 120–150 K for the 1![[thin space (1/6-em)]](https://www.rsc.org/images/entities/char_2009.gif) :
:![[thin space (1/6-em)]](https://www.rsc.org/images/entities/char_2009.gif) 3 ratio, corroborating the mid-IR results presented in Section 3.3. The absorption band due to the
3 ratio, corroborating the mid-IR results presented in Section 3.3. The absorption band due to the  electronic transition of NH3 gradually decreased throughout thermal processing until 150 K where it disappeared for the 2
![[thin space (1/6-em)]](https://www.rsc.org/images/entities/char_2009.gif) :
:![[thin space (1/6-em)]](https://www.rsc.org/images/entities/char_2009.gif) 1 ratio. For the 1
1 ratio. For the 1![[thin space (1/6-em)]](https://www.rsc.org/images/entities/char_2009.gif) :
:![[thin space (1/6-em)]](https://www.rsc.org/images/entities/char_2009.gif) 3 ratio, the absorption band due to the
3 ratio, the absorption band due to the  electronic transition of NH3 had mostly disappeared after electron irradiation at 20 K before thermal processing. At 150 K, an absorption peak was observed centred around 145 nm in the 2
![[thin space (1/6-em)]](https://www.rsc.org/images/entities/char_2009.gif) :
:![[thin space (1/6-em)]](https://www.rsc.org/images/entities/char_2009.gif) 1 & 1
1 & 1![[thin space (1/6-em)]](https://www.rsc.org/images/entities/char_2009.gif) :
:![[thin space (1/6-em)]](https://www.rsc.org/images/entities/char_2009.gif) 3 ratios had vibrational structure. At 200 K, the vibrational structure disappeared in the 2
3 ratios had vibrational structure. At 200 K, the vibrational structure disappeared in the 2![[thin space (1/6-em)]](https://www.rsc.org/images/entities/char_2009.gif) :
:![[thin space (1/6-em)]](https://www.rsc.org/images/entities/char_2009.gif) 1 ratio but remained in the 1
1 ratio but remained in the 1![[thin space (1/6-em)]](https://www.rsc.org/images/entities/char_2009.gif) :
:![[thin space (1/6-em)]](https://www.rsc.org/images/entities/char_2009.gif) 3 ratio. This vibrational structure was not associated with CO, which had desorbed between 110–150 K.
3 ratio. This vibrational structure was not associated with CO, which had desorbed between 110–150 K.
In RJ20, a phase change of NH3 was observed via the formation of a Wannier–Mott exciton peak at 194 nm in the 1![[thin space (1/6-em)]](https://www.rsc.org/images/entities/char_2009.gif) :
:![[thin space (1/6-em)]](https://www.rsc.org/images/entities/char_2009.gif) 3 ratio when thermally processed to 90 K. However, no Wannier–Mott exciton was observed in the e-irradiated 1
3 ratio when thermally processed to 90 K. However, no Wannier–Mott exciton was observed in the e-irradiated 1![[thin space (1/6-em)]](https://www.rsc.org/images/entities/char_2009.gif) :
:![[thin space (1/6-em)]](https://www.rsc.org/images/entities/char_2009.gif) 3 ratio. The Wannier–Mott exciton peak intensity is associated with the presence of many NH3 crystallite grain boundaries (i.e., smaller crystallites). Due to electron irradiation, about 42% of the 1
3 ratio. The Wannier–Mott exciton peak intensity is associated with the presence of many NH3 crystallite grain boundaries (i.e., smaller crystallites). Due to electron irradiation, about 42% of the 1![[thin space (1/6-em)]](https://www.rsc.org/images/entities/char_2009.gif) :
:![[thin space (1/6-em)]](https://www.rsc.org/images/entities/char_2009.gif) 3 ratio ice sample was processed, which reduced the number of pure NH3 crystallite grain boundaries in the non-irradiated part of the sample, and hence there was no observation of the NH3 Wannier–Mott exciton peak.
3 ratio ice sample was processed, which reduced the number of pure NH3 crystallite grain boundaries in the non-irradiated part of the sample, and hence there was no observation of the NH3 Wannier–Mott exciton peak.
4.5 Residue
Ammonium carbamate and carbamic acid were identified at 150 K and 200 K for all mid-IR ratios except the 4![[thin space (1/6-em)]](https://www.rsc.org/images/entities/char_2009.gif) :
:![[thin space (1/6-em)]](https://www.rsc.org/images/entities/char_2009.gif) 1 ratio, which exhibited a different residue spectrum (Fig. 5). Fig. 15 shows the VUV residue spectra at 150 K and 200 K for the 4
1 ratio, which exhibited a different residue spectrum (Fig. 5). Fig. 15 shows the VUV residue spectra at 150 K and 200 K for the 4![[thin space (1/6-em)]](https://www.rsc.org/images/entities/char_2009.gif) :
:![[thin space (1/6-em)]](https://www.rsc.org/images/entities/char_2009.gif) 1, 2
1, 2![[thin space (1/6-em)]](https://www.rsc.org/images/entities/char_2009.gif) :
:![[thin space (1/6-em)]](https://www.rsc.org/images/entities/char_2009.gif) 1 & 1
1 & 1![[thin space (1/6-em)]](https://www.rsc.org/images/entities/char_2009.gif) :
:![[thin space (1/6-em)]](https://www.rsc.org/images/entities/char_2009.gif) 3 ratios. At 150 K and 200 K, the 1
3 ratios. At 150 K and 200 K, the 1![[thin space (1/6-em)]](https://www.rsc.org/images/entities/char_2009.gif) :
:![[thin space (1/6-em)]](https://www.rsc.org/images/entities/char_2009.gif) 3 residue profiles were similar. Although, the intensity of the absorption peaks centred around 125 nm and 150 nm decreased at 200 K. A slight redshifting of the 150 nm peak to 152 nm also occurred. The 2
3 residue profiles were similar. Although, the intensity of the absorption peaks centred around 125 nm and 150 nm decreased at 200 K. A slight redshifting of the 150 nm peak to 152 nm also occurred. The 2![[thin space (1/6-em)]](https://www.rsc.org/images/entities/char_2009.gif) :
:![[thin space (1/6-em)]](https://www.rsc.org/images/entities/char_2009.gif) 1 residue has an absorption peak centred around 145 nm at 150 K, which disappeared at 200 K, revealing a peak centred around 154 nm. A peak around 125 nm resolved upon thermal processing. The 4
1 residue has an absorption peak centred around 145 nm at 150 K, which disappeared at 200 K, revealing a peak centred around 154 nm. A peak around 125 nm resolved upon thermal processing. The 4![[thin space (1/6-em)]](https://www.rsc.org/images/entities/char_2009.gif) :
:![[thin space (1/6-em)]](https://www.rsc.org/images/entities/char_2009.gif) 1 residue has peaks centred around 145 nm and 205 nm at 150 K. The peak at 145 nm decreased in intensity upon thermal processing to 200 K, but the peak centred around 205 nm remained at a similar intensity.
1 residue has peaks centred around 145 nm and 205 nm at 150 K. The peak at 145 nm decreased in intensity upon thermal processing to 200 K, but the peak centred around 205 nm remained at a similar intensity.
Fig. 16 shows a direct comparison between the VUV 4![[thin space (1/6-em)]](https://www.rsc.org/images/entities/char_2009.gif) :
:![[thin space (1/6-em)]](https://www.rsc.org/images/entities/char_2009.gif) 1, 2
1, 2![[thin space (1/6-em)]](https://www.rsc.org/images/entities/char_2009.gif) :
:![[thin space (1/6-em)]](https://www.rsc.org/images/entities/char_2009.gif) 1 & 1
1 & 1![[thin space (1/6-em)]](https://www.rsc.org/images/entities/char_2009.gif) :
:![[thin space (1/6-em)]](https://www.rsc.org/images/entities/char_2009.gif) 3 residue spectra of the CO2 : NH3 residues at 150 K and 200 K of the non-irradiated study of RJ20 and the e-irradiated mixtures in this study. In agreement with the mid-IR residue spectra comparison (Fig. 6), the residue spectra for the e-irradiated residues were more intense than the non-irradiated VUV residue spectra of RJ20. At both 150 K and 200 K, the e-irradiated residues lacked the absorption peak at ∼175 nm observed in the RJ20 residues. Similar to the 4
3 residue spectra of the CO2 : NH3 residues at 150 K and 200 K of the non-irradiated study of RJ20 and the e-irradiated mixtures in this study. In agreement with the mid-IR residue spectra comparison (Fig. 6), the residue spectra for the e-irradiated residues were more intense than the non-irradiated VUV residue spectra of RJ20. At both 150 K and 200 K, the e-irradiated residues lacked the absorption peak at ∼175 nm observed in the RJ20 residues. Similar to the 4![[thin space (1/6-em)]](https://www.rsc.org/images/entities/char_2009.gif) :
:![[thin space (1/6-em)]](https://www.rsc.org/images/entities/char_2009.gif) 1 mid-IR residue spectra, the 4
1 mid-IR residue spectra, the 4![[thin space (1/6-em)]](https://www.rsc.org/images/entities/char_2009.gif) :
:![[thin space (1/6-em)]](https://www.rsc.org/images/entities/char_2009.gif) 1 ratio of the e-irradiated residue has a different spectral profile to the equivalent RJ20 ratio.
1 ratio of the e-irradiated residue has a different spectral profile to the equivalent RJ20 ratio.
A tentative assignment of the absorption peaks was given in RJ20 and summarised here. Tentatively, an absorption peak at ∼150 nm was assigned as arising due to an electronic transition of ammonium carbamate, and an absorption peak at ∼170 nm was assigned as arising due to an electronic transition of carbamic acid. No absorption peak was observed at ∼170 nm for the e-irradiated 2![[thin space (1/6-em)]](https://www.rsc.org/images/entities/char_2009.gif) :
:![[thin space (1/6-em)]](https://www.rsc.org/images/entities/char_2009.gif) 1 and 1
1 and 1![[thin space (1/6-em)]](https://www.rsc.org/images/entities/char_2009.gif) :
:![[thin space (1/6-em)]](https://www.rsc.org/images/entities/char_2009.gif) 3 residues, further supporting the assignment of carbamic acid being responsible for the transition at ∼175 nm. Small amounts of carbamic acid were probably present within the 2
3 residues, further supporting the assignment of carbamic acid being responsible for the transition at ∼175 nm. Small amounts of carbamic acid were probably present within the 2![[thin space (1/6-em)]](https://www.rsc.org/images/entities/char_2009.gif) :
:![[thin space (1/6-em)]](https://www.rsc.org/images/entities/char_2009.gif) 1 and 1
1 and 1![[thin space (1/6-em)]](https://www.rsc.org/images/entities/char_2009.gif) :
:![[thin space (1/6-em)]](https://www.rsc.org/images/entities/char_2009.gif) 3 residues but obscured by the ammonium carbamate transition at ∼150 nm. The absence of an absorption peak at ∼170 nm in the e-irradiated 4
3 residues but obscured by the ammonium carbamate transition at ∼150 nm. The absence of an absorption peak at ∼170 nm in the e-irradiated 4![[thin space (1/6-em)]](https://www.rsc.org/images/entities/char_2009.gif) :
:![[thin space (1/6-em)]](https://www.rsc.org/images/entities/char_2009.gif) 1 ratio also confirmed the mid-IR results of Section 3.4 which showed no evidence of the formation of carbamic acid. The e-irradiated residue spectra at 200 K for all mixtures contained a transition at ∼150 nm. This transition was tentatively assigned as being due to ammonium carbamate in RJ20. No strong COO− stretches were present in the mid-IR 4
1 ratio also confirmed the mid-IR results of Section 3.4 which showed no evidence of the formation of carbamic acid. The e-irradiated residue spectra at 200 K for all mixtures contained a transition at ∼150 nm. This transition was tentatively assigned as being due to ammonium carbamate in RJ20. No strong COO− stretches were present in the mid-IR 4![[thin space (1/6-em)]](https://www.rsc.org/images/entities/char_2009.gif) :
:![[thin space (1/6-em)]](https://www.rsc.org/images/entities/char_2009.gif) 1 residues (Fig. 5), suggesting that ammonium carbamate was not present in this mixture.
1 residues (Fig. 5), suggesting that ammonium carbamate was not present in this mixture.
4.6 Rayleigh scattering tails
Rayleigh scattering tails are observed in VUV spectra when particle sizes are less than λ\10, and the intensity of scattered light is proportional to λ−4. Similar to RJ20, Rayleigh scattering tails were observed because of the rough, clumpy surface of the ice film as opposed to scattering tails observed in astrophysical ices, which did not fully wet the surface.36,37The Rayleigh scattering tails were fitted using the following model introduced in RJ20:
 | (1) |
Similar to RJ20 we present the Rayleigh scattering tails as a fractional change in the constant of proportionality of the processed ice relative to the constant of proportionality at deposition (Δc):
 | (2) |
Fig. 17 shows the thermal evolution of Δc after 1 keV electron irradiation for pure NH3 (0![[thin space (1/6-em)]](https://www.rsc.org/images/entities/char_2009.gif) :
:![[thin space (1/6-em)]](https://www.rsc.org/images/entities/char_2009.gif) 1) and the CO2
1) and the CO2![[thin space (1/6-em)]](https://www.rsc.org/images/entities/char_2009.gif) :
:![[thin space (1/6-em)]](https://www.rsc.org/images/entities/char_2009.gif) NH3 mixtures (4
NH3 mixtures (4![[thin space (1/6-em)]](https://www.rsc.org/images/entities/char_2009.gif) :
:![[thin space (1/6-em)]](https://www.rsc.org/images/entities/char_2009.gif) 1, 2
1, 2![[thin space (1/6-em)]](https://www.rsc.org/images/entities/char_2009.gif) :
:![[thin space (1/6-em)]](https://www.rsc.org/images/entities/char_2009.gif) 1 & 1
1 & 1![[thin space (1/6-em)]](https://www.rsc.org/images/entities/char_2009.gif) :
:![[thin space (1/6-em)]](https://www.rsc.org/images/entities/char_2009.gif) 3). The scattering tails for pure CO2 were outside the Rayleigh scattering regime. In Fig. 17 there are two scatter points marked at 20 K for each ratio. The white crosshair scatter points indicate the Δc values after 1 keV electron irradiation to a total fluence of 3.37 × 10¹⁶ e− cm−2. For all CO2
3). The scattering tails for pure CO2 were outside the Rayleigh scattering regime. In Fig. 17 there are two scatter points marked at 20 K for each ratio. The white crosshair scatter points indicate the Δc values after 1 keV electron irradiation to a total fluence of 3.37 × 10¹⁶ e− cm−2. For all CO2![[thin space (1/6-em)]](https://www.rsc.org/images/entities/char_2009.gif) :
:![[thin space (1/6-em)]](https://www.rsc.org/images/entities/char_2009.gif) NH3 ratios and pure NH3 the Δc value was significantly higher after electron irradiation compared to before deposition. Molecular dissociation and the formation of new products due to electron irradiation of the samples appeared to disrupt the ice structure. These VUV scattering results provide direct evidence that as well as inducing chemical changes, electron irradiation also caused macroscopic changes in ice structure and morphology. A significant decrease in the Δc value at 90 K, for the 4
NH3 ratios and pure NH3 the Δc value was significantly higher after electron irradiation compared to before deposition. Molecular dissociation and the formation of new products due to electron irradiation of the samples appeared to disrupt the ice structure. These VUV scattering results provide direct evidence that as well as inducing chemical changes, electron irradiation also caused macroscopic changes in ice structure and morphology. A significant decrease in the Δc value at 90 K, for the 4![[thin space (1/6-em)]](https://www.rsc.org/images/entities/char_2009.gif) :
:![[thin space (1/6-em)]](https://www.rsc.org/images/entities/char_2009.gif) 1 ratio, and to a lesser extent the 2
1 ratio, and to a lesser extent the 2![[thin space (1/6-em)]](https://www.rsc.org/images/entities/char_2009.gif) :
:![[thin space (1/6-em)]](https://www.rsc.org/images/entities/char_2009.gif) 1, corresponded to the combined desorption of CO and CO2, consequently leading to rearrangement within the ice. The 1
1, corresponded to the combined desorption of CO and CO2, consequently leading to rearrangement within the ice. The 1![[thin space (1/6-em)]](https://www.rsc.org/images/entities/char_2009.gif) :
:![[thin space (1/6-em)]](https://www.rsc.org/images/entities/char_2009.gif) 3 had the least amount of CO2 and CO and their desorption appeared to have little effect on the Δc value. The Δc value of pure NH3 also remained relatively constant throughout thermal processing after electron irradiation at 20 K.
3 had the least amount of CO2 and CO and their desorption appeared to have little effect on the Δc value. The Δc value of pure NH3 also remained relatively constant throughout thermal processing after electron irradiation at 20 K.
5 Discussion
We set out with the aim of demonstrating the impact that the different chemical and physical properties of a range of stoichiometric CO2![[thin space (1/6-em)]](https://www.rsc.org/images/entities/char_2009.gif) :
:![[thin space (1/6-em)]](https://www.rsc.org/images/entities/char_2009.gif) NH3 ice mixtures can have on the molecular synthesis induced by electron irradiation and subsequent thermal processing.
NH3 ice mixtures can have on the molecular synthesis induced by electron irradiation and subsequent thermal processing.
In agreement with three out of four previous studies on the non-thermal processing of CO2 : NH3 ices below 16 K, we observed the formation of CO and OCN− after 1 keV electron irradiation at 20 K.4–6 Bertin et al. did not observe CO or OCN− after 9–20 eV electron irradiation at 30 K and noted that if CO had formed, it would have desorbed at their working temperature of 30 K. Given that OCN− requires the formation of CO, this would explain the lack of OCN−.4,5 For the other products reported in previous studies, i.e. ammonium carbamate, ammonium formate, carbamic acid, NH+4 and N2O, most of their identifying functional groups are within the 3500–2800 cm−1 or 1800–1250 cm−1 regions where significant overlap occurs with the strong NH3 absorption bands. We find it difficult to make absolute assignments of the IR absorption peaks within these two regions. Overlap from the intense NH3 absorption bands, similar functional groups present within molecules (e.g. ammonium carbamate and ammonium formate), and matrix-isolation effects due to the different stoichiometric ratios of CO2![[thin space (1/6-em)]](https://www.rsc.org/images/entities/char_2009.gif) :
:![[thin space (1/6-em)]](https://www.rsc.org/images/entities/char_2009.gif) NH3 mixtures are all contributing factors. As such, we do not identify molecules within this region at e-irradiation temperatures.
NH3 mixtures are all contributing factors. As such, we do not identify molecules within this region at e-irradiation temperatures.
Our e-irradiation of stoichiometric ratios revealed that the 4![[thin space (1/6-em)]](https://www.rsc.org/images/entities/char_2009.gif) :
:![[thin space (1/6-em)]](https://www.rsc.org/images/entities/char_2009.gif) 1 ratio formed O3, not observed in the other ratios. O3 formation in pure CO2 is a multi-step process which is summarised below:
1 ratio formed O3, not observed in the other ratios. O3 formation in pure CO2 is a multi-step process which is summarised below:
| CO2 → CO + O | (3) |
| O + O → O2 | (4) |
| O2 + O → O3 | (5) |
![[thin space (1/6-em)]](https://www.rsc.org/images/entities/char_2009.gif) :
:![[thin space (1/6-em)]](https://www.rsc.org/images/entities/char_2009.gif) NH3 mixtures, the only source of O atoms comes from the CO2 and therefore it is not surprising that O3 was formed in CO2
NH3 mixtures, the only source of O atoms comes from the CO2 and therefore it is not surprising that O3 was formed in CO2![[thin space (1/6-em)]](https://www.rsc.org/images/entities/char_2009.gif) :
:![[thin space (1/6-em)]](https://www.rsc.org/images/entities/char_2009.gif) NH3 mixture with the highest amount of CO2. However, compared to the O3 absorption peak in the pure CO2 ice, the O3 absorption peak in the 4
NH3 mixture with the highest amount of CO2. However, compared to the O3 absorption peak in the pure CO2 ice, the O3 absorption peak in the 4![[thin space (1/6-em)]](https://www.rsc.org/images/entities/char_2009.gif) :
:![[thin space (1/6-em)]](https://www.rsc.org/images/entities/char_2009.gif) 1 ratio is much weaker, indicating a lower amount of O3 formed in the 4
1 ratio is much weaker, indicating a lower amount of O3 formed in the 4![[thin space (1/6-em)]](https://www.rsc.org/images/entities/char_2009.gif) :
:![[thin space (1/6-em)]](https://www.rsc.org/images/entities/char_2009.gif) 1 ratio compared to the pure CO2 ice. Apart from there being fewer O atoms available due to less CO2, other reactions occurring due to the presence of NH3 and its e-irradiated products in the mixtures will reduce the amount O atoms available for O3 formation. It appears that for the other CO2
1 ratio compared to the pure CO2 ice. Apart from there being fewer O atoms available due to less CO2, other reactions occurring due to the presence of NH3 and its e-irradiated products in the mixtures will reduce the amount O atoms available for O3 formation. It appears that for the other CO2![[thin space (1/6-em)]](https://www.rsc.org/images/entities/char_2009.gif) :
:![[thin space (1/6-em)]](https://www.rsc.org/images/entities/char_2009.gif) NH3 mixtures, O-containing molecules like OCN− are formed either preferentially over O3 during e-irradiation or deplete the available O-atoms before O3 can form.
NH3 mixtures, O-containing molecules like OCN− are formed either preferentially over O3 during e-irradiation or deplete the available O-atoms before O3 can form.
Our VUV spectroscopic study was particularly useful for observing the formation of O3, which was otherwise obscured by the intense ν2 absorption band of NH3 in the mid-IR study. Other than the identification of CO, OCN− and O3, no identification of products due to e-irradiation was made. Mid-IR spectra obtained for the stoichiometric mixing ratios of CO2![[thin space (1/6-em)]](https://www.rsc.org/images/entities/char_2009.gif) :
:![[thin space (1/6-em)]](https://www.rsc.org/images/entities/char_2009.gif) NH3 indicated a ratio-dependence on products formed from e-irradiation with NH3-rich mixtures showing more complex spectra within the region between 1800–1200 cm−1.
NH3 indicated a ratio-dependence on products formed from e-irradiation with NH3-rich mixtures showing more complex spectra within the region between 1800–1200 cm−1.
Comparison of our 1![[thin space (1/6-em)]](https://www.rsc.org/images/entities/char_2009.gif) :
:![[thin space (1/6-em)]](https://www.rsc.org/images/entities/char_2009.gif) 1 CO2 : NH3 residue results with the residue of Jheeta et al., who also used 1 keV electrons to irradiate their 1
1 CO2 : NH3 residue results with the residue of Jheeta et al., who also used 1 keV electrons to irradiate their 1![[thin space (1/6-em)]](https://www.rsc.org/images/entities/char_2009.gif) :
:![[thin space (1/6-em)]](https://www.rsc.org/images/entities/char_2009.gif) 1 CO2
1 CO2![[thin space (1/6-em)]](https://www.rsc.org/images/entities/char_2009.gif) :
:![[thin space (1/6-em)]](https://www.rsc.org/images/entities/char_2009.gif) NH3 mixture albeit at a slightly higher temperature of 30 K, showed good agreement.4 While Jheeta et al. only identified ammonium carbamate, an absorption peak at ∼1700 cm−1 is indicative of a C
NH3 mixture albeit at a slightly higher temperature of 30 K, showed good agreement.4 While Jheeta et al. only identified ammonium carbamate, an absorption peak at ∼1700 cm−1 is indicative of a C![[double bond, length as m-dash]](https://www.rsc.org/images/entities/char_e001.gif) O stretch suggesting that carbamic acid was also present. Our 1
O stretch suggesting that carbamic acid was also present. Our 1![[thin space (1/6-em)]](https://www.rsc.org/images/entities/char_2009.gif) :
:![[thin space (1/6-em)]](https://www.rsc.org/images/entities/char_2009.gif) 1 results were also in agreement with the 1
1 results were also in agreement with the 1![[thin space (1/6-em)]](https://www.rsc.org/images/entities/char_2009.gif) :
:![[thin space (1/6-em)]](https://www.rsc.org/images/entities/char_2009.gif) 1 residues of Bossa et al.5 and Bertin et al.3 who identified ammonium carbamate and carbamic acid within their residue material. No comparison was made with Lv et al.6 as they did not thermally process their irradiated CO2
1 residues of Bossa et al.5 and Bertin et al.3 who identified ammonium carbamate and carbamic acid within their residue material. No comparison was made with Lv et al.6 as they did not thermally process their irradiated CO2![[thin space (1/6-em)]](https://www.rsc.org/images/entities/char_2009.gif) : NH3 mixtures.
: NH3 mixtures.
By combining our e-irradiated results with our non-irradiated thermal study of CO2![[thin space (1/6-em)]](https://www.rsc.org/images/entities/char_2009.gif) :
:![[thin space (1/6-em)]](https://www.rsc.org/images/entities/char_2009.gif) NH3 mixtures, presented in RJ20, we were able to further elucidate the impact of electron irradiation. Excluding the 4
NH3 mixtures, presented in RJ20, we were able to further elucidate the impact of electron irradiation. Excluding the 4![[thin space (1/6-em)]](https://www.rsc.org/images/entities/char_2009.gif) :
:![[thin space (1/6-em)]](https://www.rsc.org/images/entities/char_2009.gif) 1 ratio, all of the other e-irradiated CO2 : NH3 ratios formed a similar residue to the non-irradiated residues in RJ20. This suggests that the e-irradiated residues, apart from the 4
1 ratio, all of the other e-irradiated CO2 : NH3 ratios formed a similar residue to the non-irradiated residues in RJ20. This suggests that the e-irradiated residues, apart from the 4![[thin space (1/6-em)]](https://www.rsc.org/images/entities/char_2009.gif) :
:![[thin space (1/6-em)]](https://www.rsc.org/images/entities/char_2009.gif) 1 residue, are comprised of products mainly induced by the thermal reaction occurring at approximately 80–90 K. However, higher amounts of residue material formed in the e-irradiated CO2
1 residue, are comprised of products mainly induced by the thermal reaction occurring at approximately 80–90 K. However, higher amounts of residue material formed in the e-irradiated CO2![[thin space (1/6-em)]](https://www.rsc.org/images/entities/char_2009.gif) :
:![[thin space (1/6-em)]](https://www.rsc.org/images/entities/char_2009.gif) NH3 mixtures compared to the non-irradiated mixtures of RJ20. We believe this was due to the refractory layer formed from electron irradiation at 20 K, which consequently elevated the desorption temperature of CO2, thus allowing more time for a thermal reaction to occur. This corresponds to the practices within the literature which use more refractory molecules as ‘plugs’ to prevent the desorption of more volatile molecules.21,22
NH3 mixtures compared to the non-irradiated mixtures of RJ20. We believe this was due to the refractory layer formed from electron irradiation at 20 K, which consequently elevated the desorption temperature of CO2, thus allowing more time for a thermal reaction to occur. This corresponds to the practices within the literature which use more refractory molecules as ‘plugs’ to prevent the desorption of more volatile molecules.21,22
We also observed that less conversion of ammonium carbamate to carbamic acid occurred in the e-irradiated CO2![[thin space (1/6-em)]](https://www.rsc.org/images/entities/char_2009.gif) :
:![[thin space (1/6-em)]](https://www.rsc.org/images/entities/char_2009.gif) NH3 mixtures upon thermal processing between 150–200 K. For example, the non-irradiated CO2 : NH3 2
NH3 mixtures upon thermal processing between 150–200 K. For example, the non-irradiated CO2 : NH3 2![[thin space (1/6-em)]](https://www.rsc.org/images/entities/char_2009.gif) :
:![[thin space (1/6-em)]](https://www.rsc.org/images/entities/char_2009.gif) 1, 1
1, 1![[thin space (1/6-em)]](https://www.rsc.org/images/entities/char_2009.gif) :
:![[thin space (1/6-em)]](https://www.rsc.org/images/entities/char_2009.gif) 1, 1
1, 1![[thin space (1/6-em)]](https://www.rsc.org/images/entities/char_2009.gif) :
:![[thin space (1/6-em)]](https://www.rsc.org/images/entities/char_2009.gif) 3 & 1
3 & 1![[thin space (1/6-em)]](https://www.rsc.org/images/entities/char_2009.gif) :
:![[thin space (1/6-em)]](https://www.rsc.org/images/entities/char_2009.gif) 10 mixtures showed an increase in the C
10 mixtures showed an increase in the C![[double bond, length as m-dash]](https://www.rsc.org/images/entities/char_e001.gif) O and C–O stretch in Fig. 5 of RJ20, whereas, very little change was observed in Fig. 5 for the thermally processed e-irradiated CO2 : NH3 mixtures. Ammonium carbamate appears to be stabilised by the products in the e-irradiated mixtures. At 150 K and 200 K, the e-irradiated product of OCN− is present, which we suggest stabilises the ammonium carbamate, thus preventing decomposition to carbamic acid at higher temperatures.
O and C–O stretch in Fig. 5 of RJ20, whereas, very little change was observed in Fig. 5 for the thermally processed e-irradiated CO2 : NH3 mixtures. Ammonium carbamate appears to be stabilised by the products in the e-irradiated mixtures. At 150 K and 200 K, the e-irradiated product of OCN− is present, which we suggest stabilises the ammonium carbamate, thus preventing decomposition to carbamic acid at higher temperatures.
The Rayleigh scattering tails obtained from VUV spectra gave direct evidence of physical changes within the CO2![[thin space (1/6-em)]](https://www.rsc.org/images/entities/char_2009.gif) :
:![[thin space (1/6-em)]](https://www.rsc.org/images/entities/char_2009.gif) NH3 ice mixtures due toelectron irradiation.
NH3 ice mixtures due toelectron irradiation.
6 Conclusions
We systematically investigated the effect of the stoichiometric mixing ratio on 1 keV e-irradiated CO2 : NH3 ices and subsequent thermal processing using mid-IR and VUV spectroscopy. Our work is the first time that a study has focussed on the non-thermal processing of stoichiometric mixing ratios of CO2![[thin space (1/6-em)]](https://www.rsc.org/images/entities/char_2009.gif) : NH3 ices. We show that the small e-irradiation products of CO and OCN− are strongly dependent on the initial mixing ratio of CO2 and NH3, with no observable OCN− formed in the 4
: NH3 ices. We show that the small e-irradiation products of CO and OCN− are strongly dependent on the initial mixing ratio of CO2 and NH3, with no observable OCN− formed in the 4![[thin space (1/6-em)]](https://www.rsc.org/images/entities/char_2009.gif) :
:![[thin space (1/6-em)]](https://www.rsc.org/images/entities/char_2009.gif) 1 ratio. However, the 4
1 ratio. However, the 4![[thin space (1/6-em)]](https://www.rsc.org/images/entities/char_2009.gif) :
:![[thin space (1/6-em)]](https://www.rsc.org/images/entities/char_2009.gif) 1 ratio did form O3 after e-irradiation at 20 K which was not observed in the other CO2 : NH3 mixtures. We also show that the CO2-rich, e-irradiated 4
1 ratio did form O3 after e-irradiation at 20 K which was not observed in the other CO2 : NH3 mixtures. We also show that the CO2-rich, e-irradiated 4![[thin space (1/6-em)]](https://www.rsc.org/images/entities/char_2009.gif) :
:![[thin space (1/6-em)]](https://www.rsc.org/images/entities/char_2009.gif) 1 CO2
1 CO2![[thin space (1/6-em)]](https://www.rsc.org/images/entities/char_2009.gif) :
:![[thin space (1/6-em)]](https://www.rsc.org/images/entities/char_2009.gif) NH3 ratio formed a markedly different residue upon thermal processing compared to the other ratios. The other ratios formed similar residues between themselves and similar residues to their thermal processing counterpart residues from RJ20. However, ammonium carbamate to carbamic acid conversion was arrested in the e-irradiated residues. The astrophysical implications of these results, along with the results of RJ20, will be discussed in a forthcoming paper.
NH3 ratio formed a markedly different residue upon thermal processing compared to the other ratios. The other ratios formed similar residues between themselves and similar residues to their thermal processing counterpart residues from RJ20. However, ammonium carbamate to carbamic acid conversion was arrested in the e-irradiated residues. The astrophysical implications of these results, along with the results of RJ20, will be discussed in a forthcoming paper.
Conflicts of interest
There are no conflicts to declare.Acknowledgements
The research leading to this result has been supported by the project CALIPSOplus under the Grant Agreement 730872 from the EU Framework Programme for Research and Innovation HORIZON 2020. R. L. J. acknowledges the STFC for her PhD Studentship under grant no. ST/N50421X/1. S. I. acknowledges the Royal Society for financial support. All mid-IR and VUV spectra are available on the ORDO Repository (DOI: 10.21954/ou.rd.15028614).Notes and references
- R. L. James, S. Ioppolo, S. Hoffmann, N. C. Jones, N. J. Mason and A. Dawes, RSC Adv., 2020, 10, 37515–37528 RSC.
- S. M. Pimblott and J. A. LaVerne, Radiat. Phys. Chem., 2007, 76, 1244–1247 CrossRef CAS.
- M. Bertin, I. Martin, F. Duvernay, P. Theule, J. B. Bossa, F. Borget, E. Illenberger, A. Lafosse, T. Chiavassa and R. Azria, Phys. Chem. Chem. Phys., 2009, 11, 1383–1845 RSC.
- S. Jheeta, S. Ptasinska, B. Sivaraman and N. J. Mason, Chem. Phys. Lett., 2012, 543, 208–212 CrossRef CAS.
- J. B. Bossa, F. Duvernay, P. Theulé, F. Borget and T. Chiavassa, Chem. Phys., 2008, 354, 211–217 CrossRef CAS.
- X. Y. Lv, P. Boduch, J. J. Ding, A. Domaracka, T. Langlinay, M. E. Palumbo, H. Rothard and G. Strazzulla, Phys. Chem. Chem. Phys., 2012, 16, 3433–3441 RSC.
- D. Frasco, J. Chem. Phys., 1964, 41, 2134–2140 CrossRef CAS.
- I. C. Hisatsune, Can. J. Chem., 1983, 62, 945–948 CrossRef.
- Y. Rodríguez-Lazcano, B. Maté, V. J. Herrero, R. Escribano and Ó. Gálvez, Phys. Chem. Chem. Phys., 2014, 16, 3371–3380 RSC.
- J. A. Noble, P. Theule, F. Duvernay, G. Danger, T. Chiavassa, P. Ghesquiere, T. Mineva and D. Talbi, Phys. Chem. Chem. Phys., 2014, 16, 23604–23615 RSC.
- A. Potapov, P. Theulé, C. Jäger and T. Henning, Astrophy. J., 2019, 878, L20 CrossRef CAS.
- A. Potapov, C. Jäger and T. Henning, Astrophys. J., 2020, 894, 110 CrossRef CAS.
- R. L. James, S. Ioppolo, N. Jones, S. Hoffmann, N. Mason and A. Dawes, Systematic investigation of CO2
![[thin space (1/6-em)]](https://www.rsc.org/images/entities/char_2009.gif) :
:![[thin space (1/6-em)]](https://www.rsc.org/images/entities/char_2009.gif) NH3 ice mixtures using mid-IR and VUV spectroscopy - Part 2: electron irradiation and thermal processing dataset, DOI:10.21954/ou.rd.15028614.
NH3 ice mixtures using mid-IR and VUV spectroscopy - Part 2: electron irradiation and thermal processing dataset, DOI:10.21954/ou.rd.15028614. - D. Drouin, A. R. Couture, D. Joly, X. Tastet, V. Aimez and R. Gauvin, Scanning, 2007, 29, 92–101 CrossRef CAS PubMed.
- M. Bouilloud, N. Fray, Y. Bénilan, H. Cottin, M.-C. Gazeau and A. Jolly, Mon. Not. R. Astron. Soc., 2015, 451, 2145–2160 CrossRef CAS.
- F. A. van Broekhuizen, K. M. Pontoppidan, H. J. Fraser and E. F. van Dishoeck, Astron. Astrophys., 2005, 441, 249–260 CrossRef CAS.
- S. A. Sandford, L. J. Allamandola, A. G. G. M. Tielens and G. J. Valero, Astrophys. J., 1988, 329, 498 CrossRef CAS PubMed.
- J. A. Noble, P. Theule, F. Borget, G. Danger, M. Chomat, F. Duvernay, F. Mispelaer and T. Chiavassa, Mon. Not. R. Astron. Soc., 2012, 428, 3262–3273 CrossRef.
- C. J. Bennett, C. Jamieson, A. M. Mebel and R. I. Kaiser, Phys. Chem. Chem. Phys., 2004, 6, 735–746 RSC.
- D. McCaa and J. Shaw, J. Mol. Spectrosc., 1968, 25, 374–397 CrossRef CAS.
- P. Ghesquière, A. Ivlev, J. A. Noble and P. Theulé, Astron. Astrophys., 2018, 614, A107 CrossRef.
- J. Kalvans and J. R. Kalnin, Astron. Astrophys., 2020, 633, A97 CrossRef CAS.
- M. Brith and O. Schnepp, Mol. Phys., 1965, 9, 473–489 CrossRef CAS.
- N. J. Mason, A. Dawes, P. D. Holtom, R. J. Mukerji, M. P. Davis, B. Sivaraman, R. I. Kaiser, S. V. Hoffmann and D. A. Shaw, Faraday Discuss., 2006, 133, 311–329 RSC.
- G. A. Cruz-Diaz, G. M. Muñoz Caro, Y.-J. Chen and T.-S. Yih, Astron. Astrophys., 2014, 562, A119 CrossRef.
- B. Sivaraman, B. Nair, B. Raja Sekhar, J.-I. Lo, R. Sridharan, B.-M. Cheng and N. Mason, Chem. Phys. Lett., 2014, 603, 33–36 CrossRef CAS.
- B. M. Jones, R. I. Kaiser and G. Strazzulla, Astrophy. J., 2014, 781, 85 CrossRef.
- B. Minaev, O. Plachkevytch and H. Ågren, J. Chem. Soc., Faraday Trans., 1995, 91, 1729–1733 RSC.
- P. A. Gerakines, W. A. Schutte and P. Ehrenfreund, Astron. Astrophys., 1996, 312, 289–305 CAS.
- W. Zheng, D. Jewitt, Y. Osamura and R. I. Kaiser, Astrophys. J., 2008, 674, 1242–1250 CrossRef CAS.
- V. Bordalo, E. F. da Silveira, X. Y. Lv, A. Domaracka, H. Rothard, E. S. Duarte and P. Boduch, Astrophy. J., 2013, 774, 105 CrossRef.
- K. E. Shulenberger, J. L. Zhu, K. Tran, S. Abdullahi, C. Belvin, J. Lukens, Z. Peeler, E. Mullikin, H. M. Cumberbatch, J. Huang, K. Regovich, A. Zhou, L. Heller, M. Markovic, L. Gates, C. Buffo, R. Tano-Menka, C. R. Arumainayagam, E. Böhler, P. Swiderek, S. Esmaili, A. D. Bass, M. Huels and L. Sanche, ACS Earth Space Chem, 2019, 3, 800–810 CrossRef CAS.
- R. Martín-Doménech, G. A. Cruz-Díaz and G. M. Muñoz Caro, Mon. Not. R. Astron. Soc., 2018, 473, 2575–2582 CrossRef.
- H. Biehl and F. Stuhl, J. Photochem. Photobiol. A, 1991, 59, 135–142 CrossRef CAS.
- A. Hopkirk, J. Salthouse, R. White, J. Whitehead and F. Winterbottom, Chem. Phys. Lett., 1992, 188, 399–404 CrossRef CAS.
- A. Dawes, N. Pascual, S. V. Hoffmann, N. C. Jones and N. J. Mason, Phys. Chem. Chem. Phys., 2017, 19, 27544–27555 RSC.
- A. Dawes, N. Pascual, N. J. Mason, S. Gärtner, S. V. Hoffmann and N. C. Jones, Phys. Chem. Chem. Phys., 2018, 20, 15273–15287 RSC.
Footnotes |
| † Electronic supplementary information (ESI) available. See DOI: 10.1039/d1ra05600j |
| ‡ Present address: Department of Earth and Environmental Sciences, University of Manchester, Manchester, UK. |
| This journal is © The Royal Society of Chemistry 2021 |

