 Open Access Article
Creative Commons Attribution 3.0 Unported Licence
New insights for titanium(IV) speciation in acidic media based on UV-visible and 31P NMR spectroscopies and molecular modeling†
Lucas Mangold ab,
Hubert Halleuxb,
Sébastien Leclerc
 c,
Aurélien Moncomble
 d,
Gérard Cote
 e and
Alexandre Chagnes
 *a
*a
aUniversité de Lorraine, CNRS, GeoRessources, F-54000, Nancy, France. E-mail: alexandre.chagnes@univ-lorraine.fr
bPrayon, Rue Joseph Wauters 144 à, B-4480, Engis, Belgium
cUniversité de Lorraine, CNRS, LEMTA, F-54000, Nancy, France
dUniv. Lille, CNRS, UMR 8516, LASIRE-Laboratoire Avancé de Spectroscopie pour Les Interactions La Réactivité et L’Environnement, F-59000, Lille, France
ePSL Research University, Chimie ParisTech, CNRS, Institut de Recherche de Chimie-Paris (IRCP), F-75005, Paris, France
First published on 9th August 2021
Abstract
Titanium chemistry in aqueous acidic media has been extensively investigated over the last decades. Hydrolyzed species such as Ti(OH)3+, TiO2+, Ti(OH)22+ or Ti(OH)3+ have been identified and their equilibria have been studied in nitric and perchloric acid. A predominance of the divalent cations was found for low pH (i.e., pH <2). Nonetheless, recent literature reports the existence of small titanium oxo-clusters in aqueous acidic media for large titanium(IV) concentration (typically., >0.1 mol L−1), as stable precursors for the formation of condensed titanium dioxide. The present paper reconsiders firstly previous knowledge about the speciation of titanium(IV) in non-complexing acidic media by giving evidence for the presence of polynuclear hydrolyzed species, even at very low Ti(IV) concentration (i.e., typically <0.1 mmol L−1). UV-visible absorbance spectra recorded for diluted nitric acid solutions (a model of non-complexing acidic medium) containing titanium(IV) were compared to time-dependent density functional theory (TD-DFT) predicted excitation energies. Experimental and predicted maximal absorbance wavelengths showed significantly improved matches when polynuclear species were considered in TD-DFT calculation. Then, 0.1–12.7 mol L−1 phosphoric acid solutions containing titanium(IV) were studied by means of spectroscopic techniques (UV-visible, NMR) in order to identify qualitatively the presence of titanium(IV) complexes and to link this speciation to the acid concentration. Two different titanium(IV) orthophosphate complexes, potentially polynuclear, were detected, and the presence of free titanium(IV) is also expected for low phosphoric acid concentration (i.e., <0.1 mol L−1). A general complexation scheme for a large range of H3PO4 concentration was thus formulated.
1. Introduction
The wet phosphoric process produces different grades of phosphoric acid (known as “wet” phosphoric acid by opposition to H3PO4 produced by pyrometallurgy) and phosphate salts that can be used in the agriculture sector (fertilizers), in food, or in the pharmaceutical or electronic industries. This process is based on the leaching of the phosphate rock with concentrated sulfuric acid and a series of purification steps to reach the purity specification requested by the target application.1–3 The purification steps aim at removing inorganic anions such as fluorides, sulfates, chlorides and metal impurities including cadmium, iron or titanium. For this goal, the most appropriate technology at the industrial scale is solvent extraction.4–10 This technology relies on the use of an extraction solvent, which can efficiently extract phosphoric acid from the leach solution. However, most common solvents exhibit a lack of selectivity against several impurities including titanium(IV).11,12 In order to remove titanium from wet phosphoric acid, it is therefore mandatory to implement additional purification steps.The design of extraction solvents selective of H3PO4 against titanium is challenging. It requires knowing finely the speciation of titanium(IV) in concentrated phosphoric acid and its liquid–liquid extraction equilibria. UV-visible,12–14 Raman14 and NMR spectroscopies,15 liquid–liquid extraction,16 solubility measurements17,18 and potentiometric methods19 were used to investigate the speciation of titanium(IV) in various media such as nitric, perchloric, sulfuric, hydrochloric and phosphoric acids. The divalent titanium(IV) aquocation was generally found to be predominant in perchloric or nitric acid solutions in the absence of any complexing agents.13,16,18 The exact structure of this divalent cation is still debated as it was initially identified as a titanium oxocation (titanyl TiO2+)20 whereas more recent studies suggested an intramolecular rearrangement leading to the formation of titanium(IV) dihydroxide [Ti(OH)2]2+.15,21,22 According to the most recent literature, the hydrolysis equilibria of titanium(IV) in non-complexing acidic media can be written as follows:
| [Ti(OH)4](aq.) + H3O+ ⇌ [Ti(OH)3]+(aq.) + 2H2O (KH,1) | (1a) |
| [Ti(OH)3]+(aq.) + H3O+ ⇌ [Ti(OH)2]2+(aq.) + 2H2O (KH,2) | (1b) |
| [Ti(OH)2]2+(aq.) + H3O+ ⇌ [Ti(OH)]3+(aq.) + 2H2O (KH,3) | (1c) |
The corresponding hydrolysis constants are reported in Table 1.
![[thin space (1/6-em)]](https://www.rsc.org/images/entities/char_2009.gif) K for Ti(IV) hydrolysis reactions at 25 °C (reproduced with permission from Elsevier from Pichavant et al.21). ND = not determined in the original papers
K for Ti(IV) hydrolysis reactions at 25 °C (reproduced with permission from Elsevier from Pichavant et al.21). ND = not determined in the original papers
| Hydrolysis reactions | Liberti16 | Nabivanets23 | Lobanov24 | Nazarenko25 | Ziemniak17 | Schmidt18 | Janaf database26,27 |
|---|---|---|---|---|---|---|---|
| Ti4+(aq.) + H2O ⇌ Ti(OH)3+(aq.) + H+ | ND | 2.79 | −0.16 | 0.097 | ND | ND | 3.75 |
| Ti(OH)3+(aq.) + H2O ⇌ Ti(OH)2+2(aq.) + H+ | −1.8 | 2.35 | −0.59 | −0.31 | ND | ND | 3.26 |
| Ti(OH)2+2(aq.) +H2O ⇌ Ti(OH)+3(aq.) + H+ | −2.4 | −2.1 | −0.92 | −0.64 | −2.28 | −1.85 | −1.71 |
| Ti(OH)+3(aq.) + H2O ⇌ Ti(OH)4(aq.) + H+ | −2.1 | −3.37 | 1.05 | −0.96 | −1.9 | −2.95 | −3.07 |
In the presence of inorganic ligands in solution, titanium(IV) can form various complexes as described in eqn (2) in the particular case of acidic sulfate solutions:
| [Ti(OH)2]2+(aq.) + nHmSOm−24(aq.) ⇌ [Ti(OH)2(HmSO4)n]2−n(2−m)(aq.) | (2) |
 | (3) |
Table 2 evidences significant discrepancies between the formation constants βnHmSO4 in the presence of hydrogen sulfate and sulfate ions.21 More recently,28 investigation of TiOSO4 dissolution in water and in 1.0 mol L−1 HNO3 by X-ray absorption spectroscopy and small angle X-ray spectroscopy showed polycondensation phenomena responsible for the possible presence of [Ti18O27(SO4)9.5]− anions at titanium(IV) concentrations ranging between 0.25 mol L−1 and 1 mol L−1. Likewise, other studies showed the presence of small titanium clusters whose size changed depending on the experimental conditions.29–32 Such polytitanates species with bridging oxo groups were also identified in anhydrous conditions in the case of titanium alkoxide compounds such as titanium ethoxide.33,34 Therefore, it cannot be excluded that polycondensation of titanium(IV) also occurs in phosphoric acid. However, only few studies concern the investigation of the speciation of titanium(IV) in phosphoric acid and the conclusions of these studies are still subject of controversies.19,35,36
![[thin space (1/6-em)]](https://www.rsc.org/images/entities/char_2009.gif) βn) by hydrogen sulfate and sulfate at 25 °C. Two constants are available for Szilágyi et al.37 depending on the nature of the added salt: (a) Na2SO4 (b) (NH4)SO4 (reproduced with permission from Elsevier from Pichavant et al.21). ND = not determined in the original papers
βn) by hydrogen sulfate and sulfate at 25 °C. Two constants are available for Szilágyi et al.37 depending on the nature of the added salt: (a) Na2SO4 (b) (NH4)SO4 (reproduced with permission from Elsevier from Pichavant et al.21). ND = not determined in the original papers
To gain a better knowledge of titanium(IV) chemistry in acidic aqueous media, we have decided to reinvestigate as a starting point the speciation of Ti(IV) in dilute nitric acid solution (i.e., [HNO3] <2 mmol L−1 HNO3) as a model of non-complexing acidic media. For this goal, UV-visible spectroscopy was used and completed with time-dependent density function theory calculations (TD DFT). Then, the speciation of Ti(IV) was investigated at its turn in a large range of concentration of phosphoric acid (i.e., in 0.1–12.7 mol L−1) by 31P NMR spectroscopy and UV-visible spectroscopy coupled with chemometric analyses.
2. Experimental section and DFT calculation
2.1 Materials and methods
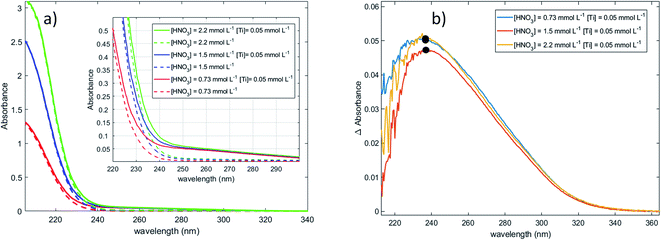
In nitrate media, a good signal-to-noise ratio was obtained providing that the nitrate concentration was lower than 2 mmol L−1 as the nitrate ion exhibits a broad absorption peak at 200 nm with a molar absorption coefficient approximately equal to 105 cm−1 L mol−1. Therefore, the titanium(IV) solutions were diluted and the [Ti]/[NO3] ratio was controlled by adding the requested amount of nitric acid in the solutions. The reference solutions were prepared by using the same protocol. The blank was 0.73 mol L−1 nitric acid, which was filtered by using a 0.2 μm syringe filter with PES membrane prior to UV-vis analyses.
![[thin space (1/6-em)]](https://www.rsc.org/images/entities/char_2009.gif) 164 Hz.
164 Hz.2.2 Computational methods
![[Doublestruck S]](https://www.rsc.org/images/entities/char_e176.gif)
![[Doublestruck S]](https://www.rsc.org/images/entities/char_e176.gif) T. The eigenvalue vector of this covariance matrix gives information about the components associated to independent signals in the UV-visible spectra. The Malinowski factor indicator function IND criterion is calculated by using eqn (4) for different k-values, which correspond to the number of chromophores in solution. The number of chromophores is equal to the value of k corresponding to the minimum value of IND.
T. The eigenvalue vector of this covariance matrix gives information about the components associated to independent signals in the UV-visible spectra. The Malinowski factor indicator function IND criterion is calculated by using eqn (4) for different k-values, which correspond to the number of chromophores in solution. The number of chromophores is equal to the value of k corresponding to the minimum value of IND.
 | (4) |
To better identify the number of chromophores in solution from the spectral data, a common data analysis procedure was used. Numerical noise (jitter) was added to the recorded spectra in order to erase the contribution of the minor components and to distribute more uniformly noise in the considered wavelength range. Although jittering is usually used to reduce overplotting and better identify clusters in large datasets,46 it was found efficient to identify the number of chromophores.
The use of hybrid functionals as well as the implicit solvation model PCM was found to be efficient to obtain reliable estimations of the wavelengths of maximal absorbance for metal complexes,55 molecular systems in complex environments56 as well as polyoxometalates.57 This scheme and the pitfalls of the implemented methods have been well-known for a decade.58 In the current state of the art, the computed excitation energies may thus be considered reasonably reliable as illustrated by our previous works using the same methodology.59–61
The orbital transitions associated with the main predicted excitation energies were described by calculating natural transition orbitals (NTO).62
The structures of the optimized geometries and the representation of the Natural Transition Orbitals (NTOs) were generated using Avogadro63 software and POV-Ray64 as post-treatment (ray-tracer).
3. Results and discussion
3.1 Titanium(IV) speciation in dilute nitric acid (non-complexing media)
Fig. 1a shows the presence of an intense absorption in the UV region.13,14,70 The strong band located between 180 and 220 nm (region 1) can be attributed to nitrate ions,71 and the band which appears in the range 220–350 nm (region 2) on Fig. 1b after baseline correction may correspond to the presence of one or several titanium(IV) complexe(s). In coherence with the above statement, it is interesting that the intensity of the band located in region 1 strongly and almost linearly increases with the concentration of nitric acid whereas it does not depend on the presence or absence of titanium(IV). On the opposite, the intensity of the band located in region 2 (Fig. 1b) is independent on the concentration of nitric acid within the experimental uncertainty, which confirms the absence of nitrato complexes of Ti(IV) in 0.73–2.2 mmol L−1 HNO3 in agreement with Szilágyi et al.44. The noise observed in Fig. 1b for the shortest wavelengths is due to the strong absorbance of nitrate ions around 200 nm.
The large width of the absorbance peak for wavelengths between 230 and 275 nm suggests an asymmetry with respects to the region between 200 and 230 nm. This may result from the presence of several titanium(IV) complexes in solution or the presence of a unique titanium(IV) complex exhibiting several major possible electronic transitions.
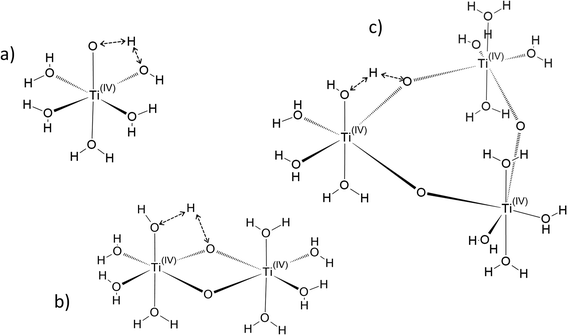
In the following part of the paper, titanium(IV) species are written as [(TiO)μ]2μ with μ = 1 for mononuclear species and μ >1 for polytitanate species as it is not possible to exclude the presence of polynuclear species in solution. For μ >1, as illustrated in Fig. 2, an octahedric structure with bonding oxo groups is suggested. A similar proton exchange equilibrium as TiO2+ ⇌ Ti(OH)22+ for mononuclear species might occur in the case of polynuclear species, leading to the formation of hydroxo bridging groups (see Fig. 2).
Fig. 3 gathers the different configurations reported in the literature of free titanium in acidic medium [(TiO)μ]2μ (geometry optimized by DFT calculations in the present work).13,16,18,22 Both TiO2+ and Ti(OH)22+ cations as well as Ti(OH)3+ and Ti(OH)3+ were considered in order to figure out the predominant species in solution. The starting geometries were thus obtained by placing one to three hydroxyl groups (and oxo group for TiO2+) coordinated to titanium(IV) cation. The rest of the octohedra sites of the complexes were filled with water molecules (solvation shell). The outer solvation shells were described by an implicit model of water molecules (PCM) in accordance with other DFT works, which demonstrated that such kind of models are relevant to describe transition metal complexes in aqueous media.61,72
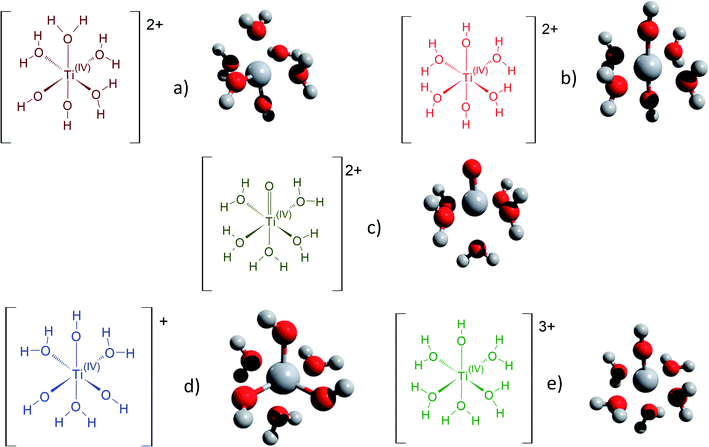 | ||
| Fig. 3 Schematic representation of the first hydratation shell and optimized geometries for (a) [Ti(OH)2]2+(cis) (b) [Ti(OH)2]2+ (trans) (c) [TiO]2+ (d) [Ti(OH)3]+ (e) [Ti(OH)]3+. Cartesian coordinates are available as part of the ESI.† | ||
The structures used in the TD-DFT calculations were local potential energy minima, as the vibration modes were all associated with positive eigenvalues after geometry optimization. The octahedricity was conserved during the optimization even though an important distortion was observed for the Ti(OH)3+ and Ti(OH)22+ cis structures as shown in Table 3. The resulting Ti–(OH2), Ti![[double bond, length as m-dash]](https://www.rsc.org/images/entities/char_e001.gif) (O) and Ti–(OH) bond distances of the final geometrically optimized structures reported in Fig. 3 are gathered in Table 3.
(O) and Ti–(OH) bond distances of the final geometrically optimized structures reported in Fig. 3 are gathered in Table 3.
The excitation energies of the optimized complexes were calculated using TD-DFT (excited states are available in the ESI†). To do so, the scheme described in the Computational Section was used to predict UV-visible spectra as its accuracy generally allows to compute transitions within 0.25 eV, which is sufficient in the case of the qualitative approach of this work.
The oscillator strengths associated with the permitted transitions are shown in Fig. 4. This value represents the probability of a transition, and thus it might be compared to an absorbance measurement for the wavelength corresponding to the transition energy. UV-visible plots were obtained by convolving the transitions with a Gaussian function (assuming a standard deviation of 0.4 eV) to account for the band shape. The excitation energies and associated oscillator strengths, as well as the reconstructed spectra were compared to the experimental spectrum of free titanium reported in the first part of the discussion. For each mononuclear complex considered in these calculations, no agreement was observed between the most relevant transitions and the experimental location of the maximum of absorbance (235 nm). The computed transitions are significantly blue-shifted with respect to the experimental data whatever the structure considered. Therefore, the presence of any of these divalent mononuclear titanium(IV) [Ti(OH)2]2+ in acidic nitrate solutions cannot be supported by this study. In other words, the free titanium(IV) complex in non-complexing acidic solutions (perchloric or nitric acid) may not match with [Ti(OH)2]2+ cation as it was previously stated in the literature.13,15,16,18
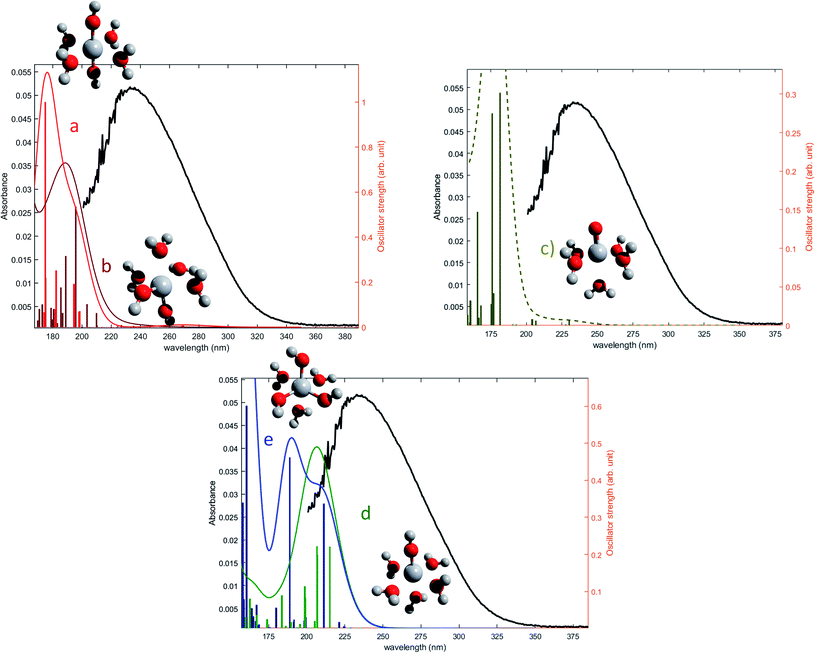 | ||
| Fig. 4 Comparison between predicted excitation energies with their relative associated oscillator strength (absolute values available in ESI†) for (a) [Ti(OH)2]2+(cis) (b) [Ti(OH)2]2+ (trans) (c) [TiO]2+ (d) [Ti(OH)3]+ (e) [Ti(OH)]3 and the spectrum of free titanium (1b). | ||
The formation of polytitanate species is suspected even in acidic solutions. The computational cost of the level of theory chosen to perform the calculation (6-311+G**/PBE0) was a limiting factor to perform the geometry optimization on large oxoclusters. Thus, the excitation energies were obtained only for the dimeric form of titanium aquo-complexes. Different structures containing several hydroxyl groups coordinated to titanium(IV) atoms were considered. Two bridging oxygen atoms were inserted between the titanium atoms and their three different protonation states were chosen for calculations. The spectra of the dimeric structures showed a fair agreement with the experimental spectrum obtained in diluted nitric acid (Fig. 5a). The best agreement between the experimental and calculated UV-visible spectra was obtained for the chemical structure displayed in Fig. 5b. The 3D representation shows that this optimized structure consists of two titanium(IV) atoms bonded via a mixed μ-(OOH) bridge. The first coordination spheres of the two titanium(IV) cations were completed with water molecule as for the monomeric complexes. However, the shape of the band between 230 nm and 340 nm is poorly reproduced. It is worth mentioning that a predicted transition associated with a non-negligible oscillator strength is present at 275 nm as depicted in Fig. 5a. The width of the experimental peak between 250 nm and 300 nm might be explained by the presence of electronic transitions at similar wavelength associated with a higher oscillator strength.
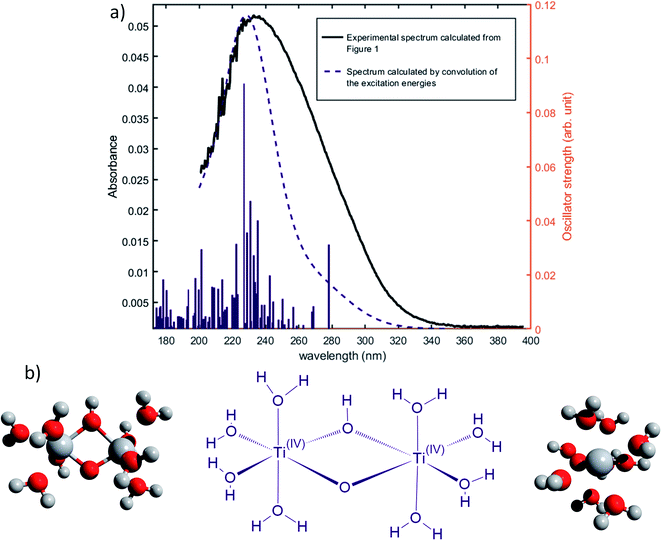 | ||
| Fig. 5 (a) Predicted transitions and their associated oscillator strengths for a dimeric structure [Ti2(μ-(OOH))]5+ compared to the experimental spectrum of free titanium calculated in 1b. The convolution of excitation energies by gaussians (wavenumber standard deviation of 0.4 eV) is plotted with a dotted line. (b) Optimized geometry (upper and lateral view) and schematic representation of a dimeric polytitanate [Ti2(μ-(OOH))]5+. | ||
The main transitions located at 227 nm and 278 nm (the most intense in their respective wavelength domains) were described with the natural transition orbitals (NTO) method (Fig. 6). The identification of the orbitals involved in the main transitions was found to be much easier with the use of the NTOs than with the standard canonical orbitals (see ESI†). The first transition (227 nm, 5.46 eV) was decomposed into two contributions: (i) an electron transfer from the p-orbital corresponding to non-bonding electrons of oxygen atoms from several coordinated water molecules to the dz2-orbital of one of titanium atom, and (ii) an electron transfer from p-orbitals of the two bridging oxygens and of the oxygen atoms of coordinated water molecules to the d-orbitals of titanium atoms. The second excitation (278, 4.48 eV) was described by a similar transition, i.e. p-orbitals of bridging oxygen atoms to d-orbitals of titanium atom. Both these descriptions support the ligand-to-metal charge transfer character of the most intense transitions in the titanium(IV) complex.
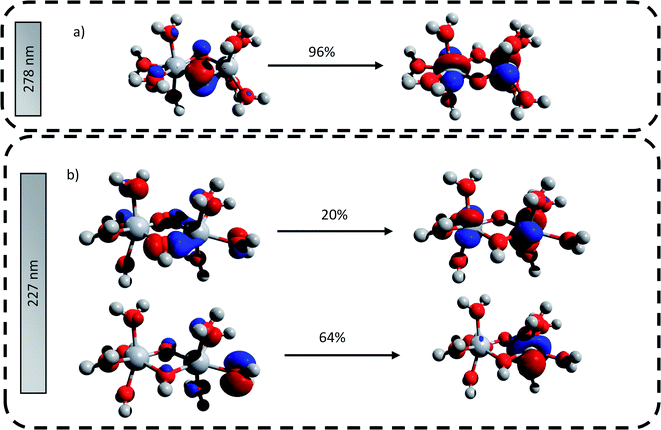 | ||
| Fig. 6 Natural transition orbitals generated for the predicted transitions at (a) 278 nm and (b) 227 nm. The digits represent the contribution in percent of the drawn NTO transitions. | ||
The same type of calculation has been performed for two other titanium(IV) complexes whose chemical structure remains close to the previous one: the first one in which a water molecule in the solvation shell was replaced by an hydroxyl group (Fig. 7a), and the second one corresponding to a trimer structure with bridging oxo groups (Fig. 7b). The main excitation energy predicted for the trimer structure shows also a good agreement with the experimental wavelength. As for the second dimer structure, a difference of about 15 nm was found. In comparison to the results obtained for monomeric structures, this difference between the experimental and the calculated wavelengths remains acceptable. Therefore, TD-DFT cannot be used to conclude about the exact structure of titanium(IV) in nitric acid because of the existence of many structures whose calculated wavelengths match with experimental wavelengths.
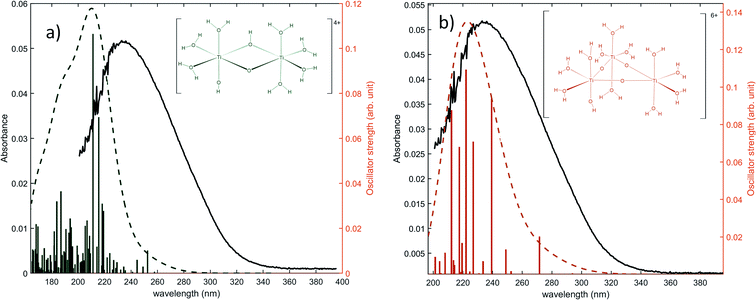 | ||
| Fig. 7 Predicted transitions and their associated oscillator strength for (a) a dimeric structure [Ti2(μ-(OOH)) (OH)]4+ (b) a trimeric structure [Ti3(μ-(O)3)]6+ compared with the experimental spectrum of free titanium from Fig. 1b. The convolution of excitation energies by gaussians (wavenumber standard deviation of 0.4 eV) is plotted with a dotted line. | ||
Nevertheless, this study shows that the predicted position of maximal absorbance shifts toward higher wavelengths when the size of the polyoxometalate complex species increases. This tendency was confirmed for higher nuclearity as depicted in Fig. 8, which shows the normalized convolution of the excitation energies by gaussians for TiO2+ as well as for oxo-bridged polytitanate species with 2, 3 and 18 titanium(IV) atoms. The cartesian coordinates of the optimized geometries of [Ti2(μ-(O)2)]4+ and [Ti3(μ-(O)3)]6+ as well as the procedure used to obtain the excited states for Ti18 are given in the ESI.†
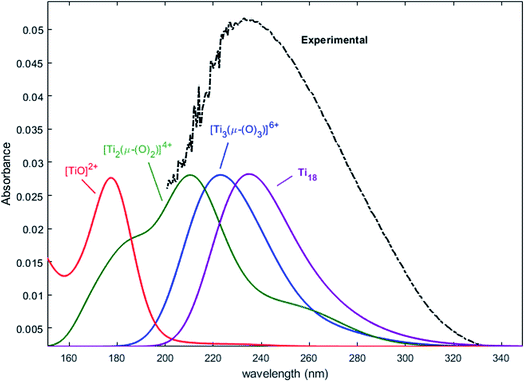 | ||
| Fig. 8 Comparison of the normalized convolution of the excitation energies calculated by TD-DFT for TiO2+, [Ti2(μ-(O)2)]4+, [Ti3(μ-(O)3)]6+ and Ti18 with the experimental UV-vis spectrum of titanium(IV) in nitric acid from Fig. 1b. | ||
The comparison with the experimental spectrum of titanium(IV) in nitric acid reported in Fig. 1b shows that the maximum of absorbance at approximately 230 nm may be linked to the presence of a “small” polytitanate species (dimeric or trimeric complex species). This Figure also shows that the width of the absorbance band in the 230–320 nm region might be due to the presence of other complex species of higher nuclearity such as the oxo-clusters suggested by Kozma et al.28
However, the comparison between the results obtained for the [Ti2(μ-(OOH)) (OH)]4+ and [Ti2(μ-(OOH))]5+ (Fig. 5 and 7) and those obtained for the [Ti2(μ-(OOH))]5+ and [Ti2(μ-(O)2)]4+ (Fig. 5 and 8) suggests that the presence of hydroxyl groups or water molecules coordinated to titanium(IV) and the protonation state of bridging oxo-groups may influence the position of the absorbance band.
3.2 Titanium(IV) speciation in phosphoric acid solutions
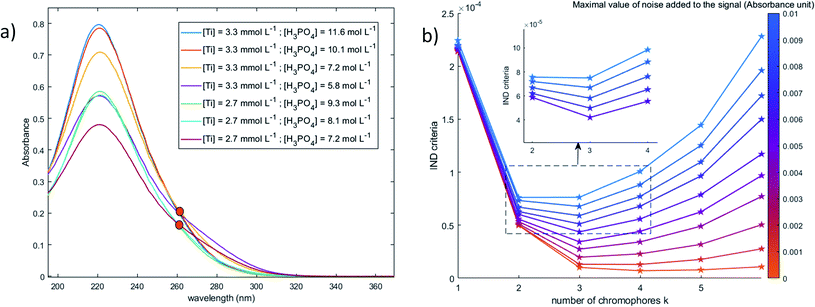
When phosphoric acid is added to non-complexing solutions of titanium(IV), it is expected that the [(TiO)μ]2μ species identified above (with μ = 1 for mononuclear species and μ >1 for polytitanate species) will be converted into titanium-phosphate complexes. The goal of this part is to investigate the formation of such complexes by using 31P NMR spectroscopy and chemometric analyses of UV-visible spectra.The value of the Malinowski indicator function IND for the third chromophore without addition of noise is low in comparison to the value for the first and second species. Thus, even though this third species has to be taken into account to study the speciation of titanium(IV) in phosphoric acid, its contribution in the experimental spectra of Fig. 10 is expected to be negligible. Therefore, this third species will be neglected in the next part of the present paper.
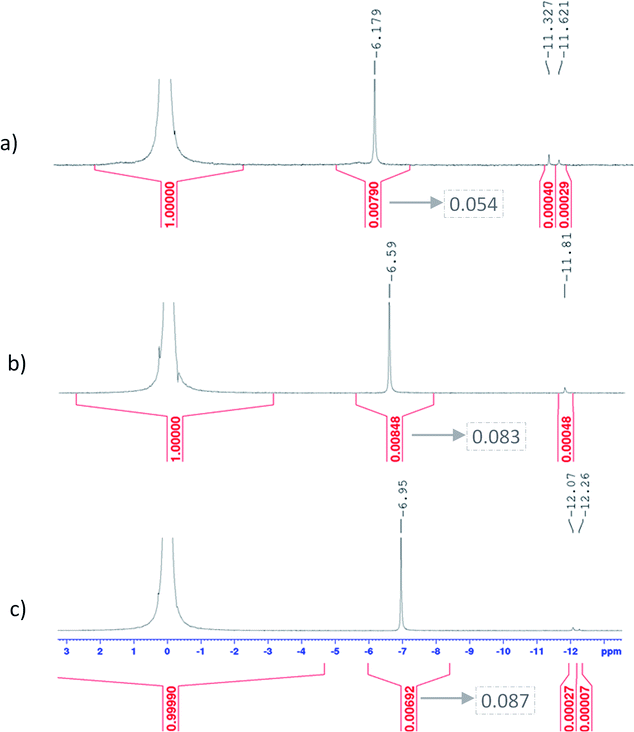
Fig. 11 shows UV-visible spectra of 0.3 mmol L−1 titanium(IV) in 2.0–7.7 mol L−1 H3PO4. These spectra were used to find more accurately the location of the absorbance peaks of the chromophores. The first peak with a maximum located at λm,1 = 220 nm is attributed to the presence of a species quoted Tiλm,1 which might also be at the origin of the 31P NMR peak observed between δ = −6.1 and −6.9 ppm as both the UV-visible absorbance and the ponderate integration values of the 31P NMR signal exhibit a dependence versus the phosphoric acid concentration (Fig. 9).
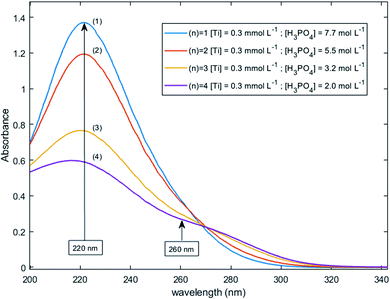 | ||
| Fig. 11 UV-vis spectra of 0.3 mmol L−1 Ti(IV) in 2.0–7.7 mol L−1 phosphoric acid after baseline correction (2 mm light path cuvette). | ||
A second band can be observed as a shoulder between 260 and 280 nm in the spectra of Fig. 11. In the following part of this paper, the Beer–Lambert law has been used to find the exact position of this second peak (i.e., λm,2) attributed to the species Tiλm,2 by considering, as stated above, that the contribution to the total absorbance of third species detected by the Malinowski indicator function IND was negligible.
The Beer–Lambert law was expressed by considering two chromophores and a set of wavelengths comprised between 200 and 340 nm:
![[scr A, script letter A]](https://www.rsc.org/images/entities/char_e520.gif) (n) = εTiλm,1[Tiλm,1](n) + εTiλm,2[Tiλm,2](n) (n) = εTiλm,1[Tiλm,1](n) + εTiλm,2[Tiλm,2](n)
| (5) |
![[scr A, script letter A]](https://www.rsc.org/images/entities/char_e520.gif) (n) corresponds to the vector of the absorbance measured between 200 and 340 nm for a given set of experimental condition (n) (titanium(IV) and phosphoric acid concentrations as reported for (n) = 1 to 4 in Fig. 10). εTiλm,1 and εTiλm,2 denote the vectors of the molar extinction coefficients of the species Tiλm,1 and Tiλm,2 between 200 and 340 nm.
(n) corresponds to the vector of the absorbance measured between 200 and 340 nm for a given set of experimental condition (n) (titanium(IV) and phosphoric acid concentrations as reported for (n) = 1 to 4 in Fig. 10). εTiλm,1 and εTiλm,2 denote the vectors of the molar extinction coefficients of the species Tiλm,1 and Tiλm,2 between 200 and 340 nm.
For the set of experimental condition n = 1 ([Ti(IV)] = 0.3 mmol L−1 and [H3PO4] = 7.7 mol L−1), Fig. 11 shows that the contribution of Tiλm,2 was negligible. Therefore, under these experimental conditions, the contribution of Tiλm,2 in the expression of ![[scr A, script letter A]](https://www.rsc.org/images/entities/char_e520.gif) (1) can be neglected as well. The molar extinction coefficient between 200 and 340 nm for Tiλm,2 can thus be expressed as:
(1) can be neglected as well. The molar extinction coefficient between 200 and 340 nm for Tiλm,2 can thus be expressed as:
 | (6) |
To get information about the peak position Tiλm,2, it is therefore necessary to evaluate the ratio of the concentrations of the first species Tiλm,1 between the two different experimental conditions (n) and (1). This ratio may be expressed in eqn (7b) by using the expression of the Beer–Lambert law at λm,1 = 220 nm [eqn (7a)]:
 | (7a) |
 | (7b) |
The coefficient α corresponds to the contribution of Tiλm,2 in the absorbance at 220 nm under the experimental condition (n).
By combining eqn (7a) and (7b), the following expression of the vector Π, which is proportional to εTiλm,2, can be deduced:
 | (8) |
Fig. 12 shows the variation of Π for the species Tiλm,2 at three hypothetic values of α as a function of the wavelength (experimental condition (n) = 4, i.e. 0.3 mmol L−1 Ti(IV) and 2 mol L−1 H3PO4; this experimental condition was chosen because the spectra recorded under the experimental conditions corresponding to (n) = 1 and (n) = 4 show a significant difference between 260–280 nm).
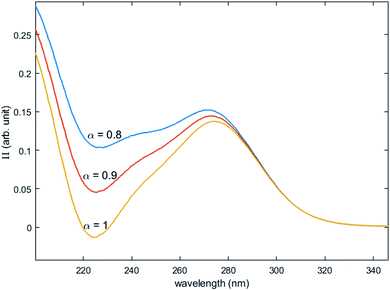 | ||
| Fig. 12 Molar extinction coefficient of Tiλm,2 calculated for α = 0.8, 0.9 and 1 by [eqn (9)]. | ||
A maximum of extinction coefficient is clearly observed at 270 nm and can be attributed to the second titanium(IV) complex Tiλm,2 present in solution. Fig. 11 shows that the concentration of Tiλm,2 decreases when phosphoric acid concentration is increased (see region 270–320 nm for the conditions (1) to (4) in Fig. 11).
Finally, it can be expected that the following reaction takes place in solution when increasing phosphoric acid concentration from 2 to 7 mol L−1:
 | (9) |
The two chromophores Tiλm,1 and Tiλm,2 are still visible in Fig. 13 for phosphoric acid concentration ranging between 0.8 and 1.4 mol L−1. For instance, two bands located at 220 nm and 260 nm can be clearly observed in the spectrum recorded for [H3PO4] = 1.4 mol L−1 (curve (5) in Fig. 13). However, another peak corresponding to another chromophore can be observed at 225 nm when phosphoric concentration was lower than 0.5 mol L−1 (curves (8) and (9) in Fig. 13). The absorbance at this wavelength increases when phosphoric acid concentration is decreased from 0.5 to 0.14 mol L−1. Such an observation suggests that another chromophore, Tiλm,3, exists at low concentration of H3PO4.
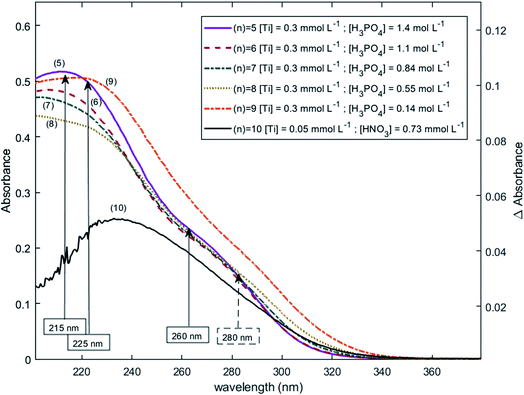 | ||
| Fig. 13 UV-vis spectra of solutions with 0.3 mmol L−1 Ti(IV) and a phosphoric acid concentration of 0.1–1.4 mol L−1 after baseline correction (2 mm light path cuvette). | ||
It is interesting to point out that the peak corresponding to this third chromophore Tiλm,3 in the spectra of titanium(IV) in phosphoric acid and the peak observed in the spectrum of titanium(IV) in diluted nitric acid attributed to free titanium(IV) [Fig. 13, black curve (10)] are located at similar wavelength and exhibit the same shape. The shift in wavelength (225 nm against 240 nm) may be attributed to the presence of the absorbance peak of Tiλm,2. Thus, Tiλm,3 can be identified to free titanium(IV).
The absorbance at 310 nm for 0.3 mmol L−1 Ti(IV) in 1.4 mol L−1 H3PO4 (Fig. 13, curve (5)) was very low because the concentration of Tiλm,2 was low. A decrease of phosphoric acid concentration from 1.1 to 0.1 mol L−1 is responsible for an increase of the absorbance at 310 nm of 0.05 AU, while the absorbance at 260 nm increases of 0.08 AU. The extinction coefficient calculated with eqn (8) shows an absorbance at 260 nm almost 5 times greater than the absorbance at 310 nm (Fig. 13). The presence of a third species is therefore obviously responsible for the increase of absorbance at 310 nm when phosphoric acid concentration decreases. Along with the position of the absorbance peak, this second observation also supports the presence of the free titanium(IV) [(TiO)μ]2μ in solution as Fig. 1b shows also a significant absorbance at this wavelength.
In summary, the variation of the speciation of titanium(IV) from non-complexing aqueous solution to concentrated solution of H3PO4 can be explained by considering the two following titanium orthophosphate complexes in addition to free titanium(IV), Tiλm,3, corresponding to [(TiO)μ]2μ.
| -Tiλm,2 as [(TiO)μ(H3−mPO4)γ]2μ−γm |
| -Tiλm,1 as [(TiO)μ(H3−mPO4)γ(H3−nPO4)β]2μ−γm−βn |
These complexes are formed in phosphoric acid according to the following reactions depending on phosphoric acid concentration:
 | (10) |
 | (11) |
In these equilibria, the size μ of the complex is kept constant for simplification, but it might evolve with the phosphoric acid concentration.
4. Conclusion
The use of UV-visible spectroscopy and molecular modeling techniques was found to be relevant to reinvestigate the speciation of titanium in non-complexing acidic solutions. Indeed, mononuclear species such as titanyl ion or titanium dihydroxide which were considered in previous studies to be predominant in non complexing acidic media were found not to be sufficient to correctly simulate UV-visible spectra by DFT calculations. On the opposite, taking into account the existence of small polytitanate clusters as dimeric or trimeric structures lead to a satisfactory match between experimental and DFT calculated UV-visible spectra. However, in spite of such a good fitting, the determination of the exact nature of the observed polytitanates (i.e., size and hydrolysis state) was not possible due to the multiplicity and similarity of corresponding structures.UV-visible spectroscopy coupled with chemometric analyses and 31P NMR spectroscopy were also successfully used to qualitatively investigate the speciation of titanium(IV) in a large range of phosphoric acid concentrations (i.e., 0.1 to 11.6 mol L−1). Thus, it is concluded that titanium(IV) is present as mononuclear (μ = 1) or polynuclear (μ >1) free cation(s), [(TiO)μ]2μ, in diluted H3PO4 solutions (typically <0.1 mol L−1) and then progressively forms orthophosphate complexes as the concentration of phosphoric acid is increased, namely [(TiO)μ(H3−mPO4)γ]2μ−γm and [(TiO)μ(H3−mPO4)γ(H3−nPO4)β]2μ−γm−βn in moderate (typically >1 mol L−1) and concentrated (typically >6 mol L−1) H3PO4 solutions, respectively.
A further step in the study of the speciation of titanium(IV) in H3PO4 solution might be to perform TD-DFT calculation as the one reported above for diluted HNO3 solutions (non-complexing media). However, due to the large number of possible structures (i.e., stoichiometry or polytitanate size) and necessary long computing time, such calculations were beyond the scope of the present paper.
Author contribution
This work was conceptualized by L. M., A. C., G. C. and H. H. The access to the calculation resources was made possible by A. M. The investigation process was performed by L. M., A. M. and S. L. The original draft of the manuscript was written by L. M., A. C. and G. C. All the authors contributed to edit and review the final version of the manuscript. G. C., H. H. and A. C. were involved in the funding acquisition and supervision of the project.Conflicts of interest
There are no conflicts to declare.Acknowledgements
M. Lucas Mangold acknowledges CIFRE program (ANRT) for financial support. The authors acknowledge the Plateforme de RMN de l’Institut Jean Barriol, Université de Lorraine for the NMR analysis. This work was granted access to the HPC resources of CINES (Centre Informatique National de l’Enseignement Superieur) and IDRIS (Institut du Developpement et des Ressources en Informatique Scientifique) under the allocations A0070806933 and A0090806933 made by GENCI (Grand Equipement National de Calcul Intensif).References
- Council of Europe, European Pharmacopoeia, 10th edn, Council of Europe, Strasbourg, 2019, p. 3553 Search PubMed.
- U.S. Pharmacopeial Convention, Food Chemicals Codex (FCC), 11th edn, Rockville, MD, 2019, p. 927 Search PubMed.
- FAO-JEFCA Phosphoric acid monograph, http://www.fao.org/fileadmin/user_upload/jecfa_additives/docs/Monograph1/Additive-312.pdf, (accessed 2021) Search PubMed.
- M. C. Assuncao, G. Cote, M. Andre, H. Halleux and A. Chagnes, RSC Adv., 2017, 7, 6922–6930 RSC.
- I. M. Ahmed, R. N. Ammanoeil, E. A. Saad and J. A. Daoud, Period. Polytech., Chem. Eng., 2019, 63, 122–129 CrossRef CAS.
- F. Ruiz, A. Marcilla, A. M. Ancheta and J. A. Caro, Solvent Extr. Ion Exch., 1985, 3, 331–343 CrossRef CAS.
- T. A. Williams, US Pat., US4127640A, 1978 Search PubMed.
- A. Hannachi, D. Habaili, C. Chtara and A. Ratel, Sep. Purif. Technol., 2007, 55, 212–216 CrossRef CAS.
- R. Hamdi and A. Hannachi, J. Chem. Eng. Process Technol., 2012, 3(2) DOI:10.4172/2157-7048.1000134.
- M. Alibrahim, Period. Polytech., Chem. Eng., 2007, 51, 39–42 CrossRef CAS.
- U. Kölle and P. Kölle, Angew. Chem., Int. Ed., 2003, 42, 4540–4542 CrossRef PubMed.
- I. Cservenyák, G. H. Kelsall and W. Wang, Electrochim. Acta, 1996, 41, 563–572 CrossRef.
- T. Sugimoto, X. Zhou and A. Muramatsu, J. Colloid Interface Sci., 2002, 252, 339–346 CrossRef CAS PubMed.
- I. Szilágyi, E. Königsberger and P. M. May, Dalton Trans., 2009, 7717–7724 RSC.
- P. Comba and A. Merbach, Inorg. Chem., 1987, 26, 1315–1323 CrossRef CAS.
- A. Liberti, V. Chiantella and F. Corigliano, J. Inorg. Nucl. Chem., 1963, 25, 415–427 CrossRef CAS.
- S. E. Ziemniak, M. E. Jones and K. E. S. Combs, J. Solution Chem., 1993, 22, 601–623 CrossRef CAS.
- J. Schmidt and W. Vogelsberger, J. Solution Chem., 2009, 38, 1267–1282 CrossRef CAS.
- V. I. Ivanenko, I. A. Udalova, E. P. Lokshin and V. I. Kravtsov, Russ. J. Electrochem., 2001, 37, 530–535 CrossRef CAS.
- M. Pourbaix, Atlas of electrochemical equilibria in aqueous solutions, National Association of Corrosion Engineers, Houston, Texas, 1974 Search PubMed.
- A. Pichavant, E. Provost, W. Fürst and J.-F. Hochepied, J. Chem. Thermodyn., 2019, 131, 184–191 CrossRef CAS.
- J.-P. Jolivet and M. Henry, De la solution à l’oxyde - Condensation des cations en solution aqueuse. Chimie de surface des oxyde, EDP Sciences, Paris, 2012 Search PubMed.
- B. I. Nabivanets and V. V. Lukachina, Ukr. Khim. Zh., 1964, 30, 1123 CAS.
- F. I. Lobanov, V. M. Savostina, I. V. Serzhenko and V. M. Peshkova, Russ. J. Inorg. Chem., 1969, 14, 562 Search PubMed.
- V. A. Nazarenko, V. P. Antonovich and E. M. Nevskaya, Russ. J. Inorg. Chem., 1971, 16, 530–533 Search PubMed.
- M. W. Chase, J. L. Curnutt, H. Prophet, R. A. McDonald and A. N. Syverud, J. Phys. Chem. Ref. Data, 1975, 4, 1–176 CrossRef CAS.
- A. Testino, I. R. Bellobono, V. Buscaglia, C. Canevali, M. D'Arienzo, S. Polizzi, R. Scotti and F. Morazzoni, J. Am. Chem. Soc., 2007, 129, 3564–3575 CrossRef CAS PubMed.
- K. Kozma, M. Wang, P. I. Molina, N. P. Martin, Z. Feng and M. Nyman, Dalton Trans., 2019, 48, 11086–11093 RSC.
- G. Zhang, J. Hou, C.-H. Tung and Y. Wang, Inorg. Chem., 2016, 55, 3212–3214 CrossRef CAS.
- G. Zhang, C. Liu, D.-L. Long, L. Cronin, C.-H. Tung and Y. Wang, J. Am. Chem. Soc., 2016, 138, 11097–11100 CrossRef CAS.
- K. Manseki, K. Saka, M. Matsui, S. Vafaei and T. Sugiura, CrystEngComm, 2017, 19, 5844–5848 RSC.
- H. Einaga, J. Chem. Soc., Dalton Trans., 1979, 1917–1919 RSC.
- F. Babonneau, S. Doeuff, A. Leaustic, C. Sanchez, C. Cartier and M. Verdaguer, Inorg. Chem., 1988, 27, 3166–3172 CrossRef CAS.
- M. Czakler, C. Artner and U. Schubert, New J. Chem., 2018, 42, 12098–12103 RSC.
- S. E. Ziemniak and E. P. Opalka, Chem. Mater., 1993, 5, 690–694 CrossRef CAS.
- Y. Komatsu and H. Einaga, J. Inorg. Nucl. Chem., 1981, 43, 2449–2454 CrossRef.
- I. Szilágyi, E. Königsberger and P. M. May, Inorg. Chem., 2009, 48, 2200–2204 CrossRef.
- B. I. Nabivanets, Russ. J. Inorg. Chem., 1969, 7, 352 Search PubMed.
- A. K. Babko, E. A. Mazurenko and B. I. Nabivanets, Russ. J. Inorg. Chem., 1969, 14, 1091 Search PubMed.
- F. Baillon, E. Provost and W. Fürst, J. Mol. Liq., 2008, 143, 8–12 CrossRef CAS.
- F. A. Deorsola and D. Vallauri, J. Mater. Sci., 2008, 43, 3274–3278 CrossRef CAS.
- E. R. Malinowski, Anal. Chem., 1977, 49, 612–617 CrossRef CAS.
- S. Pack, J. Chemom., 1991, 5, 545 CrossRef.
- P. W. Yendle and H. J. H. MacFie, J. Chemom., 1989, 3, 589–600 CrossRef CAS.
- M. Meloun, J. Čapek, P. Mikšík and R. G. Brereton, Anal. Chim. Acta, 2000, 423, 51–68 CrossRef CAS.
- J. M. Chambers, W. S. Cleveland, B. Kleiner and P. A. Tukey, Graphical Methods for Data Analysis, Chapman and Hall/CRC, 2018 Search PubMed.
- M. J. Frisch, G. W. Trucks, H. B. Schlegel, G. E. Scuseria, M. A. Robb, J. R. Cheeseman, G. Scalmani, V. Barone, G. A. Petersson, H. Nakatsuji, X. Li, M. Caricato, A. V. Marenich, J. Bloino, B. G. Janesko, R. Gomperts, B. Mennucci, H. P. Hratchian, J. V. Ortiz, A. F. Izmaylov, J. L. Sonnenberg, D. Williams-Young, F. Ding, F. Lipparini, F. Egidi, J. Goings, B. Peng, A. Petrone, T. Henderson, D. Ranasinghe, V. G. Zakrzewski, J. Gao, N. Rega, G. Zheng, W. Liang, M. Hada, M. Ehara, K. Toyota, R. Fukuda, J. Hasegawa, M. Ishida, T. Nakajima, Y. Honda, O. Kitao, H. Nakai, T. Vreven, K. Throssell, J. A. Montgomery Jr, J. E. Peralta, F. Ogliaro, M. J. Bearpark, J. J. Heyd, E. N. Brothers, K. N. Kudin, V. N. Staroverov, T. A. Keith, R. Kobayashi, J. Normand, K. Raghavachari, A. P. Rendell, J. C. Burant, S. S. Iyengar, J. Tomasi, M. Cossi, J. M. Millam, M. Klene, C. Adamo, R. Cammi, J. W. Ochterski, R. L. Martin, K. Morokuma, O. Farkas, J. B. Foresman and D. J. Fox, Gaussian 16 Revision C.01, 2016 Search PubMed.
- J. P. Perdew, K. Burke and M. Ernzerhof, Phys. Rev. Lett., 1996, 77, 3865–3868 CrossRef CAS.
- C. Adamo and V. Barone, J. Chem. Phys., 1999, 110, 6158–6170 CrossRef CAS.
- R. Krishnan, J. S. Binkley, R. Seeger and J. A. Pople, J. Chem. Phys., 1980, 72, 650–654 CrossRef CAS.
- A. D. McLean and G. S. Chandler, J. Chem. Phys., 1980, 72, 5639–5648 CrossRef CAS.
- P. C. Hariharan and J. A. Pople, Theor. Chim. Acta, 1973, 28, 213–222 CrossRef CAS.
- M. Cossi, G. Scalmani, N. Rega and V. Barone, J. Chem. Phys., 2002, 117, 43–54 CrossRef CAS.
- J. Tomasi, B. Mennucci and R. Cammi, Chem. Rev., 2005, 105, 2999–3094 CrossRef CAS PubMed.
- C. Latouche, D. Skouteris, F. Palazzetti and V. Barone, J. Chem. Theory Comput., 2015, 11, 3281–3289 CrossRef CAS.
- D. Jacquemin, B. Mennucci and C. Adamo, Phys. Chem. Chem. Phys., 2011, 13, 16987–16998 RSC.
- D. Ravelli, D. Dondi, M. Fagnoni, A. Albini and A. Bagno, J. Comput. Chem., 2011, 32, 2983–2987 CrossRef CAS PubMed.
- C. Adamo and D. Jacquemin, Chem. Soc. Rev., 2013, 42, 845–856 RSC.
- G. J.-P. Deblonde, A. Moncomble, G. Cote, S. Bélair and A. Chagnes, RSC Adv., 2014, 5, 7619–7627 RSC.
- D. J. Thaviligadu, L. Labarrière, A. Moncomble and J.-P. Cornard, Spectrochim. Acta, Part A, 2020, 225, 117492 CrossRef CAS.
- L. Labarrière, A. Moncomble and J.-P. Cornard, RSC Adv., 2020, 10, 35017–35030 RSC.
- R. L. Martin, J. Chem. Phys., 2003, 118, 4775–4777 CrossRef CAS.
- M. D. Hanwell, D. E. Curtis, D. C. Lonie, T. Vandermeersch, E. Zurek and G. R. Hutchison, J. Cheminf., 2012, 4(17) DOI:10.1186/1758-2946-4-17.
- POV-Team, The persistence of vision raytracer Pty. Ltd. POV-Ray 3.7, 2013 Search PubMed.
- P. D. Bernardo, P. Zanonato, L. Rao, A. Bismondo and F. Endrizzi, Dalton Trans., 2011, 40, 9101–9105 RSC.
- L. Rao and G. Tian, Inorg. Chem., 2009, 48, 964–970 CrossRef CAS PubMed.
- D. F. C. Morris, J. D. MacCarthy and R. J. Newton, Electrochim. Acta, 1978, 23, 1383–1386 CrossRef CAS.
- L. Rao and G. Tian, J. Chem. Thermodyn., 2008, 40, 1001–1006 CrossRef CAS.
- S. E. Rizk, M. I. Aly and J. A. Daoud, Sep. Sci. Technol., 2017, 52, 1206–1215 CrossRef CAS.
- K. Takamura and T. Matsumoto, Dalton Trans., 2020, 49, 690–696 RSC.
- B. G. Ershov and N. M. Panich, Spectrochim. Acta, Part A, 2018, 188, 179–182 CrossRef CAS.
- S. Boumendil, J.-P. Cornard, M. Sekkal-Rahal and A. Moncomble, Chem. Phys. Lett., 2015, 636, 39–45 CrossRef CAS.
- M. V. Maslova, D. Rusanova, V. Naydenov, O. N. Antzutkin and L. G. Gerasimova, J. Non-Cryst. Solids, 2012, 358, 2943–2950 CrossRef CAS.
- M. Trublet, M. V. Maslova, D. Rusanova and O. N. Antzutkin, Mater. Chem. Phys., 2016, 183, 467–475 CrossRef CAS.
- W. Zhang, R. Koivula, E. Wiikinkoski, J. Xu, S. Hietala, J. Lehto and R. Harjula, ACS Sustainable Chem. Eng., 2017, 5, 3103–3114 CrossRef CAS.
- P. Bhanja, S. Chatterjee, A. K. Patra and A. Bhaumik, J. Colloid Interface Sci., 2018, 511, 92–100 CrossRef CAS.
Footnote |
| † Electronic supplementary information (ESI) available. See DOI: 10.1039/d1ra04284j |
| This journal is © The Royal Society of Chemistry 2021 |

