 Open Access Article
Anhydrous proton conductivity of electrospun phosphoric acid-doped PVP-PVDF nanofibers and composite membranes containing MOF fillers†
Lian Sun ,
Quanchao Gu,
Honglei Wang,
Jinshan Yu and
Xingui Zhou*
Science and Technology on Advanced Ceramic Fibers and Composites Laboratory, College of Aerospace Science and Engineering, National University of Defense Technology, Changsha 410073, China. E-mail: zhouxinguilmy@163.com
First published on 2nd September 2021
Abstract
A high-temperature proton exchange membrane was fabricated based on polyvinylidene fluoride (PVDF) and polyvinylpyrrolidone (PVP) blend polymer nanofibers. Using electrospinning method, abundant small ionic clusters can be formed and agglomerated on membrane surface, which would facilitate the proton conductivity. To further enhance the conductivity, phosphoric acid (PA) retention as well as mechanical strength, sulfamic acid (SA)-doped metal–organic framework MIL-101 was incorporated into PVP-PVDF blend nanofiber membranes. As a result, the anhydrous proton conductivity of the composite SA/MIL101@PVP-PVDF membrane reached 0.237 S cm−1 at 160 °C at a moderate acid doping level (ADL) of 12.7. The construction of long-range conducting network by electrospinning method combined with hot-pressing and the synergistic effect between PVP-PVDF, SA/MIL-101 and PA all contribute to the proton conducting behaviors of this composite membrane.
1. Introduction
Proton exchange membranes (PEMs), which are key components for proton exchange membrane fuel cells (PEMFCs), need to effectively transport protons and block fuels from oxygen. High-temperature PEMFCs (HT-PEMFCs) working under 100–200 °C (especially around 160 °C)1 have triggered interest from researchers due to their high efficiency and tolerance with CO. Importantly, PEMs for HT-PEMFCs must possess excellent stability above 100 °C as well as good proton conductivity under anhydrous condition, both of which conventional PEMs cannot reach (such as Nafion).2,3 Alternatives for Nafion have been investigated comprehensively in recent decade, including polyimides (PIs),4 polybenzimidazole (PBI)5 and sulfonated polyetheretherketone (SPEEK).6 One of the widely-used approaches to enhance high temperature proton conducting properties for PEMs is to impregnate non or low-volatile proton donors (e.g. inorganic fillers, ionic liquids and heteropoly acid) into polymer matrix to obtain composite membrane structure.3,7–9 At high temperature and low humidity, these components can retain water molecules or directly provide proton themselves to keep proton conductivity for PEMs. Meanwhile, other key factors for PEMs (e.g. mechanical strength) are also usually enhanced via adding proton conducting fillers, which is originated from the synergistic effect between fillers and matrix. A novel phosphoric acid (PA)-contained inorganic–organic crosslinked PEMs were fabricated by Yue et al.10 using γ-(2,3-epoxypropoxy) propyltrimethoxysilane (KH560) as crosslinker. KH560 also plays important role as anchoring PA molecules so that the high-temperature proton conductivity (90 °C) of this membrane was almost two orders higher than commercial products. Vinothkannan et al.11 loaded Fe3O4 nanoparticles on sulfonated graphene oxide (SGO), and this nanocomposite successfully makes the mechanical and thermal strength of Nafion 3.16 times and 31.6 times higher than its pristine structure, respectively. Recently, metal–organic framework (MOFs)-based proton conductors have triggered much attention since their large porosity and excellent designability. Up to date, over hundreds of MOFs proton conductors have been synthesized and some of them have shown potential on high-temperature applications.12–14Electrospinning is a facile and direct method to obtain uniform membrane structure consisting of one-dimensional nanofibers. As for PEM applications, the electrostatic force applied during spinning process is favorable to the formation of abundant dense ionic clusters within nanoscale along nanofibers, making it possible to construct ordered one-dimensional channels for proton conducting in a long range through PEMs.15 Particularly, high surface area of nanofibers provide large number of active sites for doping proton donors, which not only optimize their dispersion status but also increase their loading amount. Currently, a series of electrospinning proton-conductive polymers directly used as PEM or PEM reinforcement have been reported.16–18 However, few reports have been achieved the one-step preparation of mixed matrix membranes (MMMs) used as PEMs.
Herein, we have constructed electrospun proton exchange membranes based on two different polymers – polyvinylidene fluoride (PVDF) polyvinylpyrrolidone (PVP). PVDF (Scheme 1a) is a widely-used polymer with high strength and thermal stability. However, the application of PVDF as PEMs is strictly limited because of the lack of active functional groups. On the other hand, PVP (Scheme 1b) contains abundant proton acceptor sites consisting of N-heterocycle, but its soluble characteristic in water makes it difficult to be directly used as PEMs. Guo et al. have proved that PVP-PVDF blend polymers have the potential on high-temperature PEMs under anhydrous condition.19 In this work, such PVP-PVDF blend polymers were successfully fabricated as one-dimensional nanofiber structure and connected each other, which provides abundant long-range proton conducting channels inside membranes. Meanwhile, sulfamic acid MIL-101 (SA/MIL-101) was selected as filler to enhance the conductivity of PVP-PVDF membranes under high temperature. SA plays as a strong proton donor (Scheme 1c) with high melting point (over 200 °C) and good affinity to phosphoric acid (PA), which is favorable for anhydrous proton conducting. In order to embed MIL-101 into small-diameter nanofiber, benzoic acid was used as modulator instead of conventional hydrofluoric acid (HF) and the hydrothermal reaction time was reduced so that the average diameter of MIL-101 was controlled. By this way, the overall properties of HT-PEMs can be enhanced simply.
2. Experimental section
2.1 Reagents
PVDF (Mw ∼ 534![[thin space (1/6-em)]](https://www.rsc.org/images/entities/char_2009.gif) 000) and PVP (Mw ∼ 360
000) and PVP (Mw ∼ 360![[thin space (1/6-em)]](https://www.rsc.org/images/entities/char_2009.gif) 000) were provided by Sigma-Aldrich (Missouri, US). N,N-dimethylacetamide (DMAc) and acetone were purchased from Sinopharm Chemical Reagent Co., Ltd (Shanghai, China). Chromium(III) nitrate (Cr(NO3)3·9H2O), terephthalamic acid (H2BDC), benzoic acid and phosphoric acid (PA) were obtained from Aladdin Reagent Co. Ltd (Shanghai China). All the chemical reagents were used as received.
000) were provided by Sigma-Aldrich (Missouri, US). N,N-dimethylacetamide (DMAc) and acetone were purchased from Sinopharm Chemical Reagent Co., Ltd (Shanghai, China). Chromium(III) nitrate (Cr(NO3)3·9H2O), terephthalamic acid (H2BDC), benzoic acid and phosphoric acid (PA) were obtained from Aladdin Reagent Co. Ltd (Shanghai China). All the chemical reagents were used as received.
2.2 Synthesis of SA/MIL-101
MIL-101 was prepared as the following procedure similar with Jiang and co-workers:20 Cr(NO3)3·9H2O (0.33 mmol), H2BDC (0.33 mmol) and benzoic acid (0.11 mmol) were mixed with 10 ml deionized water and stirred for 30 min. Then the suspension was sealed into Teflon-lined stainless-steel autoclave and heated under autogenous pressure at 180 °C for 3 h. The raw product was centrifugated, washed three times with DMF and deionized water for several times and dried at room temperature. The load of sulfamic acid inside MIL-101 was conducted following El-Hakam's method with some modification.21 Specifically, 1 g of the above MIL-101 was dispersed into deionized water and 55 wt% of sulfamic acid was subsequently added. The mixture was stirred overnight, filtered, washed and dried at 60 °C for 12 h.2.3 Membrane preparation
In a typical electrospinning process, polymer solution for process was obtained by dissolving 15 wt% PVDF and PVP as different mass ratio (10![[thin space (1/6-em)]](https://www.rsc.org/images/entities/char_2009.gif) :
:![[thin space (1/6-em)]](https://www.rsc.org/images/entities/char_2009.gif) 0, 8
0, 8![[thin space (1/6-em)]](https://www.rsc.org/images/entities/char_2009.gif) :
:![[thin space (1/6-em)]](https://www.rsc.org/images/entities/char_2009.gif) 2, 6
2, 6![[thin space (1/6-em)]](https://www.rsc.org/images/entities/char_2009.gif) :
:![[thin space (1/6-em)]](https://www.rsc.org/images/entities/char_2009.gif) 4, 4
4, 4![[thin space (1/6-em)]](https://www.rsc.org/images/entities/char_2009.gif) :
:![[thin space (1/6-em)]](https://www.rsc.org/images/entities/char_2009.gif) 6, 2
6, 2![[thin space (1/6-em)]](https://www.rsc.org/images/entities/char_2009.gif) :
:![[thin space (1/6-em)]](https://www.rsc.org/images/entities/char_2009.gif) 8 and 0
8 and 0![[thin space (1/6-em)]](https://www.rsc.org/images/entities/char_2009.gif) :
:![[thin space (1/6-em)]](https://www.rsc.org/images/entities/char_2009.gif) 10, respectively) into DMAc:acetone mixed solvent (the mass ratio was 7
10, respectively) into DMAc:acetone mixed solvent (the mass ratio was 7![[thin space (1/6-em)]](https://www.rsc.org/images/entities/char_2009.gif) :
:![[thin space (1/6-em)]](https://www.rsc.org/images/entities/char_2009.gif) 3). The solution was stirred at room temperature for 12 h and then transferred into a 10 ml syringe on a professional electrospinning equipment (Qingzi Nano E02, Guangdong, China). The applied voltage was set as 20 kV and the constant feeding rate was adjusted as 1.0 ml h−1. In order to obtain well-structured nanofiber membranes, the ambient humidty was controlled into 30–35 RH%. After the electrospinning process, the membranes were employed hot press under 100 °C for 10 min. The products were denoted as PVDF, 20PVP, 40PVP, 60PVP, 80PVP and PVP (100%) according to the mass ratio of PVP in the electrospinning solution. The preparation of SA/MIL-101@PVP-PVDF was the same as the above route (the mass ratio of PVDF and PVP was 4
3). The solution was stirred at room temperature for 12 h and then transferred into a 10 ml syringe on a professional electrospinning equipment (Qingzi Nano E02, Guangdong, China). The applied voltage was set as 20 kV and the constant feeding rate was adjusted as 1.0 ml h−1. In order to obtain well-structured nanofiber membranes, the ambient humidty was controlled into 30–35 RH%. After the electrospinning process, the membranes were employed hot press under 100 °C for 10 min. The products were denoted as PVDF, 20PVP, 40PVP, 60PVP, 80PVP and PVP (100%) according to the mass ratio of PVP in the electrospinning solution. The preparation of SA/MIL-101@PVP-PVDF was the same as the above route (the mass ratio of PVDF and PVP was 4![[thin space (1/6-em)]](https://www.rsc.org/images/entities/char_2009.gif) :
:![[thin space (1/6-em)]](https://www.rsc.org/images/entities/char_2009.gif) 6) with the addition of 10 wt% SA/MIL-101 to the solution.
6) with the addition of 10 wt% SA/MIL-101 to the solution.
2.4 Characterization of the membranes
The morphology of samples was observed on Hitachi S-4800 field-emission scanning electron microscope (FE-SEM, Japan) with an acceleration voltage of 10.0 kV and transmission electron microscope (TEM, JEM-2100, JEOL, Japan). The fine molecular structure of membranes was investigated by Fourier Transform Infrared Spectroscopy (FT-IR, Frontier, PerkinElmer, USA), X-ray diffraction (XRD, Bruker D8 Advance powder, USA, Cu-Kα λ = 1.5406 Å, working at 40 kV and 40 mA) and small-angle X-ray scattering (SAXS, SAXSess mc2, Anton Paar, Austria). Thermo-gravimetric analysis (TGA) data were recorded on Netzsch Model STA 449F3 (Germany) under N2 gas flow with a heating rate of 10 °C min−1. Differential scanning calorimetry (DSC) measurements were taken using TA Q2000 (TA measurements) at a heating rate of 10 °C min−1 between 40 ∼ 200 °C. Water contact angle (WCA) measurement was conducted on SL200B Solon professional contact angle meter (China). A droplet of 5 μl deionized water was used for test and three different locations were chosen on each sample and kept for 10 s to ensure a completely wetted state. The obtained membranes were immersed into an 85% phosphoric acid solution for 24 h and wiped with filter paper. The detailed value of acid doping level (ADL), area swelling and volume swelling was calculated as:
 | (1) |
 | (2) |
 | (3) |
2.5 Proton conductivity
The proton conductivity (σ) of the membranes was measured using four-probe electrochemical impedance spectroscopy (EIS) via a PARSTAT 4000 Advanced Electrochemical System (Princeston Applied Research, USA) under different temperature in galvanostatic mode. The current was conducted for 10 mA in a frequency range from 1 MHz to 10 Hz. The value of σ was calculated as follows:
 | (4) |
3. Results and discussion
3.1 Characterization of PVP-PVDF blend nanofiber membranes
Fig. 1 shows the SEM images of different PVP-PVDF blend nanofibers. It can be seen in Fig. 1-a1 that large number of beads were formed on 20PVP-PVDF NFMs. When the mass ratio of PVP:PVDF were 4![[thin space (1/6-em)]](https://www.rsc.org/images/entities/char_2009.gif) :
:![[thin space (1/6-em)]](https://www.rsc.org/images/entities/char_2009.gif) 6 and above, smooth and aligned nanofibers could be obtained (Fig. 1b–d). According to the statistical analysis, the average diameter of PVP-PVDF NFMs increases from ∼350 nm to ∼1050 nm when the amount of PVP rises. As a comparison, the average diameter of pristine PVDF and PVP is ∼192 and ∼1391 nm, respectively (Fig. S1†). With the addition of PVP, both the viscosity and conductivity of PVP-PVDF mixed solution increase, as shown in Table S1 and Fig. S2,† which facilitate the whole electrospinning process and the formation of uniform PVP-PVDF blend nanofibers. For the usage of PEMs, the raw electrospun PVP-PVDF membranes were hot-pressed to connect single fibers as well as improve its mechanical strength. Fig. S3,† illustrates the SEM image of 60PVP (derived from Fig. 1c) after hot pressing. It can be seen that the hot-pressed nanofiber membranes kept a well fiber morphology without apparent pores, which is beneficial for PEM application.
6 and above, smooth and aligned nanofibers could be obtained (Fig. 1b–d). According to the statistical analysis, the average diameter of PVP-PVDF NFMs increases from ∼350 nm to ∼1050 nm when the amount of PVP rises. As a comparison, the average diameter of pristine PVDF and PVP is ∼192 and ∼1391 nm, respectively (Fig. S1†). With the addition of PVP, both the viscosity and conductivity of PVP-PVDF mixed solution increase, as shown in Table S1 and Fig. S2,† which facilitate the whole electrospinning process and the formation of uniform PVP-PVDF blend nanofibers. For the usage of PEMs, the raw electrospun PVP-PVDF membranes were hot-pressed to connect single fibers as well as improve its mechanical strength. Fig. S3,† illustrates the SEM image of 60PVP (derived from Fig. 1c) after hot pressing. It can be seen that the hot-pressed nanofiber membranes kept a well fiber morphology without apparent pores, which is beneficial for PEM application.
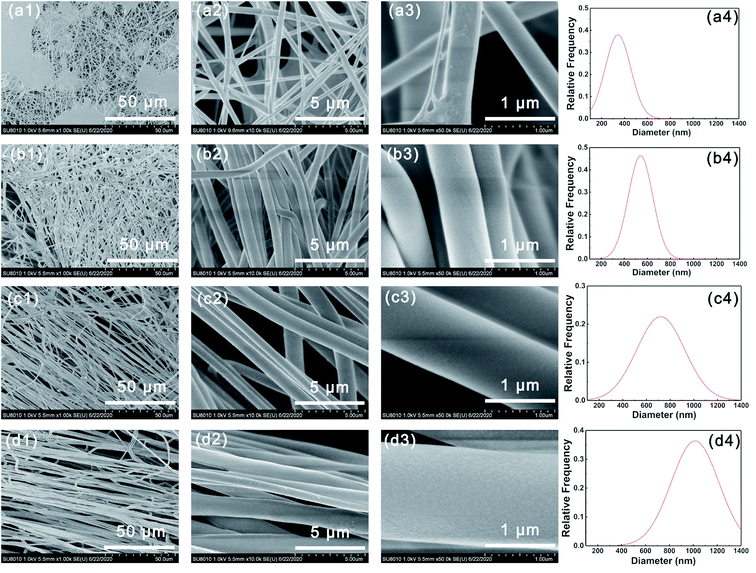 | ||
| Fig. 1 SEM images of (a1–a3) 20PVP, (b1–b3) 40PVP, (c1–c3) 60PVP and (d1–d3) 80PVP. Diameter distribution of (a4) 20PVP, (b4) 40PVP, (c4) 60PVP and (d4) 80PVP. | ||
Fig. 2a illustrates the FT-IR spectra of different PVP-PVDF blends. All of the four blend membranes show typical peaks located at ∼1667 and ∼3000 cm−1, originating from the methylene group (–CH2–) and carbonyl group (–C![[double bond, length as m-dash]](https://www.rsc.org/images/entities/char_e001.gif) O–) in PVDF and PVP, respectively. It can be observed that with the increase of PVP content, the signal of –CH2– experienced a red shift, while a blue shift occurred on –C
O–) in PVDF and PVP, respectively. It can be observed that with the increase of PVP content, the signal of –CH2– experienced a red shift, while a blue shift occurred on –C![[double bond, length as m-dash]](https://www.rsc.org/images/entities/char_e001.gif) O– in this process. This shift can be explained by the effect of hydrogen bonds from PVP to PVDF. Typically, –CH2– in PVDF may decrease the vibration strength of C
O– in this process. This shift can be explained by the effect of hydrogen bonds from PVP to PVDF. Typically, –CH2– in PVDF may decrease the vibration strength of C![[double bond, length as m-dash]](https://www.rsc.org/images/entities/char_e001.gif) O and then increase its photo absorption abilities. XPS technology was used to illustrate the surface status of blend membranes (Fig. 2b). The characteristic peak located at 685.6 eV belongs to the F 1s in PVDF molecules. The N 1s peak at 400.08 eV and the O 1s peak at 531 eV is originated from N-heterocycle of PVP. The intensity variation of such three peaks can generally reflect the ratio change of PVP/PVDF in blend nanofiber membranes. However, it should be noted that the ambient moisture may affect the intensity of O 1s in XPS analysis. The C 1s XPS spectra of all PVP-PVDF blend membranes (Fig. S4†) show a strong peak of –CF2– species located at 290.8 eV, which is the characteristic peak of PVDF.22 The intensity of –CF2– drops with the decrease of PVDF amount in blend membranes. Meanwhile, the broad peak at 282–290 eV consists of four peaks attributed to C–C (or C
O and then increase its photo absorption abilities. XPS technology was used to illustrate the surface status of blend membranes (Fig. 2b). The characteristic peak located at 685.6 eV belongs to the F 1s in PVDF molecules. The N 1s peak at 400.08 eV and the O 1s peak at 531 eV is originated from N-heterocycle of PVP. The intensity variation of such three peaks can generally reflect the ratio change of PVP/PVDF in blend nanofiber membranes. However, it should be noted that the ambient moisture may affect the intensity of O 1s in XPS analysis. The C 1s XPS spectra of all PVP-PVDF blend membranes (Fig. S4†) show a strong peak of –CF2– species located at 290.8 eV, which is the characteristic peak of PVDF.22 The intensity of –CF2– drops with the decrease of PVDF amount in blend membranes. Meanwhile, the broad peak at 282–290 eV consists of four peaks attributed to C–C (or C![[double bond, length as m-dash]](https://www.rsc.org/images/entities/char_e001.gif) C, 284.6 eV), C–N (285.5 eV), –CH(PVDF)– (286.3 eV) and O–C
C, 284.6 eV), C–N (285.5 eV), –CH(PVDF)– (286.3 eV) and O–C![[double bond, length as m-dash]](https://www.rsc.org/images/entities/char_e001.gif) O (287.9 eV), respectively.23,24 Note that although –C–H– bond also exists in PVP, only those belonging to PVDF contributes to the peak at 286.3 eV due to the difference of chemical environment.25 It can be observed that the ratio of the –CH(PVDF)– and –CF2– is almost 1
O (287.9 eV), respectively.23,24 Note that although –C–H– bond also exists in PVP, only those belonging to PVDF contributes to the peak at 286.3 eV due to the difference of chemical environment.25 It can be observed that the ratio of the –CH(PVDF)– and –CF2– is almost 1![[thin space (1/6-em)]](https://www.rsc.org/images/entities/char_2009.gif) :
:![[thin space (1/6-em)]](https://www.rsc.org/images/entities/char_2009.gif) 1, which also demonstrates that the peak at 286.3 eV is only originated from PVDF. The mechanical strength of the series of PVP-PVDF blend membranes was in a range of 2–16 MPa and decreased with the addition of PVP (Fig. S5†).
1, which also demonstrates that the peak at 286.3 eV is only originated from PVDF. The mechanical strength of the series of PVP-PVDF blend membranes was in a range of 2–16 MPa and decreased with the addition of PVP (Fig. S5†).
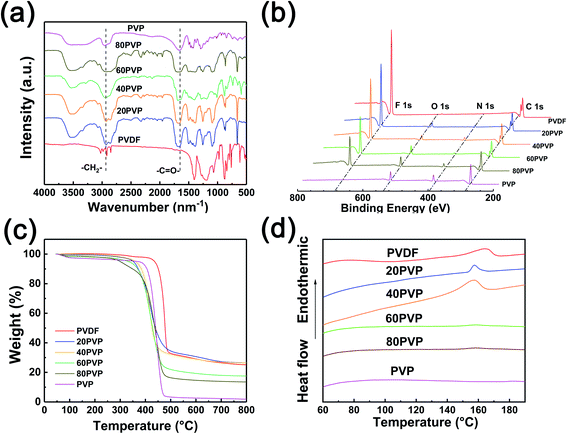 | ||
| Fig. 2 (a) FT-IR spectra, (b) XPS survey spectra, (c) thermal stability and (d) DSC curves of different PVP-PVDF blend nanofiber membranes. | ||
TGA was employed to investigate the thermal stability of PVDF-PVP blend membranes (Fig. 2c). The total weight of PVP-PVDF blend membranes is highly stable before ∼350 °C, indicating that only trace amount of water was evaporated in this process. The DTG results (Fig. S6†) show that PVP-PVDF blend membranes start to degrade around 400 °C. This suggests that such PVP-PVDF membranes can meet the requirements of high-temperature PEMs, whose working condition is always in a range of 80–200 °C. Fig. 2d illustrates the DSC curves of different as-prepared PVP-PVDF blend nanofiber membranes. The curves of pristine PVDF, 20PVP and 40PVP membranes presented an apparent endothermic peak, corresponding to the melting point of crystalline PVDF.26 A progressive decrease of melting point was shown with the increase of PVP, which may be caused by the crystal structure change of PVDF when doping other components.27,28 The disappearance of melting point in 60PVP and 80PVP is due to the suppression of crystalline of PVDF. The above results indicate the successfully blending of PVP and PVDF in blend nanofiber membranes, which is also proven by FTIR results.
The fine crystalline structure of PVP-PVDF blend membranes were studied via XRD and SAXS tests. XRD results (Fig. 3a) shows that both characteristic peaks of PVP and PVDF appear in PVP-PVDF NFMs. The SAXS data (Fig. 3b) clearly illustrate that all the samples show a clear ionomer peak, suggesting that ionic clusters present through the membranes. The ionic cluster dimension (d) can be estimated from the equation: d = 2π/q, where q is the scattering vector. As the amount of PVP increases, the q value also rises from 0.52 to 0.63 nm−1. This result indicates that PVP may facilitate the formation of small-size ionic clusters and decrease their dimensions, which can contribute to a narrower proton transfer nanochannels. On the other hand, the intensity of ionomer peak obviously become weaker when more PVP is doped to PVDF, which further prove the presence of such interaction by reducing electron density.
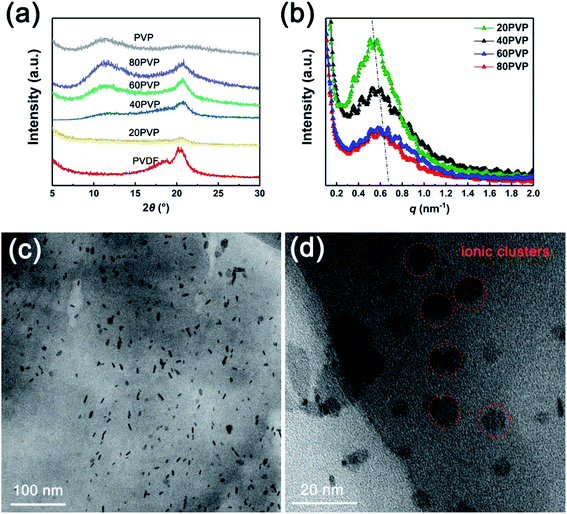 | ||
| Fig. 3 (a) XRD and (b) SAXS data of different PVP-PVDF blend polymer membranes. (c and d) TEM images of 60PVP membrane. | ||
As for PVP-PVDF blend polymers, the presence of hydrophilic PVP in hydrophobic PVDF may induce phase separation, which can be observed by TEM (60PVP), as shown in Fig. 3c and d. Detailed procedure for sample preparation was described in ESI.† It can be seen that those small size ionic clusters are well dispersed on the membrane plane (the dark dots, hydrophilic area) within a range of 9–12 nm. The formation of such ionic clusters has been investigated in many reports. For example, doping less hydrophobic contents into completely hydrophobic poly(lactide-co-glycolide) (PLGA) can significantly enhance the hydrophilicity of its surface, which is caused by the phase separation between these two polymers.29–31 During electrospinning process, such phase separation would happen more severely due to the existence of the shear force and electrical fields applied on the electrospinning solution.32,33 Moreover, these small ionic clusters oriented along nanofiber direction naturally create a large number of long-range proton-conducting channels and facilitate conductivity.
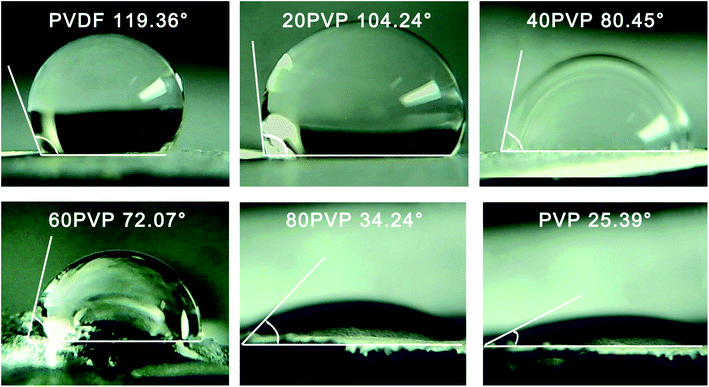
The contact angle of PVP-PVDF blend nanofiber membranes was illustrated in Fig. 4. In this research, the neat PVDF nanofiber membrane shows a contact angle of 119.36°, corresponding to its hydrophobic characteristics. With the increased addition of PVP, the contact angle of blend membranes gradually decreased. Note that the contact angle fell of sharply from 60PVP to 80PVP, which would be caused by the agglomeration of PVP on membrane surface.34 Besides, previous work has demonstrated that PVP content on surface performs higher hydrophilicity than bulk PVP.35
The PA doping level (ADL) is an important parameter to affect properties of anhydrous proton exchange membranes at high temperature. The ADL of the series PVP-PVDF blend nanofiber membranes were calculated and summarized in Table 1 and Fig. 5 (blue line). It can be seen that the ADL rises up from 2.89 to 8.25 as the PVP content increases. The increased ADL compared with the previous work can be explained as follows: as previously demonstrated, the phase separation happened between PVP and PVDF may induce more PVP content to agglomerate on the surface of membranes, which may restrain the competed occupation of PA adsorbing sites on PVDF. Correspondingly, the membrane area and volume swelling rate was calculated before and after PA doping level, as shown in Table 2 and Fig. 5 (for volume swelling, red line). Both area and volume swelling rate shows a rise trend with the ADL increasing.
| Sample | ADL | Area swelling (%) | Volume swelling (%) |
|---|---|---|---|
| 20PVP | 2.787 | 29 | 57.38 |
| 40PVP | 4.149 | 43 | 85.9 |
| 60PVP | 7.355 | 54 | 140.24 |
| 80PVP | 8.257 | 57.5 | 170.9 |
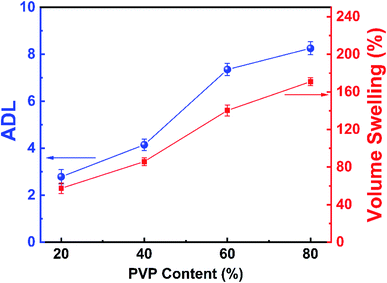 | ||
| Fig. 5 Relationship between PVP content and volume swelling rate (red) as well as ADL (blue) trends of PVP-PVDF blend nanofiber membranes. | ||
| Sample | Strength (MPa) | Breaking strain (%) | ADL | Area swelling (%) | Volume swelling (%) |
|---|---|---|---|---|---|
| 60PVP | 5.95 | 17.06 | 7.35 | 54 | 140.24 |
| SA/MIL101@PVP-PVDF | 21.67 | 16.41 | 12.73 | 76.25 | 206.68 |
3.2 Characterization of SA/MIL-101@PVP-PVDF
To further enhance the proton conductivity of PVP-PVDF blend nanofiber membrane, a cobalt-based metal–organic framework MIL-101 with high porosity and thermal stability has been synthesized. To control the size of MIL-101 for embedding into nanofiber, benzoic acid was added into hydrothermal reaction mixture to modulate the nucleation and growth process.20 Meanwhile, the reaction time was limited into 3 h to prevent the overgrowth of MIL-101 crystals. Fig. 6a shows the microscopic morphology of MIL-101 synthesized with benzoic acid and the average particle size was ∼38 nm calculated by statistical analysis (Fig. 6b). A strong high temperature proton conductor, sulfamic acid (SA), was used to further boost the proton conductivity of composite nanofiber membranes in anhydrous condition. The successful impregnation of sulfamic acid (SA) into MIL-101 was reflected by FT-IR data (Fig. S7, ESI†). Compared with pure MIL-101, the new peaks appeared at 1287 and 1187 cm−1 can be ascribed to the O![[double bond, length as m-dash]](https://www.rsc.org/images/entities/char_e001.gif) S
S![[double bond, length as m-dash]](https://www.rsc.org/images/entities/char_e001.gif) O symmetric and asymmetric stretching modes, respectively. The vibration signals located at 1035 and 1009 cm−1 are originated from S–O bonds from SA molecules. The nitrogen-contained functional groups (N–H or –NH2) from SA contributes to the existence of a new peak at 670 cm−1. Such evidences confirm the presence of SA inside MIL-101 crystals. The SA/MIL-101@PVP-PVDF composite membranes were prepared by adding SA/MIL-101 into PVP-PVDF electrospinning solution. Fig. 6c and d illustrates that SA/MIL-101 were embedded into PVP-PVDF blend nanofiber because of the formation of beads. According to the statistical analysis, the average diameter of SA/MIL-101@PVP-PVDF was ∼475 nm (Fig. S8†). Thinner diameter compared with 60PVP could be attributed to higher charge distribution applied on the electrospinning needle, resulting in a more intense spraying.36
O symmetric and asymmetric stretching modes, respectively. The vibration signals located at 1035 and 1009 cm−1 are originated from S–O bonds from SA molecules. The nitrogen-contained functional groups (N–H or –NH2) from SA contributes to the existence of a new peak at 670 cm−1. Such evidences confirm the presence of SA inside MIL-101 crystals. The SA/MIL-101@PVP-PVDF composite membranes were prepared by adding SA/MIL-101 into PVP-PVDF electrospinning solution. Fig. 6c and d illustrates that SA/MIL-101 were embedded into PVP-PVDF blend nanofiber because of the formation of beads. According to the statistical analysis, the average diameter of SA/MIL-101@PVP-PVDF was ∼475 nm (Fig. S8†). Thinner diameter compared with 60PVP could be attributed to higher charge distribution applied on the electrospinning needle, resulting in a more intense spraying.36
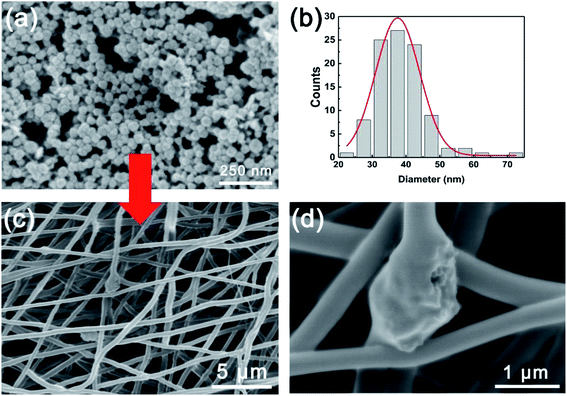 | ||
| Fig. 6 (a) SEM images and (b) size distribution of as-synthesized MIL101. (c and d) SEM images of SA/MIL101@PVP-PVDF. | ||
XRD data of SA/MIL-101 and SA/MIL101@PVP-PVDF were illustrated in Fig. S9.† The result of SA/MIL101 shows typical MIL-101 signals.37 The disappearance of MIL-101 characteristic peaks in XRD data of SA/MIL-101@PVP-PVDF is because the SA/MIL-101 nanoparticles are well covered by polymer nanofibers. Surprisingly, the PVP peak was suppressed at the meantime when SA/MIL-101 was added in PVP-PVDF membranes. We infer that the strong interaction between N-heterocycle of PVP and the high hydrophilic functional groups of SA may attract PVP on the surface to agglomerate inside nanofibers. Significantly, the addition of SA/MIL-101 can also facilitate the mechanical strength. The cooperation of SA/MIL-101 ameliorate the strength and breaking strain of PVP-PVDF blend membranes to 21.67 MPa and 16.41%, respectively, while those of pristine PVP-PVDF blend membranes were only 5.95 Mpa and 14.06%, respectively. The doping of SA/MIL101 further facilitates the PA uptake of the composite membranes (12.73 ADL) compared with the neat 60PVP membrane, along with an acceptable volume swelling rate of 206.68% (Table 2).
3.3 Proton conductivity of membranes
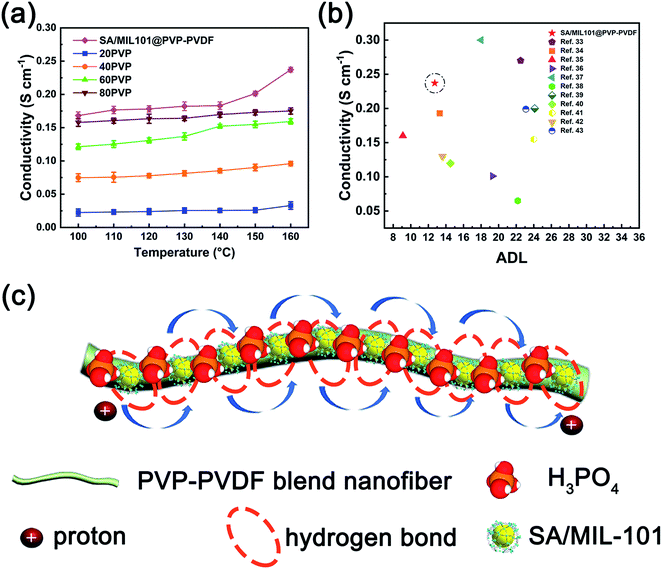
Proton conductivity measurements were performed on PVP-PVDF blend membranes and SA/MIL-101@PVP-PVDF composite membranes after doping PA under anhydrous condition (Fig. 7a). Note that the proton conductivity was measured in transverse direction, although the protons should transfer along the perpendicular direction to the membrane surface in fuel cell environment. The results illustrate that the proton conductivity of PVP-PVDF rises up steadily as the amount of PVP increases. Particularly, the synergistic effect between SA/MIL-101 and PVP-PVDF nanofibers boosts its proton conductivity to 0.168 and 0.237 S cm−1 as the temperature increases from 100 to 160 °C. According to the Arrhenius equation, the corresponding activation energy of 20PVP, 40PVP, 60PVP, 80PVP and SA/MIL101@PVP-PVDF between 100–160 °C is 10.29, 8.99, 10.03, 5.72 and 9.55 kJ mol−1, respectively (Fig. S10†). For comparison, the values of ADL and conductivity at 160 °C of some reported PA-doped high temperature proton exchange membranes were shown in Fig. 7b and Table 3. It can be seen that at a similar ADL level and temperature, the conductivity of SA/MIL101@PVP-PVDF is ∼50 mS cm−1 higher than other reported membranes. Meanwhile, the ADL of SA/MIL101@PVP-PVDF is almost half of other reports at a similar conductivity level. The results suggest that the construction of long-range channels as well as the synergistic effect between PVP-PVDF, SA/MIL101 and PA facilitate the proton conducting behaviors of the composite membrane.| Samples | ADL | Conductivity (160 °C, S cm−1) | References |
|---|---|---|---|
| PBI-16.5%BeIm/22.5 PA | 22.5 | 0.27 | 38 |
| PBI/Allyl-SPAEK-10%-13.3 PA | 13.3 | 0.193 | 39 |
| PES-PVP 80% | 9.1 | ∼0.16 | 40 |
| g3-OPBI | 19.3 | 0.101 | 41 |
| 2-IMPIM | 18 | ∼0.3 | 42 |
| Ph(CF3)-PyOPBI | 22.18 | 0.065 | 43 |
| c-PBI-30 | 24.1 | ∼0.2 | 44 |
| PAEK41-100%VIm | 14.5 | 0.12 | 45 |
| Ph-PBI | 24 | 0.155 | 46 |
| PBI-30%Ph/13.6 PA | 13.6 | 0.13 | 47 |
| c-PBI-20-SiO2-2 | 23.1 | 0.199 | 48 |
| SA/MIL101@PVP-PVDF | 12.73 | 0.237 | This work |
To verify the effects of SA/MIL101 to the conductivity in the composite membranes, we have used 10 wt% SA/MIL101 as additive into 40PVP electrospinning solution to obtain SA/MIL101@40PVP membrane. Its proton conductivity shows a great improvement compared with 40PVP, demonstrating that SA/MIL101 plays an important role in enhancing proton conducting behavior (Fig. S11†). Its highest conductivity (0.195 S cm−1) was reached at 160 °C with an ADL of 10.54.
The possible proton conducting route in PA-doped SA/MIL-101@PVP-PVDF blend membranes is illustrated in Fig. 7c. At high temperature (100–160 °C), the hydrogen bonds between PVP molecules on blend polymers and SA/MIL-101 constructed the proton conducting channel. Meanwhile, the blend polymer nanofiber fabricated by electrospinning method were densely connected each other after hot pressing, which benefits the formation of a long-range proton conducting channel. Consequently, the addition of phosphoric acid results in high proton conductivity under high temperature. The proton may be transferred among H3PO4, H2PO4−, HPO42−, sulfamic acid, N-heterocycle and acid water.
4. Conclusions
In this work, we have investigated a novel electrospun HT-PEM based on PVP-PVDF blend nanofiber membranes. PVP plays a role to associate PA and other high conductivity components, while PVDF contributes to the satisfying thermal stability and mechanical properties to the blend membrane backbone. The inducting effect of electric field during electrospinning process provides abundant small ionic clusters agglomerating on the membrane surface from phase separation, which contributes to the enhancing performance as well as the formation of proton conducting network along nanofiber directions. Moreover, MIL-101 fillers within an average diameter of ∼38 nm containing SA were introduced into the blend PVP-PVDF membranes to improve the overall properties of the HT-PEMs. As a result, the SA/MIL101@PVP-PVDF composited membranes exhibited an excellent conductivity of 0.237 S cm−1 at 160 °C without external humidification at a moderate ADL (12.7). These SA/MIL-101@PVP-PVDF composite membranes provide chances for MOF and electrospun nanofiber structure to HT-PEM applications.Conflicts of interest
There are no conflicts to declare.Acknowledgements
This work was financially supported by Nature Science Foundation of Hunan Province (No. 51502343) and the National key R & D plan (No. 2018YFB1900603)References
- O. Shamardina, A. Chertovich, A. A. Kulikovsky and A. R. Khokhlov, Int. J. Hydrogen Energy, 2010, 35, 9954–9962 CrossRef CAS.
- S. Bose, T. Kuila, T. X. H. Nguyen, N. H. Kim, K.-t. Lau and J. H. Lee, Prog. Polym. Sci., 2011, 36, 813–843 CrossRef CAS.
- H. Zarrin, D. Higgins, Y. Jun, Z. Chen and M. Fowler, J. Phys. Chem. C, 2011, 115, 20774–20781 CrossRef CAS.
- Y. Xia, B. Liu and Y. Wang, J. Power Sources, 2019, 433, 126680 CrossRef CAS.
- R. He, Q. Li, J. O. Jensen and N. J. Bjerrum, J. Polym. Sci., Part A: Polym. Chem., 2007, 45, 2989–2997 CrossRef CAS.
- Ş. Erce, H. Erdener, R. G. Akay, H. Yücel, N. Baç and İ. Eroğlu, Int. J. Hydrogen Energy, 2009, 34, 4645–4652 CrossRef.
- D. Gui, X. Dai, Z. Tao, T. Zheng, X. Wang, M. A. Silver, J. Shu, L. Chen, Y. Wang and T. Zhang, J. Am. Chem. Soc., 2018, 140, 6146–6155 CrossRef CAS PubMed.
- C. Ru, Y. Gu, H. Na, H. Li and C. Zhao, ACS Appl. Mater. Interfaces, 2019, 11, 31899–31908 CrossRef CAS PubMed.
- X.-B. Yang, L.-H. Meng, X.-L. Sui and Z.-B. Wang, J. Mater. Sci., 2019, 54, 1640–1653 CrossRef CAS.
- Z. Yue, Y.-B. Cai and S. Xu, Int. J. Hydrogen Energy, 2016, 41, 10421–10429 CrossRef CAS.
- M. Vinothkannan, A. R. Kim, G. Gnana kumar and D. J. Yoo, RSC Adv., 2018, 8, 7494–7508 RSC.
- G. K. H. Shimizu, J. M. Taylor and S. Kim, Science, 2013, 341, 354–355 CrossRef CAS PubMed.
- A.-L. Li, Q. Gao, J. Xu and X.-H. Bu, Coord. Chem. Rev., 2017, 344, 54–82 CrossRef CAS.
- P. Ramaswamy, N. E. Wong and G. K. H. Shimizu, Chem. Soc. Rev., 2014, 43, 5913–5932 RSC.
- S. Zhang, G. He, X. Gong, X. Zhu, X. Wu, X. Sun, X. Zhao and H. Li, J. Membr. Sci., 2015, 493, 58–65 CrossRef CAS.
- H.-Y. Li and Y.-L. Liu, J. Mater. Chem. A, 2013, 1, 1171–1178 RSC.
- P. Kallem, N. Yanar and H. Choi, ACS Sustainable Chem. Eng., 2019, 7, 1808–1825 CrossRef CAS.
- Q. Yuan, Z. Fu, Y. Wang, W. Chen, X. Wu, X. Gong, D. Zhen, X. Jian and G. He, J. Membr. Sci., 2020, 595, 117516 CrossRef CAS.
- Z. Guo, X. Xu, Y. Xiang, S. Lu and S. P. Jiang, J. Mater. Chem. A, 2015, 3, 148–155 RSC.
- D. Jiang, A. D. Burrows and K. J. Edler, CrystEngComm, 2011, 13, 6916–6919 RSC.
- S. A. El-Hakam, S. E. Samra, S. M. El-Dafrawy, A. A. Ibrahim, R. S. Salama and A. I. Ahmed, RSC Adv., 2018, 8, 20517–20533 RSC.
- T. Sultana, G. L. Georgiev, G. Auner, G. Newaz, H. J. Herfurth and R. Patwa, Appl. Surf. Sci., 2008, 255, 2569–2573 CrossRef CAS.
- X. Chang, Z. Wang, S. Quan, Y. Xu, Z. Jiang and L. Shao, Appl. Surf. Sci., 2014, 316, 537–548 CrossRef CAS.
- S. Li, X. Zhao and H. Zhang, New J. Chem., 2021, 45, 6108–6119 RSC.
- P. Wang, K. L. Tan, E. T. Kang and K. G. Neoh, J. Mater. Chem., 2001, 11, 783–789 RSC.
- N. Chen and L. Hong, Solid State Ionics, 2002, 146, 377–385 CrossRef CAS.
- G. Laroche, Y. Marois, R. Guidoin, M. W. King, L. Martin, T. How and Y. Douville, Journal of Biomedical Materials Research, 1995, 29, 1525–1536 CrossRef CAS PubMed.
- Z. Yuan and X. Dan-Li, Desalination, 2008, 223, 438–447 CrossRef.
- R. Vasita, G. Mani, C. M. Agrawal and D. S. Katti, Polymer, 2010, 51, 3706–3714 CrossRef CAS.
- É. Kiss, I. Bertóti and E. I. Vargha-Butler, J. Colloid Interface Sci., 2002, 245, 91–98 CrossRef PubMed.
- M. Zhang, X. H. Li, Y. D. Gong, N. M. Zhao and X. F. Zhang, Biomaterials, 2002, 23, 2641–2648 CrossRef CAS PubMed.
- L. M. Buttaro, E. Drufva and M. W. Frey, J. Appl. Polym. Sci., 2014, 131 Search PubMed.
- X. Gong, G. He, Y. Wu, S. Zhang, B. Chen, Y. Dai and X. Wu, J. Power Sources, 2017, 358, 134–141 CrossRef CAS.
- C. Xu, W. Huang, X. Lu, D. Yan, S. Chen and H. Huang, Radiat. Phys. Chem., 2012, 81, 1763–1769 CrossRef CAS.
- N. Chen and L. Hong, Polymer, 2002, 43, 1429–1436 CrossRef CAS.
- C. M. Wu and M. H. Chou, Compos. Sci. Technol., 2016, 127, 127–133 CrossRef CAS.
- G. Férey, C. Mellot-Draznieks, C. Serre, F. Millange, J. Dutour, S. Surblé and I. Margiolaki, Science, 2005, 309, 2040 CrossRef PubMed.
- J. Yang, D. Aili, Q. Li, Y. Xu, P. Liu, Q. Che, J. O. Jensen, N. J. Bjerrum and R. He, Polym. Chem., 2013, 4, 4768–4775 RSC.
- M. Liang, P. Wang, H. Li, T. Li, K. Cao, J. Peng, Z. Liu and B. Liu, Chem. J. Chin. Univ., 2020, 41, 2845–2850 Search PubMed.
- X. Xu, H. Wang, S. Lu, Z. Guo, S. Rao, R. Xiu and Y. Xiang, J. Power Sources, 2015, 286, 458–463 CrossRef CAS.
- Y. Xiao, S. Wang, G. Tian, J. Xiang, L. Zhang, P. Cheng, J. Zhang and N. Tang, J. Membr. Sci., 2021, 620, 118858 CrossRef CAS.
- S. Zhou, J. Guan, Z. Li, L. Huang, J. Zheng, S. Li and S. Zhang, J. Mater. Chem. A, 2021, 9, 3925–3930 RSC.
- A. S. Harilal, P. C. Ghosh and T. Jana, ACS Appl. Energy Mater., 2021, 4, 1644–1656 CrossRef.
- X. Li, H. Ma, P. Wang, Z. Liu, J. Peng, W. Hu, Z. Jiang, B. Liu and M. D. Guiver, Chem. Mater., 2020, 32, 1182–1191 CrossRef CAS.
- J. Yang, H. Jiang, J. Wang, Y. Xu, C. Pan, Q. Li and R. He, J. Power Sources, 2020, 480, 228859 CrossRef CAS.
- X. Li, H. Ma, Y. Shen, W. Hu, Z. Jiang, B. Liu and M. D. Guiver, J. Power Sources, 2016, 336, 391–400 CrossRef CAS.
- J. Yang, L. Gao, J. Wang, Y. Xu, C. Liu and R. He, Macromol. Chem. Phys., 2017, 218, 1700009 CrossRef.
- X. Li, H. Ma, P. Wang, Z. Liu, J. Peng, W. Hu, Z. Jiang and B. Liu, ACS Appl. Mater. Interfaces, 2019, 11, 30735–30746 CrossRef CAS PubMed.
Footnote |
| † Electronic supplementary information (ESI) available. See DOI: 10.1039/d1ra04307b |
| This journal is © The Royal Society of Chemistry 2021 |


