 Open Access Article
The effects of temperature shock on the treatment of high-concentration organic wastewater by an Fe0/GO-anaerobic system†
Xiangzhi Wang a,
Yecheng Lina,
Longyu Wanga,
Da Yanga and
Huixia Lan*ab
aCollege of Environment and Safety Engineering of Qingdao University of Science and Technology, Qingdao, 266042, China. E-mail: lanhuixia@163.com
bFujian Provincial Key Laboratory of Ecology-Toxicological Effects & Control for Emerging Contaminants, Putian, Fujian 351100, China
First published on 8th July 2021
Abstract
In order to make up for the defects of traditional anaerobic fermentation systems, such as low energy utilization rates and the slow growth and reproduction of microorganisms, an Fe0/GO (zero-valent iron/graphene oxide) anaerobic biological treatment system was used as a treatment process in this paper, and the impact of temperature shock on the system during the treatment of high-concentration organic wastewater was studied. The experimental results showed that temperature shock reduced the CODCr removal rate and gas production level in each system, but the Fe0/GO group maintained a higher level and had the highest CODCr degradation rate after shocking. After temperature shock, the acetic acid content in each system was higher (above 90%), and the volatile fatty acid (VFA) content in the Fe0/GO group was the lowest. The mixed liquor suspended solids (MLSS) in all systems decreased after impact; the decrease was less in the Fe0/GO group and the increase was largest after temperature recovery. After shocking, the extracellular polymer substance (EPS) protein (PN) and polysaccharide (PS) levels in each system were both low. After temperature recovery, the PN/PS ratio of the Fe0/GO group was the highest, showing a strong impact resistance to temperature.
Introduction
At present, high-concentration organic wastewater is frequently produced in daily life, e.g., citric acid pickling wastewater, food wastewater, and brewing wastewater. The COD of high-concentration organic wastewater is generally above 2000 mg L−1 and the composition is complex, involving a large number of aromatic compounds and heterocyclic compounds, sulfides, nitrogen compounds, heavy metals, etc.; this wastewater can also have strong toxicity, strong acidity, strong alkalinity, high levels of coloring, and an unpleasant smell, having a very bad impact on the surrounding environment.1 Therefore, it is very necessary and urgent to improve the treatment efficacy when it comes to high-concentration organic wastewater. Treatment methods for high-concentration organic wastewater can mainly be divided into physical methods, chemical methods, and biological methods. Physical methods for treating high-concentration organic wastewater include distillation, adsorption, extraction, membrane treatment, etc. These methods usually transfer the organic matter in wastewater rather than decompose it. For example, adsorption methods are widely used in wastewater treatment because of their high efficiency and low cost. However, the regeneration, modification, and treatment of the adsorbent and the post-treatment of wastewater greatly increase the overall cost of this technology. Therefore, it is generally not considered optimal to use physical methods to treat high-concentration organic wastewater. A better choice is to use other advanced technologies in conjunction with physical methods.2 Chemical methods are extremely effective and stable, and methods such as advanced oxidation processes can effectively remove organic matter from high-concentration organic wastewater. However, the cost of chemical processes is prohibitive, and they also produce other waste that is hard to dispose of, such as Fe(OH)3 from the Fenton oxidation process, so chemical processes need to be combined with other methods to reduce costs.3,4 Biochemical methods include aerobic biological treatment technology and anaerobic biological treatment technology. Compared with aerobic biological treatment technology, anaerobic biological treatment technology has the characteristics of low energy consumption, high load resistance, and stable operation, with the abilities to generate less residual sludge and to generate the renewable energy methane.5 Also, because the COD concentration of high-concentration organic wastewater is high, aerobic biological treatment technology is difficult to use; therefore, anaerobic biological treatment technology has become the mainstream technology for the treatment of high-concentration organic wastewater. The anaerobic biological treatment process can be divided into four stages, namely the hydrolysis stage, acid generation stage, acetic acid generation stage, and methane generation stage. Methanogens can decompose acetic acid to produce methane, which plays a key role in the methanogenic stage. However, methanogens have low energy utilization rates and slow growth and reproduction rates, leading to low wastewater treatment efficiency and long treatment cycle times.6 Therefore, it is necessary to improve the activities and growth rates of methanogens in order to improve the anaerobic digestion efficiency.Temperature is a key factor affecting anaerobic biological treatment technology. A change in temperature will have a great influence on the physicochemical properties of the anaerobic sludge and the microbial community structure in the activated sludge system, which will further affect the anaerobic digestion efficiency and effluent quality. Liu et al. found that a low temperature of 10 °C could reduce the relative abundance of hydrolytic bacteria, decrease the removal of CODCr, and increase the concentration of VFAs.7 In high-temperature digestion, the anaerobic fermentation system is more sensitive to temperature changes. Wu et al. studied the influence of temperature fluctuations on the thermophilic anaerobic digestion of domestic waste and found that after a sudden drop in temperature, gas production was almost zero, volatile fatty acids rapidly accumulated, and methanogen activity decreased. Also, the longer the sudden temperature drop lasted, the longer the recovery time of the anaerobic system.8 During the practical application of anaerobic biotechnology, temperature fluctuations are inevitable. Via adding zero-valent iron (Fe0) and graphene oxide (GO), the growth and reproduction of microorganisms can be stimulated, and the activities of related enzymes can be enhanced, thus alleviating the impact of temperature changes to a certain extent.
Compared with other iron materials, Fe0 has a larger specific surface area and stronger adsorption capacity. As a cheap and green reductive active metal, Fe0 can provide electrons for microorganisms in an anaerobic environment through being oxidized to Fe2+ and Fe3+, thus reducing the oxidation reduction potential (ORP) of the system.9 Many studies have shown that Fe0 can promote the anaerobic microbial degradation process, enrich the functional microorganisms involved in the anaerobic degradation of aromatic pollutants, significantly improve the bacterial community structure, and remarkably increase both methane production in the anaerobic system and the wastewater CODCr removal rate.10,11 However, there are still problems relating to the use of Fe0. Fe0 nanoparticles easily agglomerate and the specific surface area decreases after agglomeration, reducing the treatment efficiency. In addition, Fe0 will undergo sedimentation after addition, resulting in the accumulation of iron powder at the bottom of the reactor, where it cannot be fully functional. Via combining graphene oxide (GO) with Fe0, the self-agglomeration of nano-Fe0 can be effectively reduced,12 thus improving the treatment efficiency.
Graphene oxide (GO) is a functionalized derivative of graphene with a large specific surface area and a layered structure, and it shows good adsorption performance toward pollutants. Compared with graphene, GO is easier to synthesize, without further reduction using hydrazine hydrate, and it is lower cost. Also, the GO surface has more abundant hydrophilic groups; the hydrophilic groups provide a number of active sites for a variety of organic molecules, polymers, and biological molecules, raising the possibility of GO surface functionalization and offering plenty of opportunities for the application of nanocomposite materials.13 As an excellent electron shuttle, GO can accelerate the electron transfer processes between anaerobic microorganisms, thus improving the activities of microorganisms and promoting the growth and reproduction of microorganisms. For example, GO can improve the interspecies electron transfer efficiency between Geobacter metallireducens and Methanosarcina barkeri.14 Zhang et al. added GO to an anaerobic fermentation system for treating pig manure, and it significantly improved the degradation of propionic acid and was conducive to the formation of a stable acid-type fermentation microbial climax community.15 When Fe0 and GO are added into an anaerobic system at the same time, they can not only fully show their respective advantages, but they can also complement each other's defects, allowing pollutants to be removed more efficiently. Therefore, it is a good choice to use an Fe0/GO composite to strengthen anaerobic systems. However, in the area of the anaerobic treatment of organic wastewater, there is almost no research on the simultaneous addition of GO and Fe0 to anaerobic systems.
In this paper, the anti-temperature shock performance of an Fe0/GO-anaerobic system is studied from the following aspects: (1) performance changes of the system under temperature shock; (2) variations in the volatile fatty acid (VFA) content of the system; (3) changes in the sludge concentration; and (4) the effects of temperature shock on extracellular polymers.
Materials and methods
Wastewater and inoculated sludge
Simulated citric acid wastewater was used in the experiments. The chemical oxygen demand based on K2Cr2O7 testing (CODCr) was about 8000 mg L−1 and the pH was 4.0–5.0. Ammonium sulfate ((NH4)2SO4) and potassium dihydrogen phosphate (KH2PO4) were added as nitrogen and phosphorus sources with a CODCr![[thin space (1/6-em)]](https://www.rsc.org/images/entities/char_2009.gif) :
:![[thin space (1/6-em)]](https://www.rsc.org/images/entities/char_2009.gif) N
N![[thin space (1/6-em)]](https://www.rsc.org/images/entities/char_2009.gif) :
:![[thin space (1/6-em)]](https://www.rsc.org/images/entities/char_2009.gif) P weight ratio of 200
P weight ratio of 200![[thin space (1/6-em)]](https://www.rsc.org/images/entities/char_2009.gif) :
:![[thin space (1/6-em)]](https://www.rsc.org/images/entities/char_2009.gif) 5
5![[thin space (1/6-em)]](https://www.rsc.org/images/entities/char_2009.gif) :
:![[thin space (1/6-em)]](https://www.rsc.org/images/entities/char_2009.gif) 1. The inoculated sludge was obtained from the an upflow anaerobic sludge bed (UASB) reactor from a brewery in Qingdao, China.
1. The inoculated sludge was obtained from the an upflow anaerobic sludge bed (UASB) reactor from a brewery in Qingdao, China.
Experimental methods
In order to reduce the cost of engineering and to seek better promotion effects, micron-grade reduced iron powder was used in the experiments in a compound with GO to obtain an Fe0/GO composite. GO was prepared via a modified Hummers' method.16 Fe0 and GO at a mass ratio of 5![[thin space (1/6-em)]](https://www.rsc.org/images/entities/char_2009.gif) :
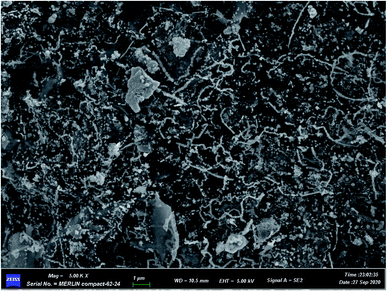
:![[thin space (1/6-em)]](https://www.rsc.org/images/entities/char_2009.gif) 1 (Fe0: 1.0 g and GO: 0.2 g) were placed in a 100 mL beaker, 20 mL of deionized water was added, and ultrasonic treatment was conducted for 20 min under nitrogen protection. Then, after ultrasound treatment, the material was put into a vacuum drying oven and dried at 105 °C to get the Fe0/GO composite. The amount of composite combined with deionized water was 0.06 g. The activity of the prepared Fe0/GO composite was maintained for at least 6 months in previous research, and at the end of use, the Fe0/GO composite can be easily recovered with a magnet. A scanning electron microscopy (SEM) image of the prepared Fe0/GO material is shown in Fig. 1. In Fig. 1, GO sheets were coated with a large number of small particles. The particles were evenly dispersed, and agglomeration was not obvious, indicating that GO and Fe0 were fully and evenly compounded. The average particle size of the iron powder used was 37.4 μm. The BET surface areas of Fe0, GO and the Fe0/GO composite are shown in Table 1. Compared with Fe0 and GO, the BET surface area of the Fe0/GO composite is greatly increased, which was conducive to the adsorption of organic matter in the system and provided growth sites for microorganisms; this promoted the growth and reproduction of microorganisms and improved the microorganism activity, thus enhancing the wastewater treatment effects.
1 (Fe0: 1.0 g and GO: 0.2 g) were placed in a 100 mL beaker, 20 mL of deionized water was added, and ultrasonic treatment was conducted for 20 min under nitrogen protection. Then, after ultrasound treatment, the material was put into a vacuum drying oven and dried at 105 °C to get the Fe0/GO composite. The amount of composite combined with deionized water was 0.06 g. The activity of the prepared Fe0/GO composite was maintained for at least 6 months in previous research, and at the end of use, the Fe0/GO composite can be easily recovered with a magnet. A scanning electron microscopy (SEM) image of the prepared Fe0/GO material is shown in Fig. 1. In Fig. 1, GO sheets were coated with a large number of small particles. The particles were evenly dispersed, and agglomeration was not obvious, indicating that GO and Fe0 were fully and evenly compounded. The average particle size of the iron powder used was 37.4 μm. The BET surface areas of Fe0, GO and the Fe0/GO composite are shown in Table 1. Compared with Fe0 and GO, the BET surface area of the Fe0/GO composite is greatly increased, which was conducive to the adsorption of organic matter in the system and provided growth sites for microorganisms; this promoted the growth and reproduction of microorganisms and improved the microorganism activity, thus enhancing the wastewater treatment effects.
| Material | BET surface area (m2 g−1) |
|---|---|
| Fe0 | 1.85 |
| GO | 4.89 |
| Fe0/GO composite | 16.72 |
250 mL of inoculated sludge was added into four reactors. The four reactors were labeled as follows: blank group; GO group; Fe0 group; and Fe0/GO group. 0.1 g of GO, 0.5 g of Fe0, and 0.6 g of the Fe0/GO composite were added into the GO group, Fe0 group, and Fe0/GO group, respectively, with 250 mL of experimental influent. The four anaerobic reactors were put into a shaking table at a temperature of 37 °C and with a treatment cycle length of 12 h. The influent and effluent volumes from each cycle were 250 mL, and the pH of the influent was adjusted to 7.2. After a couple of cycles, the gas production levels of the four reactors were 488 mL, 496 mL, 505 mL, and 511 mL, respectively, the CODCr removal rates were 82.7%, 85.8%, 88.9%, and 91.8%, respectively, and the MLSS levels were 8.42, 8.35, 8.66, and 8.83 g L−1, respectively. Then the temperature shock experiment was carried out.
The optimal temperature for the growth and metabolism of anaerobic fermentation bacteria is between 35 °C and 45 °C, and during actual production, the temperature of the anaerobic system will not be lower than 30 °C; some bacteria will die when the temperature is higher than 50 °C. Therefore, the low temperature and high temperature were set to be 30 °C and 50 °C in the temperature shock experiment. The temperature of the shaking table was set to 30 °C and the treatment period was 12 h; the effluent pH, gas production level, and CODCr removal rate of each of the four reactors were measured in each cycle. At the end of the seventh cycle, PN, PS, VFA, and MLSS levels were determined. Then, the shaking table temperature was restored to 37 °C, and the above steps were repeated for 7 cycles. After this, the shaking table temperature was set to 50 °C and the above steps were repeated.
Analysis methods
pH values were determined using a pH meter (PHS-3C/501, INESA, China) with composite electrodes. CODCr concentrations were determined using a COD analyzer (DR1010, HACH, USA). The produced gas volumes were measured via the drainage method.The volatile fatty acid (VFA) levels were determined by gas chromatography (GC2014C, Shimadzu, Japan). Before determination, the supernatant in the reactor was adjusted to pH <2 using 1 mol L−1 hydrochloric acid, before standing for 5 min, and then being centrifuged at 3000 rpm for 10 min; 5–10 mL of the supernatant was then absorbed with a syringe, filtered through a 0.22 μm filter membrane, and finally analyzed using a gas chromatograph. The parameters of the gas chromatograph were as follows: the detector was an ID detector; a DB-FFAP capillary column was used, the size of which was 30 m × 0.32 mm (ID) × 0.25 μm; and the capillary column flow rate was adjusted to 75 mL min−1. The samples were injected with 5![[thin space (1/6-em)]](https://www.rsc.org/images/entities/char_2009.gif) :
:![[thin space (1/6-em)]](https://www.rsc.org/images/entities/char_2009.gif) 1 shunting, with a volume of 2 μm for each injection, and the retention time was 3.5 min. The temperatures of the inlet, detector, and cylinder were set as 220 °C, 230 °C, and 100 °C respectively.
1 shunting, with a volume of 2 μm for each injection, and the retention time was 3.5 min. The temperatures of the inlet, detector, and cylinder were set as 220 °C, 230 °C, and 100 °C respectively.
The mixed liquor suspended solid (MLSS) levels were measured according to the national standard method.17 The phenol-sulfuric acid method was used to quantify the polysaccharide (PS) content using glucose as the standard.18 The protein (PN) content was determined via the modified Lowry method using bovine serum albumin as the standard.19
BET surface areas were measured using a surface area and porosity analyzer (ASAP2460-2, Mack Corporation, USA).
The extended uncertainty of each measurement was analyzed via an evaluation of uncertainty in chemical analysis measurements.20 The extended uncertainty results are shown in Table 2.
| Method of measurement | Extended uncertainty (U, k = 2) |
|---|---|
| COD | 67.1 mg L−1 |
| pH | 0.03 |
| VFA (acetic acid, propionic acid, butyric acid, valeric acid) | 79.6 mg L−1, 8.1 mg L−1, 2.7 mg L−1, 0.7 mg L−1 |
| MLSS | 0.4 g L−1 |
| EPS | 5.3 mg L−1 |
Results and discussion
Effects of temperature shock on anaerobic system performance
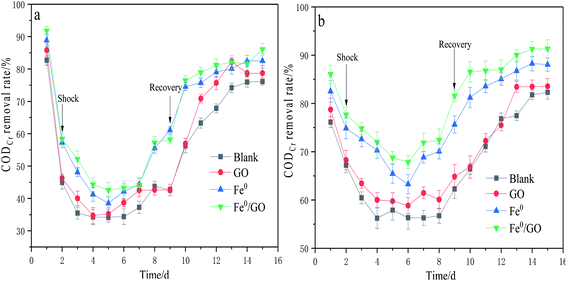
As can be seen from Fig. 2, the CODCr removal rates of all the reactors decreased after temperature shock, but the degrees of impact of low temperature shock and high temperature shock on the CODCr removal rates were different. Under the impact of low temperature, the CODCr removal rate of each reactor decreased significantly; the blank, Fe0, and Fe0/GO groups reached their lowest points on the fourth day after impact, and the GO group reached its lowest point on the third day. The lowest CODCr removal rates of the four groups were 34.21%, 34.71%, 38.54%, and 42.58%, respectively. After the temperature was restored, the CODCr removal rate of each reactor increased, and the Fe0/GO group picked up faster, tended to stabilize earlier, and always maintained a high CODCr removal rate. Under high temperature impact, the CODCr removal rate of each reactor decreased less than in response to low temperature impact, and the lowest values were 56.23%, 60.01%, 63.28%, and 67.84%, respectively.After temperature recovery, the change in the CODCr removal rate of each reactor was similar to that under low temperature shock conditions. The Fe0/GO group also recovered faster, and the CODCr removal rate after recovery reached 91.33%. It can be seen from a comparison of high temperature and low temperature impact that low temperature had a greater impact on the anaerobic system.
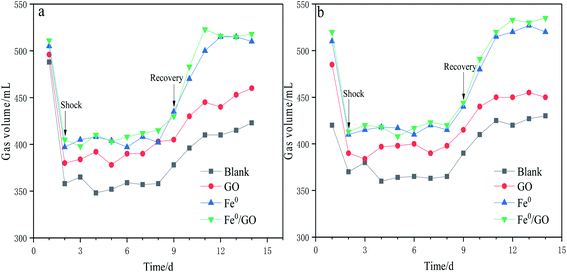
As can be seen from Fig. 3, following temperature shock, gas production was immediately affected. Gas production in each reactor significantly decreased and remained stable, indicating that methanogens were very sensitive to temperature changes. After temperature shock, the gas production levels of the blank, GO, Fe0, and Fe0/GO systems were about 360, 380, 400, and 410 mL, respectively. When the temperature returned to normal, the gas production of each system increased rapidly, and the gas production of the Fe0/GO system always maintained a high level, which was consistent with the results showing the CODCr removal rate change. Following temperature shock, the activity of methanogens was inhibited, and the gas production abilities of the system were reduced, thus reducing the CODCr removal rate. However, the gas production levels and CODCr removal rates of the system with the Fe0/GO composite were relatively high in response to temperature shock, and they rose quickly and tended to be stable after temperature recovery. This indicated that the addition of Fe0/GO can significantly improve the abilities of anaerobic treatment systems with high-concentration organic wastewater to resist the impacts of temperature change and enable anaerobic systems to maintain stronger performance under adverse temperatures, maintaining normal systems operation. This was undoubtedly due to the effects of Fe0 and GO on the anaerobic system and their mutual assistance. GO had strong adsorption effects on organic pollutants, and the addition of Fe0 can improve the activities of some coenzymes of anaerobic bacteria, which is helpful for promoting the conversion of propionate and butyrate to acetate in the stage of hydrolytic acidification.9 At the same time, the addition of Fe0 reduced the ORP of the system, provided good growth conditions for anaerobic microorganisms, and further improved the treatment effects in the Fe0/GO system toward high-concentration organic wastewater. Hu et al. used biochar, which also served as a carbon source, and iron to reinforce an UASB reactor, and found that the COD removal rate and methane production of the reactor were significantly improved and the reactor performance was enhanced.21 Sun et al. used granular activated carbon modified with nanoscale zero-valent iron (NZVI) to enhance methane production from synthetic brewery water in an anaerobic system. They found that the COD removal rate and methane production increased by 9.38% and 14.29% in the anaerobic system with Fe–C composite particles compared with a control system.22 Compared with the studies by Hu et al. and Sun et al., Fe0/GO also had a significant promoting effect on the performance of the anaerobic system.
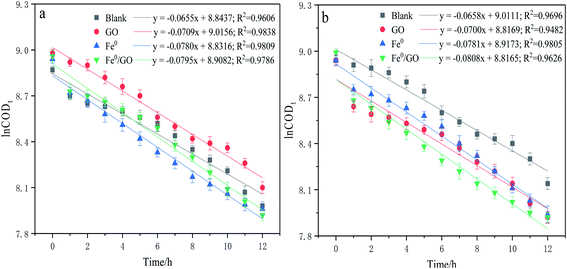
The degradation kinetics related to the CODCr removal rate in each system were investigated under temperature shock conditions. As shown in Fig. 4, during temperature shock experiments, the linear relationship of each system was good and the R2 values were greater than 0.9000; first-order reaction kinetics were obeyed. Based on the formula  , when the temperature was 30 °C, the equations describing the degradation kinetics of each system are as follows:
When the temperature was 50 °C, the equations describing the degradation kinetics of each system are as follows:
Comparing the equations describing the degradation kinetics for each system, it was found that the values of the Fe0/GO system degradation rate constant k (30 °C: k = 0.0795 h−1; 50 °C: k = 0.0808 h−1) were greater than every other system, which indicated that the anaerobic microorganisms within the Fe0/GO system retained high activity when subjected to temperature shock. Upon the addition of Fe0/GO, the anaerobic system had a faster degradation rate and a shorter treatment cycle than the other systems at unfavorable temperatures, which made the anaerobic system more efficient in the treatment of high-concentration organic wastewater. Therefore, the addition of Fe0/GO can improve the impact resistance abilities of anaerobic systems to temperature shock.
Effects of temperature shock on effluent VFA levels
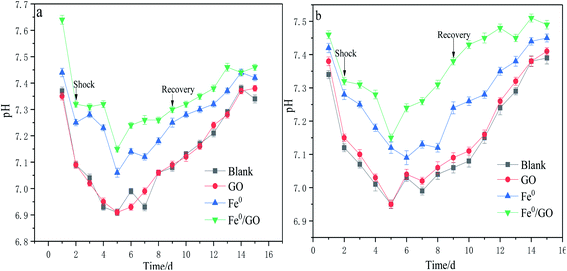
As shown in Fig. 5, when the system was subjected to temperature shock, the effluent VFA content of each system was at a high level, and the effluent VFA content decreased after the temperature returned to normal. Also examining the pH changes in each system (Fig. 6), the VFA content in the blank group was the highest and the pH of the effluent was the lowest after impact. The VFA content in the Fe0/GO group was the lowest and the effluent pH was the highest. By comparing the changes in the VFA content in each system after high and low temperature shock, it was found that the impact of low temperature shock on the VFA content in each system was greater than the impact under high temperature shock. This may be because there were large numbers of mesophilic microorganisms and small numbers of thermophilic microorganisms in the systems. Low temperature inhibited the activities of biological enzymes in the microorganisms and affected the abilities of anaerobic bacteria to degrade organic matter in wastewater; therefore, the effluent VFA content was relatively high. In the experimental process, the acetic acid content in each system always maintained a high level (above 90%), indicating that the anaerobic system involved a stable acetic-acid-type climax fermentation community under temperature shock conditions. As is shown in the comparison of various systems, from the process of temperature shock to temperature recovery, the effluent VFA content of the Fe0/GO group was significantly lower than every other group, and the effluent pH was relatively higher. Therefore, the Fe0/GO group had the strongest impact resistance to temperature. Fe0/GO can enhance the degradation of organic matter in anaerobic systems and improve the operations of anaerobic systems. This is mainly because Fe0 and GO can promote electron transfer in the system. An appropriate dosage of Fe0 can increase the activities of methanogens, and promote the conversion of Methanothrix to Methanosarcina (the acetic acid utilization rate of Methanosarcina is 3–5 times higher than that of Methanothrix) in the anaerobic reactor, so as to accelerate the utilization of acetic acid.23 It also can promote the co-metabolism of acid-producing bacteria and methanogens and reduce the accumulation of VFAs in the system,24,25 thus alleviating the adverse effects of temperature shock on the anaerobic system. Meanwhile, Fe0 can play a role in controlling sulfur,26 as wastewater contains a certain concentration of SO42−. In the process of wastewater treatment, anaerobic microorganisms convert SO42− ions into H2S, which is easily soluble in water and reacts with the added Fe0 to induce FeS precipitation, which reduces the acidity of the system and keeps the pH of the effluent at a high level. This prevented the accumulation of VFAs and the decrease of system pH during temperature shock from affecting the living environment of methanogens.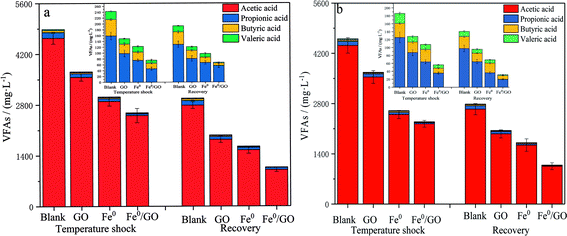 | ||
| Fig. 5 The effects of temperature shock on VFA levels: (a) 30 °C and (b) 50 °C (the insets show the VFA levels without acetic acid). | ||
Influence of temperature shock on system MLSS
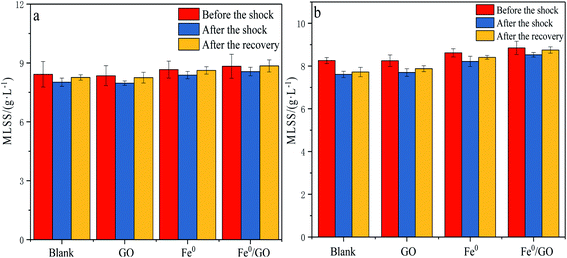
It can be seen from Fig. 7 that the impacts of different temperature shocks on MLSS were not very different. When the system was impacted by high temperature or low temperature, the MLSS level in each system decreased, and the MLSS concentration slightly increased after the temperature was restored. After low temperature shock, the MLSS levels for each system were 8.02, 7.97, 8.38, and 8.56 g L−1, respectively. Compared with the levels before shocking, the MLSS value of the Fe0/GO group decreased slightly and remained relatively high. After the temperature was restored, the MLSS value of the Fe0/GO group reached 8.85 g L−1, which was the largest increase. After high temperature shock, the change in the MLSS value of each system was the same as that seen in response to low temperature shock. The Fe0/GO group was less affected and the MLSS value rose more after the temperature was restored. This was because Fe0 and GO have a large specific surface area and strong adsorption capacity; they can adsorb organic pollutants on the surface for decomposition via microbial flora on the surface to provide energy, thereby accelerating the growth of anaerobic microorganisms and achieving an increase in the MLSS level. Fe0 had a catalytic effect on the process of anaerobic digestion, promoted the conversion of organic substrates to biogas,27 provided energy for the growth of microorganisms, and accelerated the growth of anaerobic microorganisms. Moreover, Fe0 will be evenly dispersed on the GO surface, and a large number of anaerobic microorganisms will begin to accumulate and grow on the GO surface under Fe0 catalysis, which improves the flocs and microbial population structure of the sludge to a certain extent.28 In temperature shock experiments, the Fe0/GO group always maintained a higher sludge concentration. Combined with various effluent indicators, it was further verified that the Fe0/GO complex can enhance the activities of anaerobic microorganisms and improve the performance of anaerobic systems. Therefore, the system can show stronger resistance to temperature shock after the addition of Fe0 and GO.Effects of temperature shock on extracellular polymers
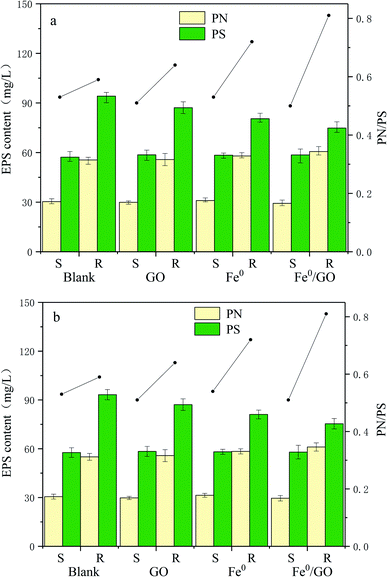
Extracellular polymeric substances (EPS) are a mixture of high molecular weight polymers secreted by microorganisms, which alter the physicochemical characteristics of the cellular surface, such as the charge and hydrophobicity. They are composed of proteins, polysaccharides, nucleic acids, lipids, and humic substances.29,30 Proteins and polysaccharides are the main elements of EPS, making up 1–60% and 40–95% of the total EPS components, respectively.31 Polysaccharides are hydrophilic polymers that reversibly absorb and exude water or biological fluids and contribute to high water retention. An increase in the bound water content of a floc results in poor settling and dewatering. Proteins, and the amino acid components of these proteins, contribute to the hydrophobic character of flocs.32 An increase in the protein content will reduce the retained water in the sludge, making the sludge and water easy to separate and allowing cells to bind closely. In addition, the bonding abilities between PN and cations are greater than bonding involving PS, and a three-dimensional structure is formed to maintain the integrity and stability of sludge via cationic bridges.33 In addition, the protein/polysaccharide ratio (PN/PS) is also an important index reflecting the flocculation performance of sludge.As can be seen from Fig. 8, the changes in the protein and polysaccharide content levels in each system under high temperature shock and low temperature shock were basically the same. After temperature shock, the levels of protein and polysaccharide in each system were low, and there were no significant differences. Polysaccharides were maintained at 50–60 mg L−1 and proteins were maintained at 25–35 mg L−1. The PN/PS values of the systems were also roughly the same. After the temperature was restored, the protein and polysaccharide levels in each system increased significantly, and the total EPS level of each system was similar. The polysaccharide content was above 70 mg L−1 and the protein content was above 50 mg L−1; out of all the groups, the polysaccharide content was the lowest and the protein content was the highest in the Fe0/GO group. The PN/PS ratio of the Fe0/GO group was the largest, and the PN/PS values of the Fe0 group and the Fe0/GO group were significantly higher than those of the blank group and the GO group. This may be because iron ions can act as chelating agents, promoting EPS generation and allowing EPS to produce more PN.34 In the experiments, the PN/PS ratio of the GO group was slightly higher than that of the blank group. Studies by Guo et al. also indicated that GO had little effect on the total EPS content, but it changed the composition of EPS. The PN content and PN/PS ratio increased when GO was added to aerobic granular sludge for nitrogen removal.35 The results showed that the sludge activity of each system was affected and the flocculation performance of the sludge became worse at unsuitable temperatures. In contrast, the addition of Fe0/GO did not improve the flocculation performance of anaerobic activated sludge. However, when the temperature was restored, the advantages of adding Fe0/GO to the system appeared. The PN content increased significantly, which made the PN/PS ratio rise significantly, indicating that Fe0/GO can improve the flocculation performance of the sludge at normal temperatures and enhance the integrity and stability of the sludge.
Conclusions
An Fe0/GO complex system was less affected by temperature shock, and its CODCr removal rate, level of gas production, and CODCr degradation rate were better than other systems; they also rapidly improved after the temperature was restored. Moreover, its effluent VFA content was lower, there was no excessive accumulation of fatty acids, and the system pH was higher, which enabled the anaerobic reactor to operate well even under unsuitable temperature conditions. The sludge-related indices of the system, such as MLSS and extracellular polymer levels, showed little change after temperature shock, and the anaerobic microorganisms in this system had stronger activities. Therefore, the addition of an Fe0/GO composite can greatly improve the impact resistance of anaerobic systems to temperature shock, laying good foundations for the application of Fe0/GO in practical engineering.Conflicts of interest
There are no conflicts to declare.Acknowledgements
The authors are grateful to the Shandong Provincial Key Research and Development Program (SPKR&DP) (Grant no. 2019GGX102029) and the Open Fund of State Key Laboratory Base of Eco-Chemical Engineering (Grant no. KF1706).References
- Y. Xuan, Chem. Eng. Des. Commun., 2019, 45(06), 98–99 Search PubMed.
- Z. Kong, L. Li, Y. Xue, M. Yang and Y. Li, J. Cleaner Prod., 2019, 231, 913–927 CrossRef CAS.
- M. G. Alalm, A. Tawfik and S. Ookawara, J. Water. Process. Eng., 2015, 8, 55–63 CrossRef.
- A. D. Bokare and W. Choi, J. Hazard. Mater., 2014, 275, 121–135 CrossRef CAS.
- M. Shen, X. Hai, Y. Zheng, P. Li, Y. Li, W. Jin, D. Li, Y. Li, J. Zhao, H. Lei, H. Xiao, Y. Li, G. Yan, Z. Cao and Q. Bu, Sci. Total Environ., 2019, 656, 843–851 CrossRef CAS PubMed.
- Y. Yang, Y. Zhang, Z. Li, Z. Zhao, X. Quan and Z. Zhao, J. Cleaner Prod., 2017, 149(15), 1101–1108 CrossRef CAS.
- Z. Liu, X. Liu, T. Zhou, S. Zhang, J. Li and Q. Yang, Environ. Sci., 2020, 41(09), 4141–4149 Search PubMed.
- M. Wu and K. Sun, Environ. Sci., 2006, 27(4), 805–809 Search PubMed.
- X. Hao, J. Wei, M. C. van Loosdrecht and D. Cao, Water Res., 2017, 117, 58–67 CrossRef CAS PubMed.
- D. Wu, S. Zheng, A. Ding, G. Sun and M. Yang, J. Hazard. Mater., 2015, 286, 1–6 CrossRef CAS.
- W. Xu, H. Zhao, H. Cao, Y. Zhang, Y. Sheng, T. Li, S. Zhou and H. Li, Bioresour. Technol., 2020, 300, 122667 CrossRef CAS.
- P. Jiang, Y. Li, Y. Tong, J. Li, H. Lan, M. Fu and R. Liu, Acta Sci. Circumstantiae, 2016, 36(07), 2443–2450 CAS.
- T. S. Andrew, M. L. Anna, Z. Songshan, B. Liu and L. Sun, Nano Mater. Sci., 2019, 2589–9651 Search PubMed.
- K. Igarashi, E. Miyako and S. Kato, Front. Microbiol., 2020, 10, 3068 CrossRef PubMed.
- J. Zhang, Z. Wang, Y. Wang, H. Zhong, Q. Sui, C. Zhang and Y. Wei, Bioresour. Technol., 2017, 245, 850–859 CrossRef CAS PubMed.
- D. K. Becerra-Paniagua, M. Sotelo-Lerma and H. Hu, J. Mater. Sci.: Mater. Electron., 2019, 30(4), 3973–3983 CrossRef CAS.
- National EPA, Monitoring methods of water and wastewater, Environmental Scientifc Publishing Company, Peking, 2002 Search PubMed.
- M. Dubois, K. A. Gilles, J. K. Hamilton, P. T. Rebers and F. Smith, Anal. Chem., 1956, 28(3), 350–356 CrossRef CAS.
- B. Frølund, R. Palmgren, K. Keiding and P. H. Nielsen, Water Res., 1996, 30(8), 1749–1758 CrossRef.
- The State Bureau of Quality and Technical Supervision, Evaluation of uncertainty in chemical analysis measurement, JJF 1135-2005, 2005 Search PubMed.
- Y. Hu, C. Shi, H. Ma, J. Wu, T. Kobayashi and K. Xu, J. Environ. Chem. Eng., 2021, 9(4), 105603 CrossRef CAS.
- M. Sun, Z. Zhang, G. Liu, M. Lv and Y. Feng, Sci. Total Environ., 2021, 760, 143933 CrossRef CAS PubMed.
- M. Takashima and R. E. Speece, Res. J. Water Pollut. Control Fed., 1989, 1645–1650 CAS.
- S. Chen, A. E. Rotaru, P. M. Shrestha, N. S. Malvankar, F. Liu, W. Fan, K. P. Nevin and D. R. Lovley, Sci. Rep., 2014, 4(1), 1–7 CrossRef PubMed.
- F. Liu, A. E. Rotaru, P. M. Shrestha, N. S. Malvankar, K. P. Nevin and D. R. Lovley, Energy Environ. Sci., 2012, 5(10), 8982–8989 RSC.
- F. G. Fermoso, J. Bartacek, R. Manzano, H. P. Van Leeuwen and P. N. Lens, Bioresour. Technol., 2010, 101(24), 9429–9437 CrossRef CAS PubMed.
- S. S. Yekta, A. Lindmark, U. Skyllberg, U. A. Danielsson and B. H. Svensson, J. Hazard. Mater., 2014, 269, 83–88 CrossRef PubMed.
- X. Y. Liang, B. Y. Gao and S. Q. Ni, Bioresour. Technol., 2017, 227, 44–49 CrossRef CAS.
- Y. Ma, P. K. Yuan, Y. Wu, X. Y. Cheng, H. Meng, H. He, G. X. Wang, X. M. Chen, W. M. Xie and L. M. Zhang, Chemosphere, 2021, 274, 129798 CrossRef CAS.
- K. Y. Show, D. J. Lee and J. H. Tay, Appl. Biochem. Biotechnol., 2012, 167(6), 1622–1640 CrossRef CAS PubMed.
- Y. Zhang, H. Ma, Q. Niu, R. Chen, T. Hojo and Y. Y. Li, RSC Adv., 2016, 6(114), 113289–113297 RSC.
- M. Basuvaraj, J. Fein and S. N. Liss, Water Res., 2015, 82, 104–117 CrossRef CAS.
- B. Q. Liao, D. G. Allen, I. G. Droppo, G. G. Leppard and S. N. Liss, Water Res., 2001, 35(2), 339–350 CrossRef CAS.
- L. Huang, G. Liu, G. Dong, X. Wu, C. Wang and Y. Liu, Chem. Eng. J., 2017, 316, 525–533 CrossRef CAS.
- C. Guo, Y. Wang, Y. Luo, X. Chen, Y. Lin and X. Liu, Ecotoxicol. Environ. Saf., 2018, 156, 287–293 CrossRef CAS.
Footnote |
| † Electronic supplementary information (ESI) available. See DOI: 10.1039/d1ra04773f |
| This journal is © The Royal Society of Chemistry 2021 |

