 Open Access Article
Unraveling the site-specific energy transfer driven tunable emission characteristics of Eu3+ & Tb3+ co-doped Ca10(PO4)6F2 phosphors†
Nimai Pathak *a,
Bhagyalaxmi Chundawatb,
Pratik Das
 c,
Pampa Modakd and
Brindaban Modak
 ef
ef
aRadiochemistry Division, Bhabha Atomic Research Centre, Mumbai, 400085, India. E-mail: nmpathak4@gmail.com; nimai@barc.gov.in; Fax: +91-22-25405151; Tel: +91-22-25590715
bEx MSc Student from KJ Somaiya College of Science & Commerce, Vidyavihar, Mumbai, India
cFuel Chemistry Division, Bhabha Atomic Research Centre, Mumbai, 400085, India
dRadiological Safety Division, Atomic Energy Regulatory Board, Anushaktinagar, Mumbai, 400094, India
eTheoretical Chemistry Section, Bhabha Atomic Research Centre, Mumbai-400 085, India
fHomi Bhabha National Institute (HBNI), Mumbai, India
First published on 22nd September 2021
Abstract
In this study we have explored Ca10(PO4)6F2 as host to develop a variety of phosphor materials with tunable emission and lifetime characteristics based on Eu3+ and Tb3+ as co-dopant ions and the energy transfer process involved with them. The energy transfer from the excited state of Tb3+ ion to the 5D0 state of Eu3+ makes it possible to tune the colour characteristics from yellow to orange to red. Further, such energy transfer process is highly dependent on the concentration of Eu3+ and Tb3+ ions and their site-selective distribution among the two different Ca-sites (CaO9 and CaO6F) available. We have carried out DFT based theoretical calculation for both Eu3+ and Tb3+ ions in order to understand their distribution. It was observed that in cases of co-doped sample, Tb3+ ions prefer to occupy the Ca2 site in the CaO6F network while Eu3+ ions prefer Ca1 site in the CaO9 network. This distribution has significant impact on the lifetime values and the energy transfer process as observed in the experimental photoluminescence lifetime values. We have observed that for the 1st series of compounds, wherein the concentration Tb3+ ions are fixed, the energy transfer from Tb3+ ion at Ca2 site to Eu3+ ion at Ca1 site is dominating (Tb3+@Ca2 → Eu3+@Ca1). However, for the 2nd series of compounds, wherein the concentration Eu3+ ions are fixed, the energy transfer process was found to occur from the excited Tb3+ ion at Ca1 site to Eu3+ ions at both Ca1 and Ca2 (Tb3+@Ca1 → Eu3+@Ca1 and Tb3+@Ca1 → Eu3+@Ca2). This is the first reports of its kind on site-specific energy transfer driven colour tunable emission characteristics in Eu3+ and Tb3+ co-doped Ca10(PO4)6F2 phosphor and it will pave the way for the future development of effective colour tunable phosphor materials based on a single host and same co-dopant ions.
1 Introduction
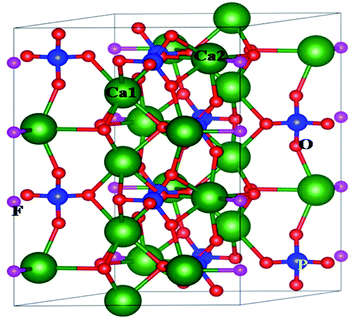
White light-emitting diodes (WLEDs), a new generation solid-state lighting system, are dominating today's lighting industry. WLEDs are environmentally benign in nature, long-lasting and offer significant energy savings compared to the earlier fluorescent or incandescent lamps, which are now being replaced by WLEDs worldwide.1–3 Most of the current commercial WLEDs are phosphor-converted (pc-WLEDs) using a combination of a blue LED chip and the yellow phosphor (Y3Al5O12:Ce3+). However, the lack of a red light emitting component makes the color-rendering index (CRI) lowers than 80.4 An alternative approach is to use an ultraviolet (UV) or near-UV LED chip combined with blue, green, and red phosphors, which may generate warm white light with high CRI value after a proper adjustment of the ratio of tricolour phosphors. In such cases it is desirable that all the three phosphors have similar thermal and chemical stability and a degradation of colour of any of the three phosphors will change the ratio of three colours and result in different light instead of white light. The crystal lattice of such host matrix should not degrade and there should not be any chemical reaction on the surface due to exposure to outer atmosphere. One of the best ways to overcome such problem is to develop blue, red and green phosphors based on the same host matrix and using similar activators (such as rare earth ion), which have high thermal and chemical stability. Therefore, development of colour tunable phosphor materials based on same host and dopant ion's composition would be a promising area of research work in the field of light emitting materials.Apatite based host matrices with general formula of M10[TO4]6Z2, where M is the cationic site with +1, +2 or +3 charges (e.g. K+, Na+, Ca2+, Sr2+, Ba2+, Pb2+, Mn2+, La3+, Y3+, Ce3+ etc.), and [TO4] represents anion group (e.g. SiO44−, PO43−, GeO44−, MnO44−, VO43−, AsO43−, SO44− etc.), and Z is anion with −1 or −2 charges (e.g. O2−, OH− and halogen ions), possess high chemical and thermal stability and considered as an efficient host to develop a variety of phosphor materials with high luminescence efficiency.5–7 Due to their high thermal, chemical and radiation stability such matrices are even potential candidate as host for immobilization of hazardous and highly radioactive nuclear waste.8,9 Among them the fluorapatite based compounds with formula M10(PO4)6F2, (where M = Ca, Sr, Ba etc.) is advantageous owing to their abundance and high strength and thermal stability. As shown in Fig. 1, there are two different types of cationic sites in the crystal structure of Ca10(PO4)6F2, namely the nine-fold coordinated Ca1 site in the [CaO9] polyhedron with C3 point symmetry and seven-fold coordinated Ca2 site in the [CaO6F] polyhedron with CS point symmetry. Existence of these two different cationic sites have resulted in different emission characteristics of the same rare earth ion,10 which indicates that for the development of colour tunable phosphor materials apatite based hosts are a favoured choice, wherein by changing the distribution of the rare earth ions one can generate a variety of colour.
Eu3+ and Tb3+ ions are the two widely used rare earth activators whose combined emissions covered a wide wavelength range in the blue-green-red region in the visible spectra. The 5D0 → 7Fj (j = 1, 2, 3 & 4) transitions of Eu3+ ions results in emissions in the orange and red region i.e. 580–700 nm.11 On the other hand Tb3+ ion has emission peaks around 540 nm and hence serves as a green center.12 The blue emission of Tb3+ ion in the 370–450 nm range is generally quenched through the cross-relaxation between neighbouring Tb3+ ions.13 However, owing to the efficient energy transfer from Tb3+ to Eu3+, co-doping Eu3+ and Tb3+ ions is found to be a successful strategy to develop a variety of phosphor materials with not only tunable colour characteristics in the blue-green-red region but also with tunable lifetimes values just by varying their respective concentration while keeping the host lattice intact.14–17
In present case we have chosen Ca10(PO4)6F2 as host matrix to explore such tunable color characteristics. The two different Ca-sites (CaO9 and CaO6F) available for the dopant ions (Eu3+ and Tb3+ ion) makes it more flexible to tune the colour characteristics from yellow to orange to red. It has also been found that the F atom in the Ca-2 site made a significant difference in the lifetime and luminescence efficiency since F atom has less quenching effect compared to O atom.8,9 Further, an energy transfer dynamics from Tb3+ ion to Eu3+ is associated with these compounds, which makes the tunable emission characteristics more exciting. Till date, no such study on site-specific energy transfer driven colour tunable emission characteristics in Ca10(PO4)6F2 is reported. Further, we have carried out density functional theory (DFT) based calculations in order to check the most favourable distribution of Eu3+ and Tb3+ ions among the two lattice sites available in Ca10(PO4)6F2 after considering a variety of possible substitutions. We have also considered the impact on any lattice ion vacancy on such distribution. We believe a comprehensive combined theoretical and experimental study on site-specific tunable colour characteristics and the associated lifetime values will pave the way for the future development of effective colour tunable phosphor materials based on a single host and same dopant ions.
2 Experimental
2.1. Synthesis of Eu3+ and Tb3+ co-doped Ca10(PO4)6F2 compounds
2.2. Instrumentation
The details of the instrumentation have been provided in ESI.†2.3. Computational details
All the spin polarized density functional theory (DFT) calculations have been carried out employing the projector augmented wave (PAW) based electronic structure code Vienna ab initio simulation (VASP).18,19 The set of valence states chosen in the present study for the pseudo potentials are Ca (3s23p64s2), Eu (6s25p65d1), Tb (6s25p65d1), P (3s23p2), F (2s22p5) and O (2s22p4). Perdew–Burke–Ernzerhof (PBE) functional within generalized gradient approximation (GGA) has been considered during the geometry optimization technique.20,21 Full relaxation of both cell parameter and ionic positions for all the model structures has been considered during geometry optimization process. The energy cut off for the expansion of electronic wave function has been kept fixed at 500 eV with self-consistent energy convergence of 10−6 eV throughout the calculations. Electronic structure calculations have been carried out using the optimized geometries. Monkhorst and Pack scheme has been adopted for generating Γ-centered k-point mesh during Brillouin zone sampling.22 To overcome the limitations of conventional density functional theory we have used hybrid functional as prescribed by Heyd, Scuseria, and Ernzerhof (HSE06) during electronic structure calculations,23 which has been shown to reproduce the experimental band gap of different semiconductor materials.24 According to the HSE06 functional the exchange-correlation functional is defined by short-ranged (SR) and long-ranged (LR) parts of exchange. Short-ranged part is described by both Hartree–Fock (HF) exact exchange functional (ESRX) and PBE exchange functional (EPBE,SRX), while the long-ranged part is completely treated by PBE exchange functional (EPBE,LRX) as| EHSEXC = aESRX(μ) + (1 − a)EPBE,SRX(μ) + EPBE,LRX(μ) + EPBEC | (1) |
3 Results and discussion
3.1. Phase purity and elemental analysis: X-ray diffraction (XRD) and X-ray fluorescence (XRF) study
The compounds obtained by solid-state reaction were characterized by X-ray diffraction technique. The obtained XRD of various Eu3+ and Tb3+ co-doped Ca10(PO4)6F2 compounds are shown in Fig. 2. All the compounds showed the characteristics XRD pattern of pure fluorapatite phase with ICDD file no. 01-070-8135. This has also confirmed that Eu3+ and Tb3+ ions were successfully substituted into lattice sites of calcium fluorapatite. The XRF spectra was recorded for Eu0.1Tb0.5:CPF and it is provided in the ESI,† which showed the peaks of Eu, Tb, Ca and P atoms at their respective energy position.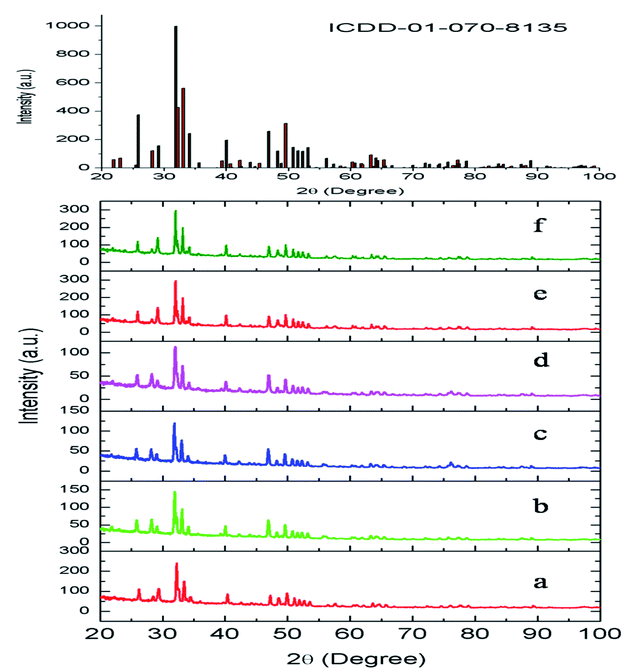 | ||
| Fig. 2 XRD pattern of (a) Eu0.3–Tb0.5:CPF, (b) Eu0.5–Tb0.1:CPF, (c) Eu0.5–Tb0.3:CPF (d) Eu0.5–Tb0.05:CPF, (e) Eu0.1–Tb0.5:CPF, (f) Eu0.5–Tb0.5:CPF. | ||
3.2. Fourier-transform infrared (FTIR) spectroscopy study
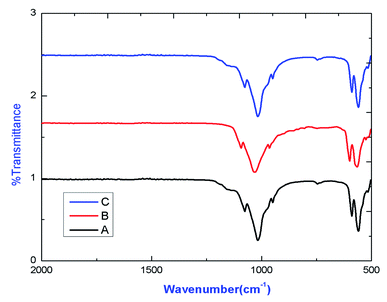
IR spectrum of various compounds are shown in Fig. 3, which confirmed the existence of characteristics stretching and bending frequencies of phosphate groups of apatite. The transmission deep exist around 1075.81 cm−1, 1024.17 cm−1, 948 cm−1, 589.5 cm−1 and 563 cm−1 are due to phosphate stretching vibration modes as reported earlier.83.3. Geometry and electronic structure
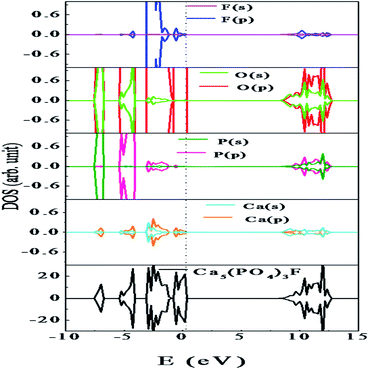
At room temperature, Ca10(PO4)6F2 shows a hexagonal crystal structure (Fig. 1) with space group symmetry P63/m (space group no. 176). Structural framework of Ca10(PO4)6F2 contains two different Ca lattice sites and three different O lattice sites whereas one type of lattice site for both P and F. The unit cell of Ca5(PO4)3F contains two formula units (i.e., 10 Ca, 6 P, 24 O, and 2 F). In can be noted that, the first type of Ca site (Ca1) is coordinated by nine O atoms, while second type of Ca site (Ca2) is coordinated by six O atoms and one F atoms.25 The calculated lattice parameter (a = b = 9.495 Å, and c = 6.918 Å) are found to be very close to the experimentally reported values (a = b = 9.3783 Å, and c = 6.8888 Å).26–29 This justifies the choice of the computational methodology. To investigate the electronic structure of Ca5(PO4)3F, we have analysed the density of states (DOS) and partial density of states (PDOS) (Fig. 4), which shows that the valence band maximum (VBM) is mainly composed of O 2p and F 2p states with small contribution of P (3p, 3s) and Ca (3p, 4s) states. On the other hand, the conduction band minimum (CBM) is dominated by P (3p, 3s) and F 2p states, with small contributions of Ca 4s state. The calculated band gap of Ca10(PO4)6F2 within HSE06 hybrid functional is found to be 7.26 eV, which is very close to the experimentally reported value of 7.21 eV for Ca5(PO4)3F.30| ΔHf = Edoped − Eperfect + q∑nxμx | (2) |
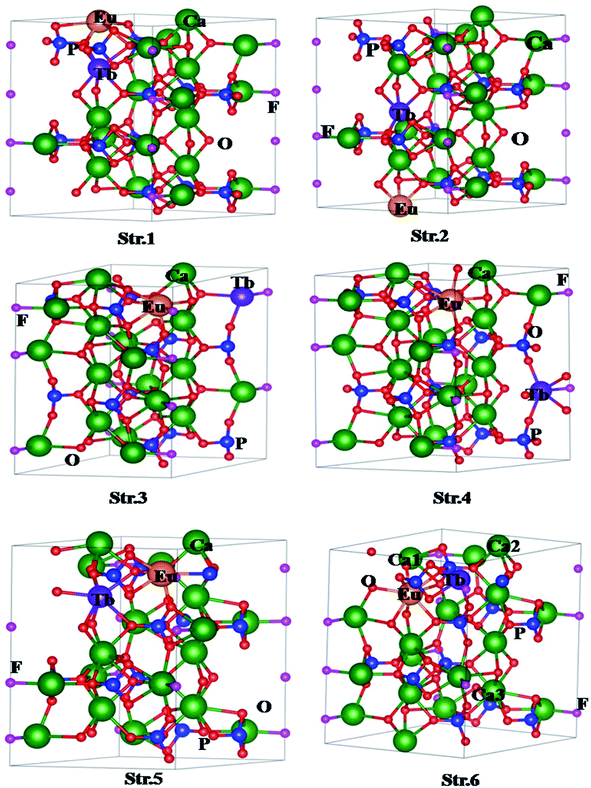 | ||
| Fig. 5 Structures of for (Eu3+, Tb3+) co-doped Ca10(PO4)6F2 with different configurations. The numbers in Str. 6 denote positions of Ca vacancies. | ||
The formation energies of the various structures are given in Table 1. Lower the formation energy, higher the thermodynamic stability of the system. It should be noted that Str. 1 is energetically less stable by 0.24 eV in comparison to the Str. 2. On the other hand, both Eu, and Tb occupy lattice sites of Ca2 type in case of Str. 3 (Eu, and Tb at 1st neighboring lattice sites of each other) and Str. 4 (Eu, and Tb at 2nd neighboring lattice sites of each other). It is interesting to note that Str. 3, and Str. 4 are energetically more stable by 0.40 eV with respect to that of Str. 1. However, both types of configurations in this case are energetically comparable to each other. Finally we have considered co-doping of Eu, and Tb involving both Ca1 and Ca2 types lattice sites, and generated two different structures viz. Str. 5 (Eu at Ca2 type site, while Tb at Ca1 type site) and Str. 6 (Eu at Ca1 type site, while Tb at Ca2 type site). Interestingly, Str. 5 and Str. 6 are energetically lower than the other four structures, and Str. 6 is found to be energetically most stable among all the possible structures considered in the present study. The calculated formation energy therefore follows the order, Str. 6 < Str. 5 < Str. 4 < Str. 3 < Str. 2 < Str. 1 while the stability of the structures follow the reverse order. This indicates that the Eu and Tb prefer different types of Ca lattice sites to form co-doped system. Since, both Eu and Tb normally exist in +3 states; there may be formation of Ca-vacancy in the co-doped system due to formation of charge compensated system. Therefore, we have also investigated the influence of Ca-vacancy on the electronic structure and properties of the codoped system. For this purpose, we have considered Str. 6, which is the lowest energy structure, and removed one Ca atom. In this case, we have considered three different structures by varying the position of Ca lattice site (indicated by Ca1, Ca2, Ca3 in Str. 6, Fig. 3). As for example, Str. 7 can be generated vacancy by removing Ca from the first neighbouring lattice of Eu (Ca1 in Str. 6, Fig. 3), Str. 8 from the second neighbouring lattice of both Eu and Tb (Ca3 in Str. 6, Fig. 3), and Str. 9 from the first neighbouring lattice of both Tb (Ca2 in Str. 6, Fig. 3). Interestingly, formation energy for Str. 7 has been found to be the lowest among the three (Table 1), indicating higher formation probability.
| Systems | Structures | Formation energy (eV) |
|---|---|---|
| (Eu, Tb)-codoped Ca10(PO4)6F2 | Str. 1 | 3.77 |
| Str. 2 | 3.53 | |
| Str. 3 | 3.16 | |
| Str. 4 | 3.15 | |
| Str. 5 | 1.19 | |
| Str. 6 | 1.10 | |
| (Eu, Tb)-codoped Ca10(PO4)6F2 with VCa | Str. 7 | 1.64 |
| Str. 8 | 2.64 | |
| Str. 9 | 1.27 |
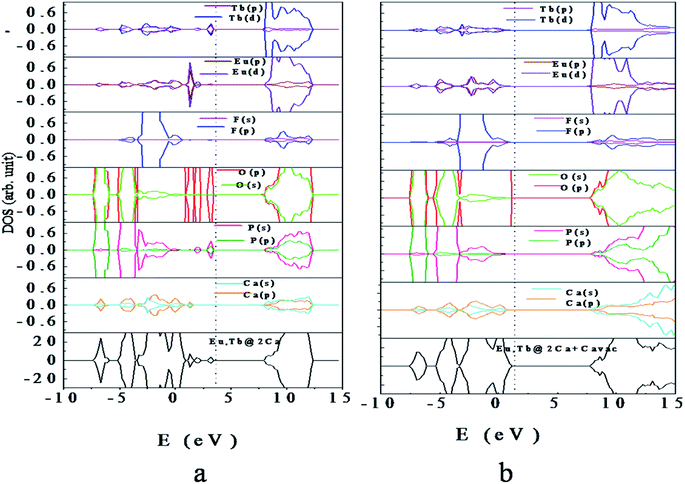 | ||
| Fig. 6 Density of states of (a) Eu, Tb-codoped Ca10(PO4)6F2 (b) Eu, Tb-codoped Ca10(PO4)6F2 with Ca vacancy. The vertical dashed line indicates the Fermi level. | ||
Interestingly, electronic structure for Eu3+ & Tb3+ co-doped Ca10(PO4)6F2 in presence of Ca-vacancy shows that the impurity states, as observed for (Eu, Tb)-codoped case, are completely disappear (Fig. 6b). This is due to the charge compensation system in presence of Ca-vacancy. Analysis of PDOS indicates that the VBM is mainly contributed by O (2p) states with minor contribution of F (2p) states, while the CBM is contributed by O (2s, 2p), P (3s, 3p), Eu (5d) and Tb (5d). Analysis of energy level indicates that the VBM is increased by 0.13 eV and CBM is decreased by 0.24 eV compared to that of perfect Ca10(PO4)6F2. The Fermi level is shifted towards the VBM by 2.28 eV with respect to that codoped system without Ca-vacancy. This is due to compensation of excess electron in presence of Ca-vacancy in the Eu3+ & Tb3+ co-doped Ca10(PO4)6F2.
3.4. Photoluminescence study
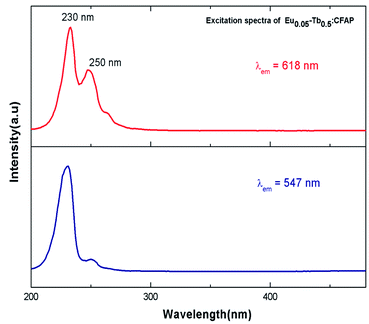
Fig. 7 represents the photoluminescence excitation spectra of Eu0.05–Tb0.5:CFP at 618 nm and 547 nm emission wavelengths. Two excitation bands peaking at 230 nm and 250 nm were observed for both the emission wavelengths, although their intensities are different. These transitions must be originate from the charge transfer transitions from 2p orbital of O2− to the vacant 5d orbital of Tb3+ and Eu3+ respectively. Since the 547 nm emission wavelength is due to transition of 5D4 → 7FF of the Tb3+ ion,33 the highly intense excitation peak at 230 nm can be attributed to the charge transfer transition from 2p orbital of O2− to the vacant 5d orbital of Tb3+. On the other hand at 618 nm emission wavelength, the peak intensity at 250 nm were found to be increased although 230 nm being the most intense one. The 250 nm excitation peak therefore can be attributed to the charge transfer transition from 2p orbital of O2− to the vacant 5d orbital of Eu3+.34 The fact that even in case of 618 nm emission wavelength, the excitation peak at 230 nm (which is due to Tb3+ ion) is present in the PLE spectrum is suggesting that there might a possibility of energy transfer from Tb3+ ion to Eu3+ ion.Fig. 8 represents the emission spectra of different Eu3+ and Tb3+ co-doped CFP compounds at 230 nm excitation wavelengths. The emission spectra consist of various emission peaks due to Eu3+ and Tb3+ ions. The emission peaks around 590, 618, and 704 nm are due to the 5D0 → 7Fj (j = 1, 2, 3 and 4) transitions of Eu3+ ion35 while the emission bands at 487, 547, 586 and 621 nm are due toTb3+ ion's 5D4 → 7Jj (j = 6, 5, 4, 3) transitions.33 As it is known that for Eu3+ ion, the emission at 590 nm (5D0–7F1 transition) is a magnetic dipole (MD) transition while the red color emission around 618 nm (5D0–7F2 transition) and at 704 nm (5D0–7F4 transition) are electric dipole (ED) transitions. The ED transition is hypersensitive to the local structure of Eu3+ ion and at an asymmetric environment, this transition is allowed one. The fact that ED transition's intensity is higher than the MD transition signifies that Eu3+ ion exists in an asymmetric environment.34 For Tb3+ ion, the green emission at 547 nm i.e. 5D4–7F5 is magnetic dipole (MD) transitions and not sensitive to local structure or crystal field strength. However, the blue emission i.e. 5D4–7F6 transition around 487 nm is an electric dipole (ED) transitions, which is sensitive to the local environment although it is not hypersensitive.33 We have calculated the respective color coordinates of various mol% of Eu3+ and Tb3+ co-doped CFP compounds at 230 nm excitation wavelengths as shown in Fig. 9. It can be seen that upon changing the concentration of any of the two dopant ion and keeping other dopant ion's concentration fixed, there is a change in color coordinated from yellow to orange to red. For the low dopant level of Eu3+ ion in Eu0.05–Tb0.5:CFP, the CIE color co-ordinates are placed in the yellow region while with increasing the concentration of Eu3+ ions, viz. in Eu0.1–Tb0.5:CFP and Eu0.3–Tb0.5:CFP, the color coordinates were shifted to orange and red regions. Similarly, by keeping the concentration of Eu3+ ion's fixed while varying the concentration of Tb3+ ions, the CIE color coordinates were found to be changed. It can be seen that with changing the concentration of Tb3+ ions viz. in Eu0.5–Tb0.1:CFP, Eu0.5–Tb0.2:CFP and Eu0.5–Tb0.3:CFP, the color can be tuned from orange to red. Therefore, a wide range of colored phosphors can be developed just by changing the relative concentration of Eu3+ and Tb3+ dopant ions.
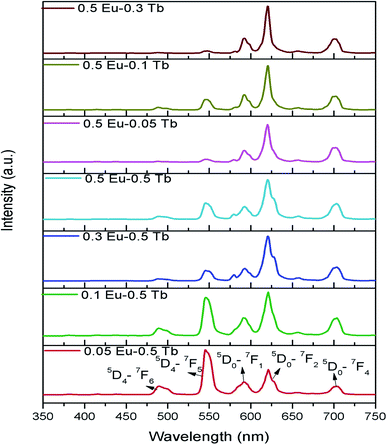 | ||
| Fig. 8 Emission spectra of various mol% of Eu3+ and Tb3+ co-doped CFP compounds at 230 nm excitation wavelengths. | ||
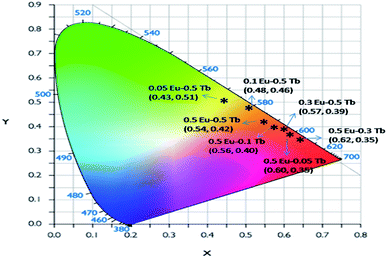 | ||
| Fig. 9 CIE colour coordinates of various mol% of Eu3+ and Tb3+ co-doped CFP compounds at 230 nm excitation wavelengths. | ||
Fig. 10a represents the emission spectra of different Eu3+ and Tb3+ co-doped CFP compounds at 250 nm excitation wavelengths, wherein we can see that the emission spectra for all the compounds are only consist of characteristics peaks of Eu3+ ions and that the peaks due to Tb3+ ions are very weak. This confirms that there is no charge transfer process involved at 250 nm excitation and that the 250 nm excitation peak is purely due to charge transfer transition from 2p orbital of O2− to the vacant 5d orbital of Eu3+ ion.
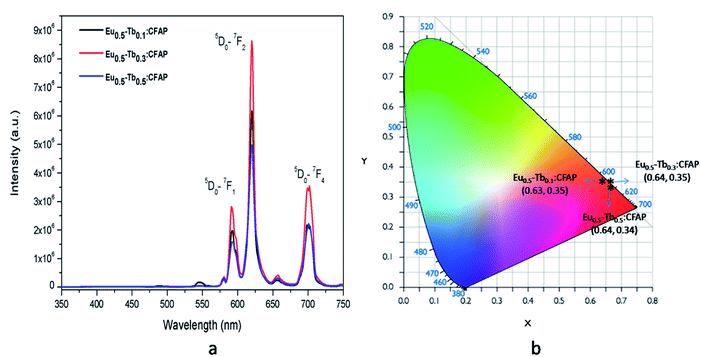 | ||
| Fig. 10 Emission spectra of various mol% of Eu3+ and Tb3+ co-doped CFP compounds at 250 nm excitation wavelengths and their respective CIE colour coordinates. | ||
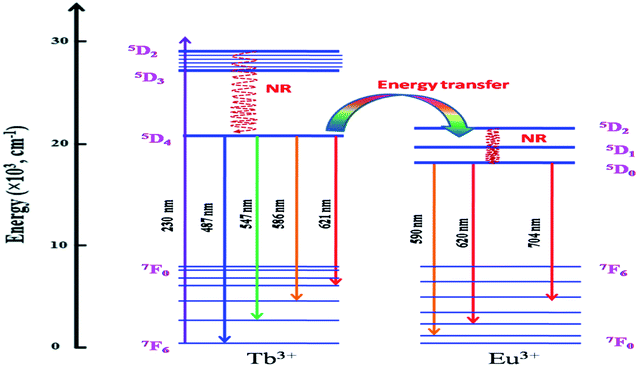
It is worth mentioning here that these color tunable characteristics have been observed for 230 nm excitation wavelength only and for 250 nm excitation energy there is no such color tunable characteristics and all the compounds are red phosphor in nature as suggested by their calculated color coordinates represented in Fig. 10b. Therefore, the energy transfer dynamics from Tb3+ ion to Eu3+ ion at 230 nm excitation is solely responsible for such tunable color characteristics.14–17 As shown in Fig. 11, upon 230 nm excitation (which is due to CT transition from O2− to the vacant 5d orbital of Tb3+ ion) many Tb3+ ions are excited to higher energy CT state from which it come back to the lower energy level 5D3 and then to lower lying 5D4 meta-stable state through non-radiative pathway. From 5D4 level it is relaxed to lower energy levels through 5D4–7F5,4,3 transitions. Few other Tb3+ ions at 5D3 or 5D4 levels transfer their energy to the 5D2 level of Eu3+ ion which is known as the energy transfer. Now through a non-radiative decay from 5D2 excited state the population of 5D0 meta-stable state increases which results in emission through 5D0–7FJ (J = 0–6) transitions.
The fact that with increasing the Tb3+ concentration there is an enhancement of Eu3+ ion's intensity while keeping it concentration unchanged as shown in Fig. 8, clearly indicates that there is a charge transfer process involved from Tb3+ ions to Eu3+ ion. Generally, the energy transfer from sensitizer (Tb3+) to activator (Eu3+) may takes place through either (i) the exchange interaction or (ii) electric multipolar transition. When the critical distance between the sensitizer and activator is shorter than 5 Å, then the energy transfer process use to take place via exchange interaction and when it is greater than 5 Å, the energy transfer from Tb3+ to Eu3+ ions happen in the way of electric multipolar interaction. The critical distance (Rc) between Tb3+ and Eu3+ can be calculated using eqn (3)14,36
 | (3) |
Now let us see how the lifetime of the respective excited states of the Tb3+ ions to Eu3+ ions behave while changing their concentration and the excitation energy. This will also provide information about the energy transfer mechanism.
3.5. Photoluminescence lifetime study
PL lifetime measurements can provide detail information regarding the energy transfer dynamics in addition to the lattice site occupancy of the dopant ions.14–17 Since, there are two lattice sites (Ca1 and Ca2 sites) available for the dopant ions and as we have observed from DFT based calculation that the distribution of Eu3+ and Tb3+ among these two lattice sites are different, it will be interesting to see which sites are involved in the energy-transfer dynamics? The photoluminescence lifetime measurement has been carried out for all the compounds at 230 nm excitation wavelength (which is attributed to Tb3+ ions) and with emission wavelength 547 nm (5D4–7F5 transition of Tb3+ ion) and 618 nm (5D0–7F2 transition of Eu3+ ions) as shown in Fig. 12. We have observed that the decay profiles (both at 547 nm and 618 nm emission wavelength) for all the compounds followed a bi-exponential eqn (4).
 | (4) |
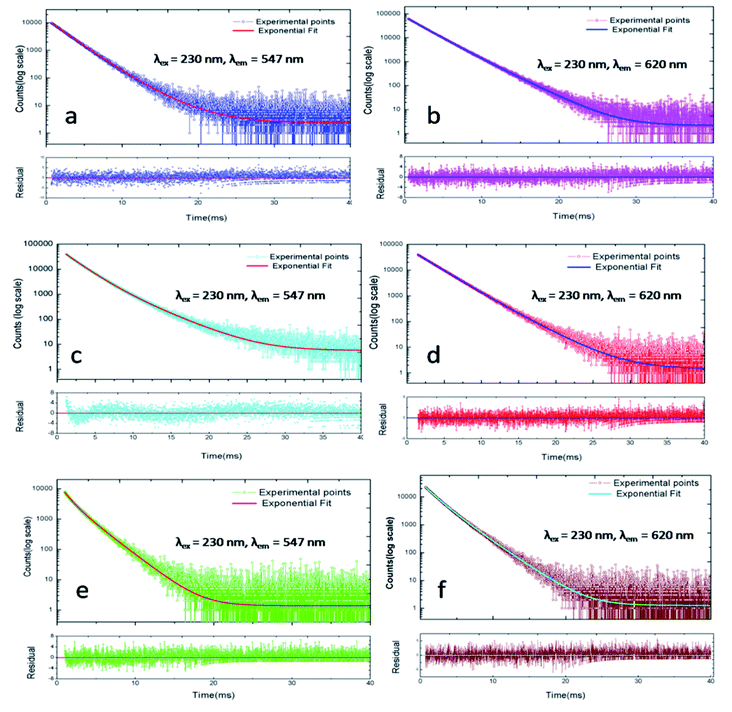 | ||
| Fig. 12 Photoluminescence decay profile at λex = 230 nm and λem = 547 nm & 620 nm for different Eu3+ and Tb3+ doped CFP compounds. (a and b) Eu0.5–Tb0.01:CFP; (c and d) Eu0.5–Tb0.1:CFP; (e and f) Eu0.3–Tb0.5:CFP (few spectra of other compounds are provided in the ESI†). | ||
We have also calculated the percentage of a specific life-time using the formula in eqn (5)
 | (5) |
The lifetime values are included in Table 2 for all the compounds at different emission wavelength. As mentioned before that due to the availability of two different Ca-sites (CaO9 and CaO6F); both Eu3+ and Tb3+ ions have a tendency to be distributed among the two lattice sites. Earlier, we have observed that the lifetime value for rare earth ion when placed at the Ca2 site (CaO6F) which has an F-atom linkage, is more than when it is placed at Ca1 site (CaO9). This is attributed to the F-atom, which has less quenching effect on the excited state and makes the lifetime value of the rare earth ions higher.8,9 Therefore, the long lived component observed at 547 nm emission wavelength is due to Tb3+ ions present at Ca2 site while that at 618 nm emission is due to Eu3+ ions present at Ca2 site. On the other hand, the short-lived components for these two emission wavelength are due to Tb3+ and Eu3+ ions present at the Ca1 site, which has no F-atom linkage.
| Compound | PL lifetime components of Tb3+ (λex = 230 nm and λem = 547 nm) | PL lifetime components of Eu3+ (λex = 230 nm and λem = 618 nm) | ||
|---|---|---|---|---|
| Short-lived (τ1) component in μs | Long-lived (τ2) component in μs | Short-lived (τ1) component in μs | Long-lived (τ2) component in μs | |
| Eu0.5–Tb0.01:CFP | 2191.98 (90%) | 4054.92 (10%) | 2168.83 (59%) | 2992.06 (41%) |
| Eu0.5–Tb0.1:CFP | 1867.70 (70%) | 3601.64 (30%) | 2423.43 (89%) | 3673.61 (11%) |
| Eu0.5–Tb0.3:CFP | 1966.44 (86%) | 3379.12 (14%) | 2439.29 (93%) | 3739.46 (7%) |
| Eu0.1–Tb0.5:CFP | 1384.55 (35%) | 2754.84 (65%) | 2098.41 (67%) | 3333.81 (33%) |
| Eu0.3–Tb0.5:CFP | 952.79 (28%) | 2203.12 (72%) | 1477.1 (45%) | 2527.96 (55%) |
| Eu0.5–Tb0.5:CFP | 651.77 (24%) | 2216.65 (76%) | 1934.22 (45%) | 2807.46 (55%) |
| Na+2Eu3+2:Ca6(PO4)6F2 (ref. 8) | — | — | 1870 (23%) | 2420 (77%) |
However, we have observed from our DFT calculation earlier that the stability of the Eu3+ and Tb3+ co-doped structure is more when Eu3+ ion is distributed at Ca1 site and Tb3+ ion at Ca2 site. The preference of distribution of Eu3+ ion is also reflected in the higher percentage of the short-lived component in many compounds viz. Eu0.5–Tb0.01:CFP, Eu0.5–Tb0.1:CFP, Eu0.5–Tb0.3:CFP, Eu0.1–Tb0.5:CFP. However, for Tb3+ ions such observation (higher percentage of the long-lived component) is not observed since the lifetime value of Tb3+ ions also depends on the energy transfer dynamics from Tb3+ ion to Eu3+ ion, which will decrease the percentage of contribution. The fact that there is an energy transfer process involved in this class of compounds can be explained based on decrease in lifetime value upon varying the concentration of Tb3+ ion or Eu3+ ion. Due to the energy transfer from the excited state of Tb3+ ion to the Eu3+ ion, the lifetime value of Tb3+ ion will be decreased, as observed earlier for various class of compounds.14–17 The lifetime values of Eu3+ ion obtained for the Eu & Tb co-doped compounds in this work are found to be slight higher than that for pure Eu3+ doped CFP compounds reported earlier.8 This might be due to the energy transfer process involved in the present compounds. The fact that we have not seen a monotonic decrease or increase for few samples may be explained based on non-radiative pathways associated with various defect centers or vacancies, which also plays an important role in determining the lifetime of the excited state. These vacancies are generated due to the charge imbalance when Tb3+ or Eu3+ ions are substituted at a place of Ca2+ ion. The additional positive charge will lead to creation of negatively charged vacancies, which will have impact on the nearby Tb3+/Eu3+ ion's local structure. Further, depending on the distance from the Tb3+/Eu3+ ion, the impact will be different. We believe such vacancies are the main reason to not have any systematic decrease in the lifetime values for few samples.
Now let us consider two cases; (1) for the series of compounds where the concentration Eu3+ ion is fixed but that of Tb3+ ions is varied viz. for Eu0.5–Tb0.01:CFP, Eu0.5–Tb0.1:CFP and Eu0.5–Tb0.3:CFP compounds, and (2) for the series of compounds where the concentration Tb3+ ion is fixed but that of Eu3+ ions is varied viz. Eu0.1–Tb0.5:CFP, Eu0.3–Tb0.5:CFP and Eu0.5–Tb0.3:CFP. For the 1st series of compounds wherein the concentration of Tb3+ ion is varied, it is observed that the percentage of the long-lived Tb3+ component is small than its short-lived component. This is due to fact that the long-lived Tb3+ component at the Ca2 site mostly transfers its energy to nearby Eu3+ ions. Hence in this series, majority of the Tb3+ ions at Ca2 site are preferably taking part in the energy transfer dynamics and results in small contribution towards its radiative lifetime value and the radiation transition. Now for the second series of compound wherein the concentration of Tb3+ ion is fixed but that of Eu3+ ion is varied, the opposite thing has happened i.e. the percentage of the short-lived Tb3+ component is less than the long-lived component. Hence, we believe that for this series of compounds, majority of the Tb3+ ions at Ca1 site are preferably taking part in the energy-transfer process to Eu3+ ion. Now if we consider the lifetime values of Eu3+ ions, then for the 1st series compound the percentage of contribution of the short-lived Eu3+ component at Ca1 site is higher than that at Ca2 site. Further, with increasing the concentration of Tb3+ ion, the percentage of contribution of this short-lived component is found to increase. We have already concluded from DFT calculation that for Tb3+ and Eu3+ co-doped system, Eu3+ ions most preferably go to the Ca1 site and results in smaller lifetime value. Since there is no energy transfer process involved from the excited state of Eu3+ ions to other co-dopant ion, this percentage of contribution is linked to the contribution from Eu3+ ions at Ca1 and Ca2 sites to the overall red light emission. Therefore, after considering all these changes in the relative contribution, we conclude that for the 1st series of compound the energy transfer from Tb3+ ion at Ca2 site to Eu3+ ion at Ca1 site (Tb3+@Ca2 → Eu3+@Ca1) is the dominant one. Interestingly, for the 2nd series of compounds wherein the concentration of Tb3+ ion is fixed, we have not observed much difference in the respective contribution of two different Eu3+ components and for the higher concentration of Eu3+ in compound like Eu0.5–Tb0.5:CFP, the percentage is a bit higher for the long-lived Eu3+ component. Therefore, we may conclude that for the 2nd series of compounds, the energy transfer process from the excited Tb3+ ion at Ca1 site to Eu3+ ions at both Ca1 and Ca2 sites (Tb3+@Ca1 → Eu3+@Ca1 and Tb3+@Ca1 → Eu3+@Ca2) is happening with a bit more preference towards the Eu3+ ion at Ca2 site (Tb3+@Ca1 → Eu3+@Ca2).
4 Conclusion
Various Eu3+ and Tb3+ co-doped Ca10(PO4)6F2 compounds were synthesized by solid-state reaction method. Photoluminescence study showed that with varying the concentration of Tb3+ and Eu3+ ions, the colour characteristics can be tuned from yellow to orange to red. We have found that there is an energy transfer process involved from Tb3+ ion to Eu3+ , which is responsible for the tunable emission characteristics and the decay kinetics. It was observed that two different lifetime components exist for both Eu3+ and Tb3+ ions depending on their distribution among the two different Ca-sites (Ca1 in CaO9 and Ca2 in CaO6F network). The long-lived component for both the dopant ions are attributed to Ca2 site in CaO6F network, wherein the F atom made the difference in lifetime of the excited state due to less quenching effect compared to O-atom. From density functional theory (DFT) based calculations we have observed that Tb3+ ions prefer to go to the Ca2 site while Eu3+ ions prefer the Ca site, when they are co-doped in Ca10(PO4)6F2 in a structure associated Ca vacancy. This site specific distribution was found to influence the energy transfer dynamics. It has been observed from the lifetime study that for the 1st series of compounds, wherein the concentration Tb3+ ions are fixed, the energy transfer Tb3+@Ca2 → Eu3+@Ca1 energy transfer is more preferable than Tb3+@Ca1 → Eu3+@Ca2. However, for the 2nd series of compounds, wherein the concentration Eu3+ ions are fixed, both the energy transfer processes Tb3+@Ca1 → Eu3+@Ca1 and Tb3+@Ca1 → Eu3+@Ca2 were involved with a bit more preference for Tb3+@Ca1 → Eu3+@Ca2.Author contributions
Nimai Pathak: conceptualization, methodology, supervision, visualization, photoluminescence investigation, data analysis of all the experiments, writing-initial draft, reviewing and editing.Bhagyalaxmi Chundawat: preparation of all the compound and XRD measurement.
Pratik Das: helping in preparation of compounds and FTIR measurement.
Pampa Modak: writing and helping in the theoretical study.
Brindaban Modak: VASP simulation and theoretical data analysis.
Conflicts of interest
There are no conflicts to declare.Acknowledgements
The authors acknowledge the contribution of Dr B. G. Vats FCD, BARC for his help in FTIR measurements and Dr K. Sanyal, FCD, BARC for the XRF measurement during the course of this project. Authors are also grateful to Dr P. K. Pujari, Group director, Radiochemistry and Isotope group for his encouragement and help during the course of this project. No external funding agency is involved with this work and the work is completely funded by BARC.References
- Q. Zhou, L. Dolgov, A. M. Srivastava, L. Zhou, Z. Wang, J. Shi, M. D. Dramićanin, M. G. Brik and M. Wu, J. Mater. Chem. C, 2018, 6, 2652–2671 RSC.
- M. Xin, D. Tu, H. Zhu, W. Luo, Z. Liu, P. Huang, R. Li, Y. Cao and X. Chen, J. Mater. Chem. C, 2015, 3, 7286–7293 RSC.
- E. F. Schubert and J. K. Kim, Science, 2005, 308, 1274–1278 CrossRef CAS PubMed.
- A. A. Setlur, W. J. Heward, Y. Gao, A. M. Srivastava, R. G. Chandran and M. V. Shankar, Chem. Mater., 2006, 18, 3314–3322 CrossRef CAS.
- N. Liu, L. Mei, L. Liao, J. Fu and D. Yang, Sci. Rep., 2019, 9, 15509 CrossRef PubMed.
- G. Li, D. Geng, M. Shang, Y. Zhang, C. Peng, Z. Cheng and J. Lin, J. Phys. Chem. C, 2011, 115, 21882–21892 CrossRef CAS.
- H. Liu, L. Liao, M. S. Molokeev, Q. Guo, Y. Zhang and L. Mei, RSC Adv., 2016, 6, 24577–24583 RSC.
- (a) P. Das, N. Pathak, P. Modak and B. Modak, J. Hazard. Mater., 2021, 411, 125025 CrossRef CAS PubMed; (b) N. Pathak, P. Das, B. Chundawat, P. Modak and B. Modak, J. Hazard. Mater., 2021, 423, 126980 CrossRef PubMed.
- P. Das, N. Pathak, B. Sanyal, S. Dash and R. M. Kadam, J. Alloys Compd., 2019, 810, 151906 CrossRef CAS.
- S. Unithrattil, H. J. Kim, K. H. Gil, N. H. Vu, V. H. Hoang, Y. H. Kim, P. Arunkumar and W. B. Im, Inorg. Chem., 2017, 56, 5696–5703 CrossRef CAS PubMed.
- (a) S. K. Gupta, P. S. Ghosh, N. Pathak and R. M. Kadam, RSC Adv., 2016, 6, 42923–42932 RSC; (b) M. Sahu, N. Pathak and M. K. Saxena, RSC Adv., 2021, 11, 17488–17497 RSC.
- X. Yan, G. R. Fern, R. Withnall and J. Silver, Nanoscale, 2013, 5, 8640–8646 RSC.
- P. Van Do, N. X. Ca, L. D. Thanh, N. Van Nghia and T. T. C. Thuy, Phys. Chem. Chem. Phys., 2020, 22, 27590–27599 RSC.
- R. Mi, J. Chen, Y.-g. Liu, M. Fang, L. Mei, Z. Huang, B. Wang and C. Zhaob, RSC Adv., 2016, 6, 28887–28894 RSC.
- Y. Gao, X. Sun, Z. Feng, L. Zhu, J. Zhang, W. Gao, X. Zhou, R. Cong and T. Yang, New J. Chem., 2017, 41, 2037–2045 RSC.
- B. Zhang, H. Zou, H. Guan, Y. Dai, Y. Song, X. Zhou and Y. Sheng, CrystEngComm, 2016, 18, 7620–7628 RSC.
- M. Yang, Y. Liang, Q. Gui, B. Zhao, D. Jin, M. Lin, L. Yan, H. You, L. Dai and Y. Liu, Sci. Rep., 2015, 5, 11844 CrossRef CAS PubMed.
- G. Kresse and D. Joubert, Phys. Rev. B: Condens. Matter Mater. Phys., 1999, 59, 1758–1775 CrossRef CAS.
- P. E. Blöchl, Phys. Rev. B: Condens. Matter Mater. Phys., 1994, 50, 17953–17979 CrossRef PubMed.
- J. P. Perdew, J. A. Chevary, S. H. Vosko, K. A. Jackson, M. R. Pederson, D. J. Singh and C. Fiolhais, Phys. Rev. B: Condens. Matter Mater. Phys., 1992, 46, 6671–6687 CrossRef CAS PubMed.
- J. P. Perdew, K. Burke and M. Ernzerhof, Phys. Rev. Lett., 1996, 77, 3865–3868 CrossRef CAS PubMed.
- H. J. Monkhorst and J. D. Pack, Phys. Rev. B: Solid State, 1976, 13, 5188–5192 CrossRef.
- J. Paier, M. Marsman, K. Hummer, G. Kresse, I. C. Gerber and J. G. Angyán, J. Chem. Phys., 2006, 124, 154709 CrossRef CAS PubMed.
- B. Modak and S. K. Ghosh, Phys. Chem. Chem. Phys., 2018, 20, 20078–20087 RSC.
- V. Louis-Achille, L. De Windt and M. Defranceschi, Comput. Mater. Sci., 1998, 10, 346 CrossRef CAS.
- P. H. J. Mercier, Z. Dong, T. Baikie, Y. Le Page, T. J. White, P. S. Whitfield and L. D. Mitchel, Acta Crystallogr., 2007, 63, 37–48 CAS.
- L. Calderín, M. J. Stott and A. Rubio, Phys. Rev. B: Condens. Matter Mater. Phys., 2003, 67, 134106 CrossRef.
- P. Rulis, L. Z. Ouyang and W. Y. Ching, Phys. Rev. B: Condens. Matter Mater. Phys., 2004, 70, 155104 CrossRef.
- C.-X. Li, Y.-H. Duan and W.-C. Hu, J. Alloys Compd., 2015, 619, 66–77 CrossRef CAS.
- Q. Zeng, H. Liang, G. Zhang, M. D. Birowosuto, Z. Tian, H. Lin, Y. Fu, P. Dorenbos and Q. Su, J. Phys.: Condens. Matter, 2006, 18, 9549–9560 CrossRef CAS.
- P. Modak and B. Modak, Phys. Chem. Chem. Phys., 2020, 22, 16244–16257 RSC.
- B. Modak, P. Modak and S. K. Ghosh, J. Phys. Chem. C, 2017, 121, 12980–12990 CrossRef CAS.
- M. Sen, R. Shukla, N. Pathak, K. Bhattacharyya, V. Sathian, P. Chaudhury, M. S. Kulkarni and A. K. Tyagi, Mater. Adv., 2021, 2, 3405–3419 RSC.
- (a) R. Phatak, N. Pathak, S. Muhammed, S. K. Sali and A. Das, ChemPlusChem, 2018, 83, 1144–1152 CrossRef CAS PubMed; (b) R. Phatak, N. Pathak, S. Muhammed, A. Das and S. K. Sali, J. Am. Ceram. Soc., 2020, 103, 2617–2629 CrossRef CAS; (c) N. Pathak, S. Mukherjee, D. Das and D. Dutta, J. Alloys Compd., 2021, 887, 161414 CrossRef CAS.
- (a) N. Pathak, S. Mukherjee, B. P. Mandal, A. K. Yadav, S. N. Jha and D. Bhattacharyya, Mater. Adv., 2020, 1, 2380–2394 RSC; (b) N. Pathak, P. S. Ghosh, S. Mukherjee and B. P. Mandal, RSC Adv., 2020, 10, 31070–31086 RSC; (c) N. Pathak, S. Mukherjee, D. Das, D. Dutta, S. Dash and R. M. Kadam, J. Mater. Chem. C, 2020, 8, 7149–7161 RSC; (d) S. Mukherjee, N. Pathak, D. Das and D. Dutta, RSC Adv., 2021, 11, 5815–5831 RSC; (e) D. Hebbar, K. S. Choudhari, N. Pathak, S. A. Shivashankar and S. D. Kulkarni, J. Alloys Compd., 2018, 768, 676–685 CrossRef; (f) K. Sanyal, N. Pathak, A. K. Yadav, B. Kanrar, R. M. Kadam, S. N. Jha, D. Bhattacharya and N. L. Misra, Dalton Trans., 2016, 45, 7650–7664 RSC; (g) S. K. Gupta, P. S. Ghosh, N. Pathak and R. M. Kadam, RSC Adv., 2016, 6, 42923–42932 RSC; (h) D. Hebbar, K. S. Choudhari, N. Pathak, S. A. Shivashankar and S. D. Kulkarni, Mater. Res. Bull., 2019, 119, 110544 CrossRef; (i) S. K. Gupta, N. Pathak and R. M. Kadam, J. Lumin., 2016, 169, 106–114 CrossRef CAS; (j) S. K. Gupta, K. S. Prasad, N. Pathak and R. M. Kadam, J. Mol. Struct., 2020, 1221, 128776 CrossRef CAS.
- S. K. Gupta, N. Pathak, S. K. Thulasidas and V. Natarajan, J. Lumin., 2016, 169, 669–673 CrossRef CAS.
Footnote |
| † Electronic supplementary information (ESI) available. See DOI: 10.1039/d1ra04941k |
| This journal is © The Royal Society of Chemistry 2021 |

