 Open Access Article
Fluorescent N-functionalized carbon nanodots from carboxymethylcellulose for sensing of high-valence metal ions and cell imaging†
Zhenzhen
Liu
c,
Runsen
Li
c,
Yan
Li
c,
Jingpeng
Zhou
d,
Yumei
Gong
 c,
Haiqiang
Shi
c,
Yanzhu
Guo
c,
Haiqiang
Shi
c,
Yanzhu
Guo
 *abcd,
Haiming
Li
*c,
Zhiwei
Wang
*a and
Fengshan
Zhang
d
aGuangxi Key Laboratory of Clean Pulp & Papermaking and Pollution Control, School of Light Industry and Food Engineering, Guangxi University, Nanning, 530004, China. E-mail: wangzhiwei@gxu.edu.cn
bState Key Laboratory of Pulp and Paper Engineering, South China University of Technology, Guangzhou, 510641, China
cLiaoning Key Laboratory of Pulp and Paper Engineering, Dalian Polytechnic University, Dalian, 116034, China. E-mail: lihm@dlpu.edu.cn; guoyz@dlpu.edu.cn; Tel: +86-15164033963
dShandong Huatai Paper Co., Ltd., Dongying, 275335, China
First published on 28th October 2021
Abstract
A convenient and sensitive reversible-fluorescence sensing platform for accurate monitoring of high-valence metal ions is still very challenging. As a green kind of fluorescent carbon nanomaterials, carbon dots (CDs) have captured considerable attention because of the stable fluorescence property and low cost. Herein, we fabricated a type of nitrogen-functionalized carbon dots (N-CDs) from CMC as a fluorescent reversible sensing platform for detecting various high-valence metal ions. N-CDs with a mean size of 2.3 nm were obtained and possessed 22.9% quantum yields (QY). A label-free fluorescent probe for detection of high-valence metal ions (Fe3+, Cr6+, Mn7+) was established via the fluorescence quenching response. Among them, the detection limit (LOD) toward Fe3+ ions reached 0.8 µM. We have explored the quenching mechanism of N-CDs to explain the valence state-related electron-transfer fluorescence quenching between high-valence metal ions and N-CDs. Moreover, the valence state-related fluorescence quenching phenomenon of N-CDs in aqueous solution could be effectively recovered by introducing a reducing agent (Ti3+). This “turn off-on” fluorescence recovery system of N-CDs could be applied in different applications covering the selective detection of environmental high-valence metal ions and cellular imaging.
1. Introduction
Heavy metal ions are potentially toxic metal elements that affect human physical health. Due to the growth of anthropic activity and rapid modern development, the presence of heavy metal ions (Cr6+ and Mn7+), which are released from heavy metal-using industrial plants in processes such as the tanning of leather, electroplating and pigment production, has undergone a sharp increase over a period of years. In addition, Fe3+ ions, as an important trace element in the human body, are involved in various biological reactions in the body, e.g., oxygen transport, energy conversion, enzyme catalysis and metabolism regulation.1 The contents of such essential ions in the body must be maintained at an appropriate level, and any lack or excess of them can lead to human disease or biological toxicity.2 Therefore, it is a critical issue to dig out economical and accurate methods for selective detection of metal ions, aiming to alleviate environmental pollution and protect human health. To date, various techniques for detecting metal ions include but are not limited to atomic absorption/emission spectroscopy, electrochemical analysis, spectrophotometric analysis, liquid chromatography, and adsorptive stripping voltammetry.3–9 These analytical approaches, however, require complex equipment, high operating costs, tedious preparation and time-consuming procedures. Thus, it is urgent to select an economical and effective analytical method for metal ion detection in aqueous solution.CDs have been intensively studied since they were discovered occasionally in 2004.10 Relative to traditional quantum dots and organic dyes,11 CDs usually exhibit high fluorescence intensity, non-toxicity, excellent water solubility, chemical resistance, outstanding electronic properties and excellent biocompatibility.12–15 These unique properties have enabled CDs to be widely applied in promising fields of sensors, metal ions detection, bio-imaging, drug delivery and light emitting diodes.16–22 Among of them, the applications of CDs as fluorescence sensors for detecting and monitoring of metal ions have been studied. Furthermore, fluorescence quenching-recovery analysis has already been confirmed as the promising methods for metal ions detection due to its favorable advantages, such as stable fluorescence, good selectivity, convenient and quick response.23,24
Owing to instant fluorescence response and excellent chemical activity, CDs-based fluorescence sensors, derived from various precursors, have been becoming more useful in selective and sensitive sensing platforms. Wang et al.25 demonstrated that the photoexcited CDs can photoreduce the Ag+ to Ag in aqueous solution, suggesting that the photoexcited CDs were excellent electron donors as well as electron acceptors. Other literatures reported some common metal ions, such as Fe3+,26,27 Hg2+,28 Cu2+,29 As3+,30 Pb2+,31,32 Zn2+,33 Au3+,34 could also selectively quench the fluorescence of CDs in the certain sensing systems. However, the sensitivity improvements for the CDs fluorescence quenching sense have been merely applied in one metal ion, which greatly limit their detection capability. Meanwhile, it was found that the detailed discussion on the fluorescence quenching mechanism of CDs had seldom been explored. Particularly, developing the deep explanations on the high-valence metal ions, which can result to obvious fluorescence quenching response of CDs compared with low-valence metal ions. There is a challenge to explore the phenomenon between different fluorescence quenching behaviors of CDs to diverse target metal ions. Consequently, the first aim of this work is that establishing the detailed fluorescence quenching mechanism between N-CDs and high-valence metal ions, because there still lacks detailed discussion on the quenching mechanism related to the high valence-state of metal ions and carbon dots in the current study. Secondly, it is practical significance to develop a multifunctional fluorescence sensing platform that satisfies simple operation, high sensitivity, and for high-valence metal ions detection in complex environment.
In this paper, we build a green approach for preparation N-CDs based on hydrothermal treatment of water-soluble CMC with EDA as exterior nitrogen-doping passivator. N-CDs with excellent blue fluorescence were obtained and possessed water dispersibility, good photostability, and a low level of cytotoxicity. The N-CDs aqueous solution served as the green fluorescence sensing probe to monitor the high-valence metal ions (Fe3+, Cr6+ and Mn7+) by fluorescence quenching response. Meanwhile, we further explored the quenching phenomenon of N-CDs to explain valence state-related electron-transfer between N-CDs and high-valence metal ions. Interestingly, the valence state-related fluorescence quenching phenomenon of N-CDs aqueous solution could be effectively recovered by introducing reducing agent (Ti3+). In addition, using the selectively fluorescence quenching behavior to Fe3+ as an example, the N-CDs were investigated on cellular imaging. These fluorescence recovery systems of N-CDs possessed fluorescence analytic prospect for high-valence metal ions sensing and biomedical.
2. Experimental
2.1 Materials
Carboxymethylcellulose (CMC, M. W. 90![[thin space (1/6-em)]](https://www.rsc.org/images/entities/char_2009.gif) 000, 250
000, 250![[thin space (1/6-em)]](https://www.rsc.org/images/entities/char_2009.gif) 000, 700
000, 700![[thin space (1/6-em)]](https://www.rsc.org/images/entities/char_2009.gif) 000 g mol−1), 1,2-propanediamine and 1,6-hexamethylenediamine were procured from Aladdin Chemistry Co., Ltd. Ethylenediamine (EDA, 99% purity) was purchased from Kermel Analytical Reagent Co., Ltd. CrCl3·6H2O, MgCl2, AgNO3, KCl, MnCl2·4H2O, NaCl, ZnCl2, BaCl2·2H2O, AlCl3, FeCl3·6H2O, CuCl2·2H2O, CaCl2, FeCl2·4H2O were obtained from Sinopharm Chemical Reagent Co., Ltd. K2CrO4, K2Cr2O7, KMnO4, TiCl3, glutathione (GSH), ascorbic acid, SnCl4 and hydroxylamine hydrochloride were supplied by Macklin Biochemical Co., Ltd.
000 g mol−1), 1,2-propanediamine and 1,6-hexamethylenediamine were procured from Aladdin Chemistry Co., Ltd. Ethylenediamine (EDA, 99% purity) was purchased from Kermel Analytical Reagent Co., Ltd. CrCl3·6H2O, MgCl2, AgNO3, KCl, MnCl2·4H2O, NaCl, ZnCl2, BaCl2·2H2O, AlCl3, FeCl3·6H2O, CuCl2·2H2O, CaCl2, FeCl2·4H2O were obtained from Sinopharm Chemical Reagent Co., Ltd. K2CrO4, K2Cr2O7, KMnO4, TiCl3, glutathione (GSH), ascorbic acid, SnCl4 and hydroxylamine hydrochloride were supplied by Macklin Biochemical Co., Ltd.
2.2 Preparation of N-CDs
Typically, 2 g CMC (M. W. 90![[thin space (1/6-em)]](https://www.rsc.org/images/entities/char_2009.gif) 000 g mol−1) was dissolving in water (50 mL) with magnetic stirring. After that, 1.5 g EDA (or 1,2-propanediamine, 1,6-hexamethylenediamine) was slowly injected into the solution. Then, the mixture was then sealed into the stainless steel autoclave (100 mL) lined with Teflon and placed in an environment at 220 °C for 36 h of continuous heating. After that, the obtained solution was ultrasonically dispersed at 75 W for 30 min and then filtered by a filter membrane (0.22 µm). Finally, the solution was dialyzed in ultrapure water with a MWCO 500 Da dialysis membrane for 24 h. The powders of pure N-CDs were prepared by freeze-dried for 72 h. The other N-CDs were prepared using CMC (M. W. 250
000 g mol−1) was dissolving in water (50 mL) with magnetic stirring. After that, 1.5 g EDA (or 1,2-propanediamine, 1,6-hexamethylenediamine) was slowly injected into the solution. Then, the mixture was then sealed into the stainless steel autoclave (100 mL) lined with Teflon and placed in an environment at 220 °C for 36 h of continuous heating. After that, the obtained solution was ultrasonically dispersed at 75 W for 30 min and then filtered by a filter membrane (0.22 µm). Finally, the solution was dialyzed in ultrapure water with a MWCO 500 Da dialysis membrane for 24 h. The powders of pure N-CDs were prepared by freeze-dried for 72 h. The other N-CDs were prepared using CMC (M. W. 250![[thin space (1/6-em)]](https://www.rsc.org/images/entities/char_2009.gif) 000 and 700
000 and 700![[thin space (1/6-em)]](https://www.rsc.org/images/entities/char_2009.gif) 000 g mol−1) as the carbon source, and EDA as nitrogen dopant by the same hydrothermal treatment.
000 g mol−1) as the carbon source, and EDA as nitrogen dopant by the same hydrothermal treatment.
The sample obtained without the addition of EDA was designated CDs. 2 g CMC (M. W. 90![[thin space (1/6-em)]](https://www.rsc.org/images/entities/char_2009.gif) 000 g mol−1) was dissolving in 50 mL ultrapure water under vigorous magnetic stirring, and no EDA was added. Subsequent steps were similar to above mentioned procedures for preparing N-CDs.
000 g mol−1) was dissolving in 50 mL ultrapure water under vigorous magnetic stirring, and no EDA was added. Subsequent steps were similar to above mentioned procedures for preparing N-CDs.
2.3 Characterization
The morphology and size of sample were captured by a JEM-2100 microscope (Japan) at 200 kV. The functional groups of samples were achieved using Fourier I spectrophotometer (PerkinElmer, America) with frequencies ranging from 400 to 4000 cm−1. X-ray diffraction (XRD) patterns were obtained by a 6100 X-ray diffractometer (Shimadzu, Japan). The Raman analysis was investigated using a LabRAM ARAMIS Raman spectroscope (France) under excitation at 1064 nm. X-ray photoelectron spectroscopy (XPS) experiments were using an ESCALAB250Xi spectrometer (America). 13C NMR spectroscopy was acquired on a Bruker Avance 400 MHz spectrometer by dissolving 60 mg of N-CDs in 0.5 mL of deuterized water. All fluorescence measurements were performed at the Hitachi F-7000 fluorescence spectrophotometer (Japan).2.4 Fluorescence quenching response
Initially, the 0.02 mg mL−1 of N-CDs was used as stock solution. Different metal ions solutions (Mg2+, K+, Na+, Ba2+, Fe3+, Ca2+, Al3+, Zn2+, Mn2+, Ag+, Cr3+, Cu2+, Fe2+, CrO42−, Cr2O72− and MnO4−, 1000 µM), were mixed thoroughly with the stock solution. After equilibration for 5 min, all the fluorescence emissions were determined using a 360 nm excitation wavelength. The fluorescence intensity of N-CDs solution with and without metal ions was defined as F and F0, respectively.As a further investigation of the fluorescence sensitivity to high-valence state metal ions, 2 mL Fe3+, CrO42−, Cr2O72− and MnO4− ions aqueous solutions with various concentrations were mixed with 2 mL N-CDs solution to form the fluorescence “turn off” sensing system. The fluorescence emission was performed after incubation for 5 min. The LOD was calculated as follows.
| LOD = 3σ/K |
2.5 Fluorescence recovering detection of reductants
The “turn off-on” fluorescence recovery system was constructed by introducing reductants. Briefly, various types of reductants with a final concentration of 1000 µM, including TiCl3, GSH, ascorbic acid, SnCl4 and hydroxylamine hydrochloride, were added into the above fluorescence “turn off” sensing system. After equilibration for 10 min, all emissions were measured by 360 nm excitation wavelengths. The fluorescence intensity of “turn off” sensing system was defined as FF, while the fluorescence intensity of “turn off-on” sensing system was defined as FR. The linear relationship was measured by introducing reductants with different concentrations.2.6 Detecting high-valence metal ions in practical samples
To further study the practical application of the N-CDs for detecting high-valence metal ions under environmental wastewater simulated conditions, the standard addition method was carried out using river or lake water.35 The tap water (TW) and lake water (LW) from school were filtered through a filter membrane (0.22 µm) to remove insoluble contaminants. 0.02 mg mL−1 of N-CDs was used as stock solution, and different concentrations of Fe3+, Cr6+, and Mn7+ ions aqueous solution were prepared using tap water and lake water, respectively. Analysis of the practical samples was performed using standard recovery method, and the specific experiment was as same as the modeling water.2.7 Cytotoxicity evaluation and in vitro cellular imaging
The CCK-8 assay was to assess the cell viability of Vero cells. Briefly, Vero cells in 100 µL DMEM solutions were incubated with 5% CO2 environment (37 °C, 24 h) in the 96-well plate. Vero cells were treated by the as-prepared N-CDs with 0–200 µg mL−1 concentrations for one day or two days. 100 µL of CCK-8 solutions were added and then cultured for 4 h. Thereafter, 150 µL DMSO was replaced the medium comprising CCK-8 to adding the well. Finally, the optical density was captured by excited at 450 nm. The cytotoxicity evaluation and in vitro cellular imaging were presented in detail by previous paper.363. Results and discussion
3.1 Preparation of fluorescence N-CDs
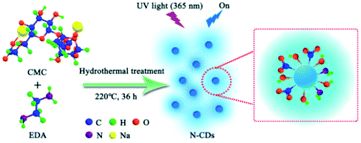
The fluorescence N-CDs were successfully obtained by mixing CMC and EDA through the green hydrothermal approach (220 °C, 36 h) (Scheme 1). Passivation of N-CDs with nitrogen was highly effective, which could endow obtained N-CDs with high QY and stable fluorescence property. Aqueous solutions of N-CDs exhibited blue fluorescence under UV light (365 nm). The amino group was doped into the structure of N-CDs and played a key effect on the QY.36,37 The effects of mass ratios of CMC to EDA, reaction temperature, molecular weights of CMC (M. W. 90![[thin space (1/6-em)]](https://www.rsc.org/images/entities/char_2009.gif) 000, 250
000, 250![[thin space (1/6-em)]](https://www.rsc.org/images/entities/char_2009.gif) 000, 700
000, 700![[thin space (1/6-em)]](https://www.rsc.org/images/entities/char_2009.gif) 000 g mol−1) and types of amine reagents on the QY values of N-CDs were further studied (Table S1†). The QY value of N-CDs was decreased from 22.9% to 15.4% and 14.7% with increasing the molecular weights of CMC from 90
000 g mol−1) and types of amine reagents on the QY values of N-CDs were further studied (Table S1†). The QY value of N-CDs was decreased from 22.9% to 15.4% and 14.7% with increasing the molecular weights of CMC from 90![[thin space (1/6-em)]](https://www.rsc.org/images/entities/char_2009.gif) 000 to 250
000 to 250![[thin space (1/6-em)]](https://www.rsc.org/images/entities/char_2009.gif) 000 and 700
000 and 700![[thin space (1/6-em)]](https://www.rsc.org/images/entities/char_2009.gif) 000 g mol−1. The results confirmed that the CMC with higher molecular weights was not beneficial to enhancing the QY values of N-CDs. The N-CDs with blue fluorescence were also successfully prepared using different types of diamines (1,2-propanediamine and 1,6-hexamethylenediamine) as nitrogen dopant, and CMC (W. M. 90
000 g mol−1. The results confirmed that the CMC with higher molecular weights was not beneficial to enhancing the QY values of N-CDs. The N-CDs with blue fluorescence were also successfully prepared using different types of diamines (1,2-propanediamine and 1,6-hexamethylenediamine) as nitrogen dopant, and CMC (W. M. 90![[thin space (1/6-em)]](https://www.rsc.org/images/entities/char_2009.gif) 000 g mol−1) as the carbon source. However, the N-CDs possessed lower QY values (10.9% for 1,2-propanediamine and 13.4% for 1,6-hexamethylenediamine) than that of N-CDs using EDA as nitrogen dopant (22.9%). This result suggested that EDA as nitrogen dopant was more favorable to prepare the N-CDs with higher QY value. The QY value of non-nitrogen doped CDs was only 4.9%, suggesting that the nitrogen-doping treatment was beneficial to improve the QY value of N-CDs. Therefore, the optimal conditions were with 1
000 g mol−1) as the carbon source. However, the N-CDs possessed lower QY values (10.9% for 1,2-propanediamine and 13.4% for 1,6-hexamethylenediamine) than that of N-CDs using EDA as nitrogen dopant (22.9%). This result suggested that EDA as nitrogen dopant was more favorable to prepare the N-CDs with higher QY value. The QY value of non-nitrogen doped CDs was only 4.9%, suggesting that the nitrogen-doping treatment was beneficial to improve the QY value of N-CDs. Therefore, the optimal conditions were with 1![[thin space (1/6-em)]](https://www.rsc.org/images/entities/char_2009.gif) :
:![[thin space (1/6-em)]](https://www.rsc.org/images/entities/char_2009.gif) 0.75 the mass ratio of CMC (M. W. 90
0.75 the mass ratio of CMC (M. W. 90![[thin space (1/6-em)]](https://www.rsc.org/images/entities/char_2009.gif) 000 g mol−1) to EDA for 36 h at 220 °C, and the QY value of N-CDs was reached 22.9%.
000 g mol−1) to EDA for 36 h at 220 °C, and the QY value of N-CDs was reached 22.9%.
3.2 Structures of fluorescent N-CDs
The morphology and size distribution of the obtained N-CDs from CMC with different molecular weights were investigated by the TEM technique. The TEM images (Fig. 1a and b) of N-CDs obtained from CMC with M. W. 90![[thin space (1/6-em)]](https://www.rsc.org/images/entities/char_2009.gif) 000 g mol−1 showed the existence of well monodispersed spherical shapes with sizes in the range of 1–4 nm and a size of 2.3 nm, which was similar to that reported in related reports.38 Furthermore, the size distribution of N-CDs, obtained from CMC with higher molecular weights (M. W. 250
000 g mol−1 showed the existence of well monodispersed spherical shapes with sizes in the range of 1–4 nm and a size of 2.3 nm, which was similar to that reported in related reports.38 Furthermore, the size distribution of N-CDs, obtained from CMC with higher molecular weights (M. W. 250![[thin space (1/6-em)]](https://www.rsc.org/images/entities/char_2009.gif) 000 and 700
000 and 700![[thin space (1/6-em)]](https://www.rsc.org/images/entities/char_2009.gif) 000 g mol−1), was also analysed by TEM technique (Fig. S1†). With increasing the molecular weight of CMC from 250
000 g mol−1), was also analysed by TEM technique (Fig. S1†). With increasing the molecular weight of CMC from 250![[thin space (1/6-em)]](https://www.rsc.org/images/entities/char_2009.gif) 000 to 700
000 to 700![[thin space (1/6-em)]](https://www.rsc.org/images/entities/char_2009.gif) 000 g mol−1, the average particle size of obtained N-CDs was increased to 6.3 and 7.0 nm, respectively. It could be caused by that CMC with higher molecular weight was incompletely reacted during the hydrothermal treatment process. The morphology of the obtained N-CDs still possessed spherical shape with good dispensability. The elemental compositions and structures of the obtained N-CDs were performed. In Fig. 1c, the peaks of C 1s, NaA, O 1s and Na 1s of CMC and CDs were observed at 285.6 eV, 496.6 eV, 532.6 eV and 1071.6 eV. The N-CDs displayed a new peak at 398.6 eV, relating to N 1s, revealing that nitrogen was introduced into the N-CDs. The carbon-to-oxygen ratio of samples increased as follows: CMC (1.44) < CDs (2.09) < N-CDs (5.78) (Table S2†). The mainly elemental compositions of N-CDs were C (68.75%), N (19.35%), and O (11.90%). The relative content of C–O and C
000 g mol−1, the average particle size of obtained N-CDs was increased to 6.3 and 7.0 nm, respectively. It could be caused by that CMC with higher molecular weight was incompletely reacted during the hydrothermal treatment process. The morphology of the obtained N-CDs still possessed spherical shape with good dispensability. The elemental compositions and structures of the obtained N-CDs were performed. In Fig. 1c, the peaks of C 1s, NaA, O 1s and Na 1s of CMC and CDs were observed at 285.6 eV, 496.6 eV, 532.6 eV and 1071.6 eV. The N-CDs displayed a new peak at 398.6 eV, relating to N 1s, revealing that nitrogen was introduced into the N-CDs. The carbon-to-oxygen ratio of samples increased as follows: CMC (1.44) < CDs (2.09) < N-CDs (5.78) (Table S2†). The mainly elemental compositions of N-CDs were C (68.75%), N (19.35%), and O (11.90%). The relative content of C–O and C![[double bond, length as m-dash]](https://www.rsc.org/images/entities/char_e001.gif) O bonds in CMC and CDs samples were very similar, which were 28.3% (C–O), 20.1% (C
O bonds in CMC and CDs samples were very similar, which were 28.3% (C–O), 20.1% (C![[double bond, length as m-dash]](https://www.rsc.org/images/entities/char_e001.gif) O) in CMC and 27.5% (C–O), 20.1% (C
O) in CMC and 27.5% (C–O), 20.1% (C![[double bond, length as m-dash]](https://www.rsc.org/images/entities/char_e001.gif) O) in CDs, respectively. However, the relative content of C–O (13.9%) and C
O) in CDs, respectively. However, the relative content of C–O (13.9%) and C![[double bond, length as m-dash]](https://www.rsc.org/images/entities/char_e001.gif) O (14.2%) bonds in N-CDs was significantly decreased, and the relative content of C–N bond was 24.2%. Therefore, the carboxyl and amino functional groups might be occurred dehydration and condensation reaction during the process of hydrothermal treatment. The nitrogen content of N-CDs was higher than those doping nitrogen content in reported literature.39 A wide peak of nitrogen was observed in the range of 394 eV to 408 eV in the XPS spectra (Fig. 1d), which could be resolved into three distinct peaks around 398.3 eV, 399.0 eV and 399.7 eV, corresponding to the functional groups of C
O (14.2%) bonds in N-CDs was significantly decreased, and the relative content of C–N bond was 24.2%. Therefore, the carboxyl and amino functional groups might be occurred dehydration and condensation reaction during the process of hydrothermal treatment. The nitrogen content of N-CDs was higher than those doping nitrogen content in reported literature.39 A wide peak of nitrogen was observed in the range of 394 eV to 408 eV in the XPS spectra (Fig. 1d), which could be resolved into three distinct peaks around 398.3 eV, 399.0 eV and 399.7 eV, corresponding to the functional groups of C![[double bond, length as m-dash]](https://www.rsc.org/images/entities/char_e001.gif) N–C, C–N–C and N–H, respectively. Compared to CMC and CDs, the C 1s signals of N-CDs (Fig. 1e) were possessed a new C–N (285.2 eV) peak. The C
N–C, C–N–C and N–H, respectively. Compared to CMC and CDs, the C 1s signals of N-CDs (Fig. 1e) were possessed a new C–N (285.2 eV) peak. The C![[double bond, length as m-dash]](https://www.rsc.org/images/entities/char_e001.gif) O and C–O peaks confirmed that N-CDs were rich in carboxyl and carbonyl functional groups. The O 1s signals (Fig. 1f) could be deconvoluted into three peaks at 531.0/530.9/530.1 eV (C
O and C–O peaks confirmed that N-CDs were rich in carboxyl and carbonyl functional groups. The O 1s signals (Fig. 1f) could be deconvoluted into three peaks at 531.0/530.9/530.1 eV (C![[double bond, length as m-dash]](https://www.rsc.org/images/entities/char_e001.gif) O), 532.2/531.6/530.8 eV (C–O–C) and 532.9/532.5/531.7 eV (C–OH), respectively.
O), 532.2/531.6/530.8 eV (C–O–C) and 532.9/532.5/531.7 eV (C–OH), respectively.
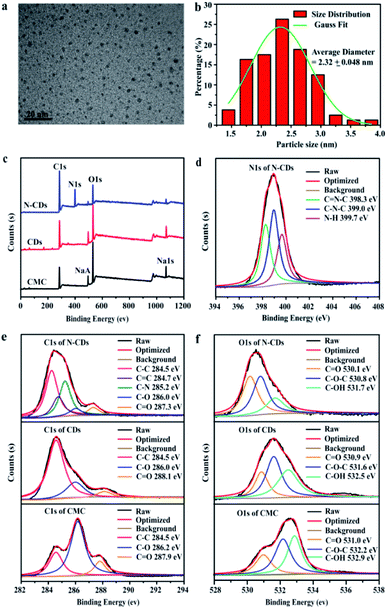 | ||
| Fig. 1 TEM image (a) and particle size distribution (b) of N-CDs, XPS survey of CMC, CDs and N-CDs (c), N 1s of N-CDs (d), C 1s (e) and O 1s (f) of CMC, CDs and N-CDs. | ||
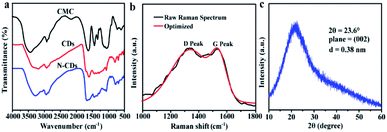
FT-IR spectra were demonstrated in Fig. 2a. The extensive absorption of N-CDs at 3279 cm−1 corresponds to the stretching vibration of O–H and N–H.35,40 The existence of amino-containing groups in the N-CDs suggested that the nitrogen element was incorporated into N-CDs during the hydrothermal process. The peaks at 1434 cm−1 and 770 cm−1 in N-CDs indicated the presence of OH and C–O stretching vibration, respectively. Besides, C![[double bond, length as m-dash]](https://www.rsc.org/images/entities/char_e001.gif) O/C–N (1664 cm−1), C–O–C (1063 cm−1) and –COOH (917 cm−1) bonds were presented in the spectrum of N-CDs, confirming the presence of hydrophilic groups in the N-CDs.41 Some oxygen-containing functional groups, such as O–H, C
O/C–N (1664 cm−1), C–O–C (1063 cm−1) and –COOH (917 cm−1) bonds were presented in the spectrum of N-CDs, confirming the presence of hydrophilic groups in the N-CDs.41 Some oxygen-containing functional groups, such as O–H, C![[double bond, length as m-dash]](https://www.rsc.org/images/entities/char_e001.gif) O, and C–O groups, can improve the dispersibility and stability of N-CDs.42 These results further validated the dehydration and condensation reactions of amino and carboxyl functional groups during high temperature heat treatment.
O, and C–O groups, can improve the dispersibility and stability of N-CDs.42 These results further validated the dehydration and condensation reactions of amino and carboxyl functional groups during high temperature heat treatment.
The Raman analysis was displayed in Fig. 2b, the D band at 1337 cm−1 was appeared, related to disordered sp3 hybridized carbon in the N-CDs. The narrow G bond at 1533 cm−1 was ascribed to the vibration of ordered sp2 hybridized carbon.43 The intensity ratio of ID/IG value was 1.02, confirming the presence of abundant graphitic structures of N-CDs. XRD pattern (Fig. 2c) showed one peak at about 23.6°, which was similar to the (002) plane of graphite with disordered hybridization carbon. The interlayer spacing of N-CDs was 0.38 nm, higher than the graphite structure (0.34 nm), showing that the N-CDs possessed poor crystallization. 13C NMR spectroscopy was further exploited to gain chemical structure of the N-CDs (Fig. S2†). A series of peaks appeared in the range of 8–85 ppm, which was ascribed to sp3 carbons within the N-CDs.44 The peaks between 100–170 ppm were attributed to sp2 carbons, and the peaks 170–185 ppm probably arose from carbonyl or carboxylic carbons in the N-CDs.45 The results indicated that the carbon within the N-CDs was mainly with the type of sp3 structure, furthermore, small contents of sp2 carbons and carbonyl or carboxylic carbons were also present in the N-CDs.
3.3 Optical characterizations of N-CDs
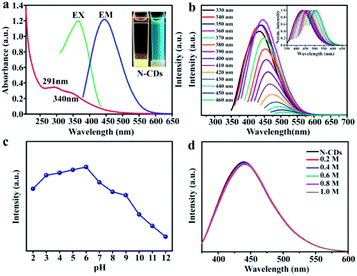
The optical performances were investigated using UV-vis absorption, excitation and emission fluorescence techniques. The as-prepared N-CDs aqueous solution appeared light brown under daylight and displayed strong blue fluorescence by exposure under 365 nm UV lamp (Fig. 3a top-right inset). The aqueous solution of the N-CDs presented the absorption bands at 291 nm and 310 nm, which are ascribed to the π–π* transition of C![[double bond, length as m-dash]](https://www.rsc.org/images/entities/char_e001.gif) C and n–π* transition of C
C and n–π* transition of C![[double bond, length as m-dash]](https://www.rsc.org/images/entities/char_e001.gif) O, respectively.46 Furthermore, the optimum excitation was observed at 360 nm, while the emission wavelength was observed at 445 nm. In a similar way, the N-CDs exhibited excitation-dependent florescent behavior. When the excitation peak was change with 330 nm to 460 nm, the corresponding fluorescence emission peak was red-shifted from 434 nm to 510 nm (Fig. 3b). This phenomenon was assigned to the state defect and particle distribution effect.
O, respectively.46 Furthermore, the optimum excitation was observed at 360 nm, while the emission wavelength was observed at 445 nm. In a similar way, the N-CDs exhibited excitation-dependent florescent behavior. When the excitation peak was change with 330 nm to 460 nm, the corresponding fluorescence emission peak was red-shifted from 434 nm to 510 nm (Fig. 3b). This phenomenon was assigned to the state defect and particle distribution effect.
The impact of pH variation on the fluorescent properties was studied. In Fig. 3c, the N-CDs solution possessed excellent fluorescent stability in a weak acid environment (pH = 4–6). In addition, the effects of ionic concentrations on fluorescent properties of as-prepared N-CDs were further studied (Fig. 3d). The fluorescence intensity had no noticeable change with the concentration of sodium chloride solution increasing in the range from 0.2 M to 1.0 M. The results confirmed that the obtained N-CDs exhibited well fluorescent performance in high ionic concentration environments. The derived N-CDs were suitable to monitor metal ions owing to these fluorescence properties.
3.4 Fluorescent “turn off” sensing of high-valence state metal ions
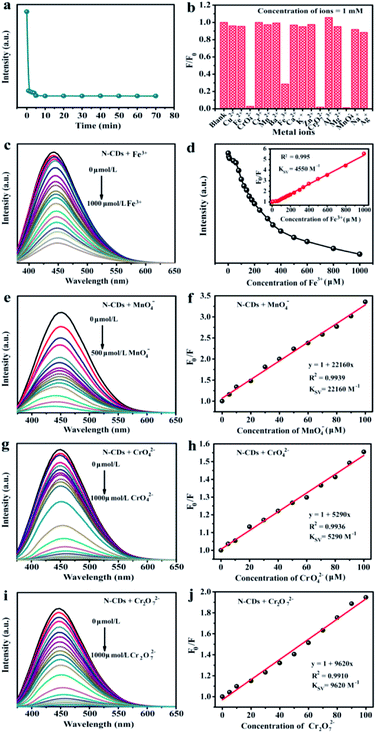
To achieve the maximum fluorescent sensitivity, the equilibrium time was analysed. The fluorescent intensity of N-CDs sharply decreased within 5 min containing Fe3+ ions (1 mM), and then remained stable. Therefore, we selected 5 min as the incubation time in the detecting metal ions experiments. The relative fluorescent intensities towards various metal ions in aqueous solution were studied by excited at 360 nm (Fig. 4b). It was found that Fe3+ had a more pronounced quenching response to the fluorescence of N-CDs and the corresponding intensity decreased by 71.4% in the process, while the Fe2+ exhibited no significant difference. Compared with Cr3+ and Mn2+, some types of high-valence metal ions, including CrO42−, Cr2O72− and MnO4−, could easily quench the fluorescence, which were 97.3%, 98.2% and 98.9%, respectively. Remarkably, the fluorescence behavior was evidently influenced only by those high-valence metal ions, but unchanged by the low-valence metal ions.
Fig. 4c was the fluorescence spectra of N-CDs containing various concentrations Fe3+. The fluorescent intensity reduced till completely quenched when Fe3+ ions concentration was up to 1 mM. Furthermore, the Stern–Volmer curve revealed a well linearity (R2 = 0.995) (Fig. 4d). The Stern–Volmer constant (Ksv) was 4550 M−1, suggesting that N-CDs could be served as sensing platform to detect Fe3+ ions. The LOD value of Fe3+ ion was 0.8 µM. Compared with other reported carbon dots from various precursors (Table S3†), the obtained N-CDs possessed wider linear range (0–1000 µM), and relatively low LOD (0.8 µM) of Fe3+ ions. The results suggested that the N-CDs exhibited a favorable detection performance. Furthermore, similar “turn off” fluorescent phenomena could be observed in some high-valence metal ions (MnO4−, CrO42− and Cr2O72−). Hence, the N-CDs aqueous solution was also used as fluorescence probes to detect MnO4−, CrO42− and Cr2O72− metal ions via the fluorescence quenching response. By introducing the high-valence metal ions into the N-CDs aqueous solution, fluorescent intensity was gradually reduced with the increase of MnO4−, CrO42− and Cr2O72− ions concentrations, respectively (Fig. 4e, g and i). Moreover, the fluorescence emission peaks were red-shifted in presence of MnO4−, CrO42− and Cr2O72− ions. The fluorescence quenching fitting curves between F0/F value and metal ions concentrations were established and the results are shown in Fig. 4f, h and j. There were excellent correlation coefficients (R2 > 0.991) between the fluorescence quenching efficiency and high-valence metal ions (MnO4−, CrO42− and Cr2O72−) concentrations from 0 to 100 µM. The Ksv value was calculated to be 22![[thin space (1/6-em)]](https://www.rsc.org/images/entities/char_2009.gif) 160 M−1 for MnO4−, 9620 M−1 for Cr2O72− and 5290 M−1 for CrO42−. These showed that N-CDs aqueous solution could be facilely designed as sensitive and efficient detectors for high-valence metal ions, e.g., Fe3+, Mn7+, Cr6+ ions, in the environmental pollution.
160 M−1 for MnO4−, 9620 M−1 for Cr2O72− and 5290 M−1 for CrO42−. These showed that N-CDs aqueous solution could be facilely designed as sensitive and efficient detectors for high-valence metal ions, e.g., Fe3+, Mn7+, Cr6+ ions, in the environmental pollution.
We discussed overlaps UV-vis spectra of different ions with fluorescent spectra of N-CDs (Fig. S3†). It was found that no new peak was occurred in the UV-vis spectra, showing that no new substance was formed. In addition, the overlaps area between UV-vis curve of Fe3+ and fluorescent emission curve of the N-CDs were small, confirming that fluorescence quenching by introducing Fe3+ to the N-CDs solution was thanks to the internal electron transfer, rather than fluorescence resonance energy transfer (FRET). For CrO42−, Cr2O72− and MnO4− metal ions, the large spectral overlaps areas of UV-vis curve and fluorescent emission were corresponded to FRET, which could lay a foundation for detecting those mentioned metal ions by forming donor–acceptor (N-CDs-high valence metal ions) in different fluorescent systems. All of results indicated that the quenched fluorescence of N-CDs caused by metal ions was associated with their valence states.
3.5 Fluorescent “turn off-on” sensing of reducing agent
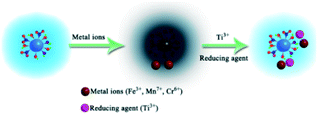
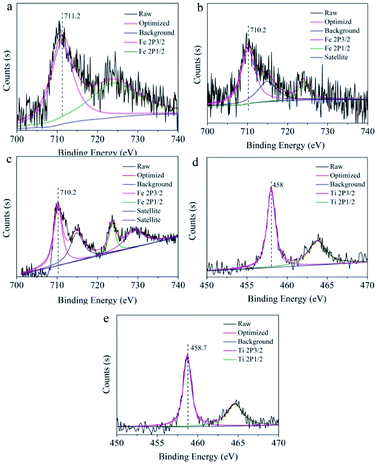
The valence of metal ions was reduced by introducing reducing agent, aiming to recover the quenched fluorescence of N-CDs aqueous solution. Therefore, the “turn off-on” fluorescence resuming system of N-CDs was constructed after adding reducing agents in the N-CDs/valence metal ions systems, which would broaden the application of N-CDs as fluorescence probe for reducing agent sensing. The FR/FF values, representing the fluorescent intensity ratio of the N-CDs solution containing valence metal ions (1 mM) without and with reducing agents (1 mM), are shown in Table S4.† The higher FR/FF value indicated that the fluorescence resuming efficiency was better by introducing reducing agents. Reducing agents, including Ti3+, ascorbic acid, Sn4+, hydroxylamine hydrochloride and GSH, were used to reversibly change the fluorescence. Among all of these reducing agents, Ti3+ had the best fluorescence resuming ability to the quenched fluorescence. In the case of Ti3+-reduction fluorescence resuming of N-CDs, the maximal resuming rates were calculated to be 96.4% for Fe3+, 58.8% for MnO4−, 87.4% for CrO42− and 84.8% for Cr2O72−. The fluorescence recovery performance was attributed to the redoxability of reducing agent, suggesting that redox process between the surface groups of N-CDs and metal ions was the driving force to result in the fluorescence recovering.Here we designed a schematic diagram to reveal the “turn off-on” fluorescence resuming system between N-CDs/valence metal ions and reducing reagents. A simple fluorescence system was established based on the aqueous solution of N-CDs with high-valence metal ions (Fe3+, Mn7+, Cr6+) as the fluorescence quencher. The obtained N-CDs solution showed blue light using UV lamp at 365 nm (Scheme 2). The blue fluorescence was disappeared (turn off) when Fe3+, Mn7+ and Cr6+ high-valence metal ions were mixed with the N-CDs solution. Taking the Fe3+ metal ions as an example, specific information of the surface state of N-CDs after Fe3+, Fe2+ and Fe3+–Ti3+ absorption was recorded by XPS spectra, which could be further studied the correlation between metal ions and surface groups of N-CDs (Fig. 5). The peaks of Fe 2p3/2 and Fe 2p1/2 in the presence of Fe3+ were observed at 711.2 eV and 724.0 eV, respectively (Fig. 5a). In the spectrum of Fe2+ sample (Fig. 5b), the peaks of Fe 2p3/2 and Fe 2p1/2 appeared at 710.2 eV and 723.8 eV, which possessed lower binding energy than that of Fe3+/N-CDs.47 This might be due to the strong electrostatic interaction between π electrons in the N-CDs and the empty orbital of Fe3+, resulting in the quenching fluorescence. As shown in Fig. 5c, the signal peaks of Fe 2p3/2 and Fe 2p1/2 in N-CDs/Fe3+/Ti3+ sample appeared at 710.2 eV and 723.8 eV, which was consistent with binding energy of Fe2+ in N-CDs/Fe2+ sample. The results indicated that Fe3+ was reduced to Fe2+ after introducing Ti3+ metal ions into the N-CDs/Fe3+ solution, and the quenched fluorescence could be restored owing to the redox process. Besides, the Ti metal ions of valence state and the peak position were further analysed to verify the above hypothesis by XPS spectra (Fig. 5d and e). In the XPS spectrum (Fig. 5d) of N-CDs solution only addition Ti3+, two peaks of Ti 2p3/2 and Ti 2p1/2 were presented in 458 eV and 463.7 eV. However, after addition of Ti3+ metal ion into the N-CDs/Fe3+ solution (Fig. 5e), the peaks of Ti 2p3/2 and Ti 2p1/2 was shifted to high binding energy (458.7 eV, 464.6 eV), showing that electron transfer might occurred between Ti3+ metal ion and N-CDs/Fe3+ system by the redox process, which could reduce high-valence metal ions to low-valence metal ions for further realize the recovery of fluorescence.
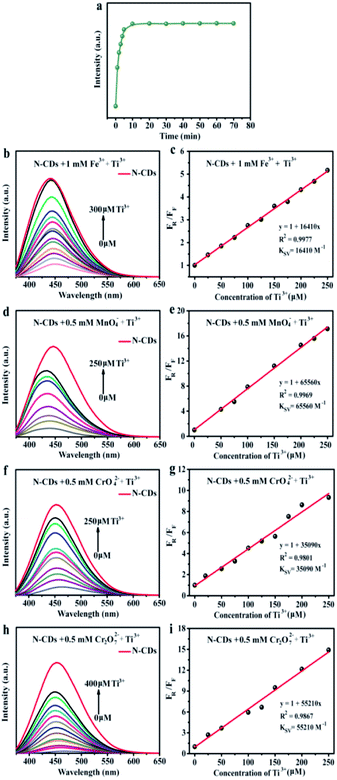
Based on the above “turn off-on” fluorescence sensing system, Ti3+ could effectively lead to fluorescent resuming of the N-CDs quenched by high valence metal ions. Therefore, the impacts of the different concentrations Ti3+ on the fluorescent recovery performance of N-CDs/high valence metal ions systems were further investigated (Fig. 6). The fluorescent intensity of the N-CDs/Fe3+ system with Ti3+ peaked when incubation for 10 min (Fig. 6a). Therefore, we selected 10 min as the optimal equilibrium time to detect Ti3+. Interestingly, “turn off-on” fluorescence recovery intensity was gradually increased when the Ti3+ was added into the N-CDs/valence metal ions systems. The fluorescence recovery emission curves showed blue-shift with increasing the Ti3+ contents (Fig. 6b, d, f and h). In addition, there was good linear relation (R2 > 0.98) between FR/FF and the concentration of Ti3+ (0–250 µM) (Fig. 6c, e, g and i). The Ksv of fluorescence recovery fitting curve after introducing Ti3+ was calculated to be 16![[thin space (1/6-em)]](https://www.rsc.org/images/entities/char_2009.gif) 410 M−1, 65
410 M−1, 65![[thin space (1/6-em)]](https://www.rsc.org/images/entities/char_2009.gif) 560 M−1, 35
560 M−1, 35![[thin space (1/6-em)]](https://www.rsc.org/images/entities/char_2009.gif) 090 M−1 and 55
090 M−1 and 55![[thin space (1/6-em)]](https://www.rsc.org/images/entities/char_2009.gif) 210 M−1 for the N-CDs/Fe3+, N-CDs/MnO4−, N-CDs/CrO42− and N-CDs/Cr2O72−, respectively. Hence, taking advantage of the novel “turn off-on” fluorescence system, the comprehensive approach for analysis Ti3+ was great promising in the application of daily wastewater and environment monitoring.
210 M−1 for the N-CDs/Fe3+, N-CDs/MnO4−, N-CDs/CrO42− and N-CDs/Cr2O72−, respectively. Hence, taking advantage of the novel “turn off-on” fluorescence system, the comprehensive approach for analysis Ti3+ was great promising in the application of daily wastewater and environment monitoring.
3.6 Analysis of the practical samples
To further evaluate the practical application of the as-prepared N-CDs for detecting metal ions in the actual samples, the standard recovery experiments were performed using TW from laboratory and LW from school. The water samples were filtered through a filter membrane (0.22 µm). The different concentrations of Fe3+, Cr6+, and Mn7+ were added into the N-CDs solution. Despite the rich minerals and impurities present in the lake water, there was no distinct effect on the detecting metal ions, as shown in Table 1. The standard recovery rate of Fe3+, Cr6+, and Mn7+ with various concentrations was in the range of 94.5–107.6%, 92.7–102.06%, and 90.3–105.5%, respectively. The results indicated that the current method might provide an efficient path for detecting high-valence metal ions in actual samples.| Samples | Metal ions supplemented (µM) | Metal ions measured (µM) | Recovery (%) |
|---|---|---|---|
| Fe3+ (WT) | 10 | 10.76 | 107.6 |
| Fe3+ (WT) | 50 | 50.32 | 100.64 |
| Fe3+ (LW) | 10 | 9.45 | 94.5 |
| Fe3+ (LW) | 60 | 61.75 | 102.9 |
| Cr6+ (WT) | 10 | 9.83 | 98.3 |
| Cr6+ (WT) | 60 | 61.24 | 102.06 |
| Cr6+ (LW) | 10 | 9.27 | 92.7 |
| Cr6+ (LW) | 50 | 48.21 | 96.4 |
| Mn7+ (WT) | 10 | 9.52 | 95.2 |
| Mn7+ (WT) | 30 | 31.67 | 105.5 |
| Mn7+ (LW) | 10 | 9.03 | 90.3 |
| Mn7+ (LW) | 30 | 29.38 | 97.9 |
3.7 Bio-imaging with N-CDs
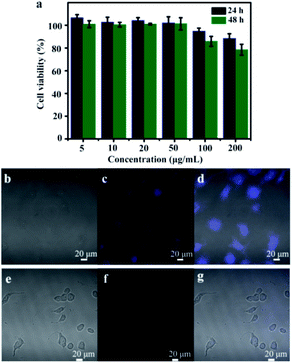
As to be applied in the field of bio-imaging, the requirement for N-CDs is relatively low toxicity. Therefore, the bio-toxicity of as-prepared N-CDs in Vero cells was further investigated. Vero cells were incubated in DMEM at varying concentrations of N-CDs for one day or two days. The cell viability still remained 86% after incubated in DMEM with N-CDs (100 µg mL−1) for two days (Fig. 7a). The results indicated that N-CDs were no cytotoxic, have good compatible with Vero cells as fluorescent probes for biosensors.48–50 On account of the excellent fluorescent properties and superior biocompatibility, the N-CDs could be regarded as sensor in cellular imaging. After incubation for 4 h in N-CDs solution, intracellular blue-colored fluorescence was seen by 488 nm excitation wavelength (Fig. 7b–d), confirming that the obtained N-CDs solution was effectively internalized by Vero cells. However, no fluorescence appeared when Vero cells were mixed in N-CDs/Fe3+ (1 mM) solution (Fig. 7e–g). The N-CDs products from CMC and EDA can be employed as promising fluorescent sensor for cell image-forming and biomarker.4. Conclusions
In summary, we demonstrated stable N-CDs with high levels of QY (22.9%) by a single-step hydrothermal method employing CMC and EDA as precursors. The corresponding N-CDs were spherical shape with 2.3 nm average diameter as well as excellent water dispersibility. The obtained N-CDs exhibited selective quenching response by a series of high-valence (Fe3+, Cr6+ and Mn7+) metal ions. By introducing Fe3+ ion as a model quencher, the LOD of Fe3+ ion was 0.8 µM. We have further explored that the quenching mechanism of N-CDs by high valence metal ions to explain valence state-related electron-transfer fluorescence quenching between high-valence metal ions and N-CDs. An interesting finding was that the quenched fluorescence could be effectively recovered by reducing agent (Ti3+). Therefore, N-CDs were served as reversible fluorescent sensors for detecting reducing agent on the basis of the high-valence metal ions induced fluorescence quenching of the N-CDs. The sensing platform with high-efficiency and instant fluorescence response will give highlight on developing smart devices for monitoring high-valence metal ions and environmental redox substances in wastewater.Author contributions
Project was conceived by Yanzhu Guo and Zhenzhen Liu. Experiments were designed by Yanzhu Guo, Zhenzhen Liu and Runsen Li. Laboratory work by Zhenzhen Liu, Runsen Li and Yumei Gong. Data analysis was carried out by Yanzhu Guo, Zhenzhen Liu, Yan Li and Jingpeng Zhou. Manuscript was written by Zhenzhen Liu, Yanzhu Guo, Haiming Li and Haiqiang Shi and edited by Zhenzhen Liu, Yanzhu Guo, Zhiwei Wang and Fengshan Zhang.Conflicts of interest
There are no conflicts to declare.Acknowledgements
We are grateful for the National Natural Science Foundation (22078036 and 31500493), LiaoNing Revitalization Talents Program (XLYC1807232), Liaoning BaiQianWan Talents Program, the State Key Laboratory of Pulp and Paper Engineering, South China University of Technology (202002) and the Opening Project of Guangxi Key Laboratory of Clean Pulp & Papermaking and Pollution Control (2019KF30) for their support of this research.References
- F. S. Al-Fartusie and S. N. Mohssan, Indian J. Adv. Chem. Sci., 2017, 5, 127 CAS.
- J. Jiang, S. Y. Pang, J. Ma and H. Liu, Environ. Sci. Technol., 2012, 46, 1774 CrossRef CAS PubMed.
- S. G. Tuncel, S. Yenisoy-Karakas and A. Dogangun, Talanta, 2004, 63, 273 CrossRef CAS PubMed.
- M. Ghaedi, K. Niknam, A. Shokrollahi, E. Niknam, H. R. Rajabi and M. Soylak, J. Hazard. Mater., 2008, 155, 121 CrossRef CAS PubMed.
- S. Khazaeli, N. Nezamabadi, M. Rabani and H. A. Panahi, Microchem. J., 2013, 106, 147 CrossRef CAS.
- G. Aragay and A. Merkoçi, Electrochim. Acta, 2012, 84, 49 CrossRef CAS.
- K. Agrawal, K. S. Patel, K. Shrivas, V. K. Jain and F. Khan, J. Hazard. Mater., 2009, 164, 95 CrossRef CAS PubMed.
- H. S. Amoli, A. Porgam, Z. B. Sadr and F. Mohanazadeh, J. Chromatogr. A, 2006, 1118, 82 CrossRef PubMed.
- P. Ugo, L. M. Moretto and G. A. Mazzocchin, Anal. Chim. Acta, 1995, 305, 74 CrossRef CAS.
- X. Xu, R. Ray, Y. Gu, H. J. Ploehn, L. Gearheart, K. Raker and W. A. Scrivens, J. Am. Chem. Soc., 2004, 126, 12736 CrossRef CAS PubMed.
- G. Y. Lan, Y. W. Lin, Y. F. Huang and H. T. Chang, J. Mater. Chem., 2007, 17, 2661 RSC.
- Q. Li, T. Ohulchanskyy, R. Liu, K. Koynov, D. Wu, A. Best and R. Kumar, J. Phys. Chem. C, 2010, 114, 12062 CrossRef CAS.
- S. Y. Park, H. U. Lee, E. S. Park, S. C. Lee, J. W. Lee, S. W. Jeong, C. H. Kim, Y. C. Lee, Y. S. Huh and J. Lee, ACS Appl. Mater. Interfaces, 2014, 6, 3365 CrossRef CAS PubMed.
- Y. W. Zheng, D. Yang, X. Wu, H. R. Yan, Y. C. Zhao, B. Feng, K. Duan, J. Weng and J. X. Wang, RSC Adv., 2015, 5, 90245 RSC.
- B. De and N. Karak, RSC Adv., 2013, 3, 8286 RSC.
- H. Huang, C. Li, S. Zhu, H. Wang, C. Chen, Z. Wang, T. Bai, Z. Shi and S. Feng, Langmuir, 2014, 30, 13542 CrossRef CAS PubMed.
- X. Tan, A. N. B. Romainor, S. F. Chin and S. M. Ng, J. Anal. Appl. Pyrolysis, 2014, 105, 157 CrossRef CAS.
- K. Hola, Y. Zhang, Y. Wang, E. P. Giannelis, R. Zboril and A. L. Rogach, Nano Today, 2014, 9, 590 CrossRef CAS.
- F. Lu, Y. Song, H. Huang, Y. Liu, Y. Fu, J. Huang, H. Li, H. Qu and Z. Kang, Carbon, 2017, 120, 95 CrossRef CAS.
- Y. Shu, J. Lu, Q. X. Mao, R. S. Song, X. Y. Wang, X. W. Chen and J. H. Wang, Carbon, 2017, 114, 324 CrossRef CAS.
- L. H. Mao, W. Q. Tang, Z. Y. Deng, S. S. Liu, C. F. Wang and S. Chen, Ind. Eng. Chem. Res., 2014, 53, 6417 CrossRef CAS.
- P. J. G. Luo, F. Yang, S. T. Yang, S. K. Sonkar, L. J. Yang, J. J. Broglie, Y. Liu and Y. P. Sun, RSC Adv., 2014, 4, 10791 RSC.
- W. Gao, H. Song, X. Wang, X. Liu, X. Pang, Y. Zhou, B. Gao and X. Peng, ACS Appl. Mater. Interfaces, 2018, 10, 1147 CrossRef CAS PubMed.
- L. Rao, Y. Tang, H. Lu, S. Yu, X. Ding, K. Xu, Z. Li and J. Z. Zhang, Nanomaterials, 2018, 8, 900 CrossRef PubMed.
- X. Wang, L. Cao, F. Lu, M. J. Meziani, H. Li, G. Qi, B. Zhou, B. A. Harruff, F. Kermarrec and Y. P. Sun, Chem. Commun., 2009, 25, 3774 RSC.
- K. Qu, J. Wang, J. Ren and X. Qu, Chem.–Eur. J., 2013, 19, 7243 CrossRef CAS PubMed.
- T. N. J. I. Edison, R. Atchudan, J. J. Shim, S. Kalimuthu, B. C. Ahn and Y. R. Lee, J. Photochem. Photobiol., B, 2016, 158, 235 CrossRef CAS PubMed.
- Y. Yan, H. Yu, K. Zhang, M. Sun, Y. Zhang, X. Wang and S. Wang, Nano Res., 2016, 9, 2088 CrossRef CAS.
- N. Gogoi, M. Barooah, G. Majumdar and D. Chowdhury, ACS Appl. Mater. Interfaces, 2015, 7, 3058 CrossRef CAS PubMed.
- A. Saikia and N. Karak, Mater. Today Commun., 2018, 14, 82 CrossRef CAS.
- A. Kumar, A. R. Chowdhuri, D. Laha, T. K. Mahto, P. Karmakar and S. K. Sahu, Sens. Actuators, B, 2017, 242, 679 CrossRef CAS.
- R. Bandi, R. Dadigala, B. R. Gangapuram and V. Guttena, J. Photochem. Photobiol., B, 2018, 178, 330 CrossRef CAS PubMed.
- W. J. Niu, D. Shan, R. H. Zhu, S. Y. Deng, S. Cosnier and X. J. Zhang, Carbon, 2016, 96, 1034 CrossRef CAS.
- V. Sharma, N. Kaur, P. Tiwari, A. K. Saini and S. M. Mobin, Carbon, 2018, 139, 393 CrossRef CAS.
- Y. Liu, Y. Liu, S. J. Park, Y. Zhang, T. Kim, S. Chae, M. Park and H. Y. Kim, J. Mater. Chem. A, 2015, 3, 17747 RSC.
- Z. Z. Liu, M. J. Chen, Y. Z. Guo, J. H. Zhou, Q. S. Shi and R. C. Sun, Chem. Eng. J., 2020, 384, 123260 CrossRef CAS.
- B. Han, W. Wang, H. Wu, F. Fang, N. Wang, X. Zhang and S. Xu, Colloids Surf., B, 2012, 100, 209 CrossRef CAS PubMed.
- Y. Li, J. Ren, R. Sun and X. Wang, J. Biomed. Nanotechnol., 2018, 14, 1543 CrossRef CAS PubMed.
- P. Shen, J. Gao, J. Cong, Z. Liu, C. Li and J. Yao, ChemistrySelect, 2016, 1, 1314 CrossRef CAS.
- X. Yang, Y. Zhuo, S. Zhu, Y. Luo, Y. Feng and Y. Dou, Biosens. Bioelectron., 2014, 60, 292 CrossRef CAS PubMed.
- A. Gupta, N. C. Verma, S. Khan and C. K. Nandi, Biosens. Bioelectron., 2016, 81, 465 CrossRef CAS PubMed.
- S. Qu, X. Wang, Q. Lu, X. Liu and L. Wang, Angew. Chem., Int. Ed., 2012, 51, 12215 CrossRef CAS PubMed.
- D. Qu, M. Zheng, P. Du, Y. Zhou, L. Zhang, D. Li, H. Tan, Z. Zhao, Z. Xie and Z. Sun, Nanoscale, 2013, 5, 12272 RSC.
- K. J. D. MacKenzie and M. E. Smith, Multinuclear solid-state NMR of inorganic materials, Pergamon, Oxford, 2002 Search PubMed.
- L. Tian, D. Ghosh, W. Chen, S. Pradhan, X. Chang and S. Chen, Chem. Mater., 2009, 21, 2803 CrossRef CAS.
- H. Li, W. Kong, J. Liu, N. Liu, H. Huang, Y. Liu and Z. Kang, Carbon, 2015, 91, 66 CrossRef CAS.
- Q. Mei, C. Jiang, G. Guan, K. Zhang, B. Liu, R. Liu and Z. Zhang, Chem. Commun., 2012, 48, 7468 RSC.
- Z. Zhang, W. Sun and P. Wu, ACS Sustainable Chem. Eng., 2015, 3, 1412 CrossRef CAS.
- S. Zhu, Q. Meng, L. Wang, J. Zhang, Y. Song, H. Jin, K. Zhang, H. Sun, H. Wang and B. Yang, Angew. Chem., Int. Ed., 2013, 52, 3953 CrossRef CAS PubMed.
- X. Chen, Q. Jin, L. Wu, C. Tung and X. Tang, Angew. Chem., Int. Ed., 2104, 3, 542 Search PubMed.
Footnote |
| † Electronic supplementary information (ESI) available. See DOI: 10.1039/d1ra04972k |
| This journal is © The Royal Society of Chemistry 2021 |

