 Open Access Article
Ceria nanorods as highly stable free radical scavengers for highly durable proton exchange membranes†
Rui Zhiyan,
Li Qingbing,
Huo Youxiu,
Ding Rui,
Liu Jia,
Li Jia* and
Liu Jianguo *
*
National Laboratory of Solid State Microstructures, College of Engineering and Applied Sciences, Nanjing University, 163 Xianlin Road, Nanjing, Jiangsu Province, People's Republic of China. E-mail: lijia0226@nju.edu.cn; jianguoliu@nju.edu.cn
First published on 28th September 2021
Abstract
Chemically durable proton exchange membranes containing free radical scavengers have technically matured in recent years, and commercial products have come into the market. The most general type of free radical scavenger is ceria, which has been proven in many studies. However, the migration of cerium is inevitable in raw ceria particles, and the migrated cerium species can aggregate in catalyst layers, causing performance loss of fuel cells. In this work, the morphology of ceria was changed from conventional nanoparticles to nanorods, and the migration of cerium was mitigated significantly. Both ex situ Fenton's degradation tests and in situ fuel cell accelerated degradation tests (ADTs) indicated that ceria nanorods have free radical scavenging properties comparable to those of ceria nanoparticles. Moreover, the immobilization of ceria particles and antidissolving properties have been verified by Fenton's degradation tests, electric field tests and fuel cell ADTs.
Introduction
Proton exchange membrane fuel cells (PEMFCs) are one of the most important approaches to utilizing hydrogen energy.1 PEMFCs have been developed for decades and have entered a period of rapid commercialization in the past ten years. Automobiles are one of the applications of PEMFCs, and they are highly sensitive to the volume and the weight of PEMFC systems.2 According to the United States Department of Energy (DOE), automotive PEMFC systems have to reach a specific power of 0.9 kW kg−1 by 2025, and PEMFC stacks have to reach a specific power of 2.7 kW kg−1.3 With the endeavor of institutes and enterprises around the world, this goal is getting closer to realization. The enhancement in the specific power of PEMFC stacks can be ascribed to the development of core materials, including proton exchange membranes (PEMs), catalysts, gas diffusion layers (GDLs) and bipolar plates.4PEMs are one of the most important materials in PEMFCs. In addition to providing insulation to electrons, PEMs have to separate gas in the anode and cathode while conducting protons from the anode to the cathode.5 A decrease in thickness is the trend of the development of PEMs because thinner PEMs have lower resistance and can obtain higher specific power when assembled in a fuel cell stack. However, PEMs suffer from severe chemical degradation from active radical attack.6–8 Taking perfluorinated sulfonic acid resin (PFSR), the most stable PEM, as an example, chemical degradation follows four types of degradation mechanisms: the unzipping mechanism, C–S bond cleavage mechanism, ether linkage cleavage mechanism and chain scission mechanism.9 The unzipping mechanism is the main mechanism for all kinds of degradation mechanisms, and it follows reactions (1)–(3). In the total reaction, the PFSR main chain releases 2 fluorine atoms and 1 carbon atom, while the carboxyl end-group appears repeatedly, making the reaction continuous.10–12
In the other three degradation mechanisms, free radicals are also important reactants. Removing free radicals is an effective approach to mitigate chemical degradation, and the purpose can be realized by adding free radical scavengers (FRSs) to PEMs.
| Rf − CF2 − COOH + ˙OH →·Rf − CF2˙ + CO2 + H2O | (1) |
| Rf − CF2 + OH →·Rf − CF2OH →·Rf − COF + HF | (2) |
| Rf − COF + H2O →·Rf − COOH + HF | (3) |
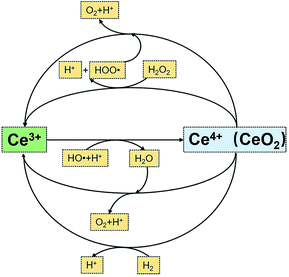
FRSs in PEMs are quenchers of free radicals, and chemical degradation of PEMs is relieved via the reaction between FRSs and free radicals.13 FRSs based on metal oxides are the most commonly used materials in PEMs, especially ceria, which has polyvalent cerium ions on the surface. Ceria can react with free radicals via the mechanism in Fig. 1,14 in which cerium ion can transform between +3 and +4 states, and the constructed circulation ensures the regeneration of the radical scavenging property of ceria. In previous works, ceria was verified to be an effective FRS in PEMs.15–20 The major reduction reaction from Ce4+ to Ce3+ in fuel cell system relates to the penetrated hydrogen, which can be confirmed in Fig. S1.† Fig. S1† is a typical hydrogen crossover curve before and after open circuit voltage (OCV) holding test without any recovery. The hydrogen crossover decreased after the test for that the Ce3+ on the surface of ceria was oxidized to Ce4+, and there is more Ce4+ on the surface on the surface. When testing hydrogen crossover, the penetrated hydrogen was consumed by the Ce4+ on the surface. The extra Ce4+ on the surface can consume more hydrogen, causing the decrease in hydrogen crossover.
However, the drawbacks of ceria cannot be ignored. First, ceria may coordinate with functional groups at the end of side chains in PEMs, causing inevitable performance loss.21,22 Thus, cerium amount in PEMs should be as less as possible. Moreover, ceria and dissolved cerium ions may migrate in PEMs via water flux, electric fields and diffusion, causing uneven distributions of cerium in PEMs and aggregation of cerium in both anode and cathode catalyst layers.23,24 The aggregation of cerium in catalyst layers can result in significant cell resistance enhancement and performance degradation. Loading ceria nanoparticles on immobilized fillers, such as multiwalled carbon nanotubes,25 TiC nanosheets26 and polydopamine-coated ePTFE,27 can mitigate the migration of cerium. All the immobilized fillers are of high dimensionality, and combining ceria nanoparticles with high-dimensional materials can prevent total particle migration. However, it is far more expensive to fabricate a composite filler and to introduce it to PEMs. Moreover, cerium ions dissolving from ceria nanoparticles cannot be mitigated via this strategy.
In this work, ceria nanorods were fabricated through a facile hydrothermal method and introduced to Nafion membranes. Ceria nanorods with a relatively high length to diameter ratio (L/D) can avoid the overall migration of ceria, and an increase in the average curvature radius can suppress the dissolution of cerium ions from ceria. Ceria nanorods are of great economy, and the additional expense can be less than $0.1 m−2, with the prospect of being applied in continuous industrial production.
Experimental
Synthesis of ceria nanorod
Ceria nanorods were fabricated via a conventional hydrothermal method.28,29 Ce(NO3)3·6H2O (1.3 g) and NaOH (7.35 g) were dissolved in deionized water to form homogeneous solutions. The Ce(NO3)3·6H2O solution was first poured into a PTFE lining, and then, the NaOH solution poured into the same PTFE lining. The PTFE lining was then sealed in a hydrothermal autoclave. The hydrothermal autoclave was transferred to an air circulation oven and heated at 110 °C for 24 h. After the hydrothermal autoclave was cooled to room temperature, the sediment in the PTFE lining was collected. Deionized water and ethanol were used to remove residual reactants and to clean the surface of the ceria nanorods. Finally, the ceria nanorods were dried in an air circulation oven at 60 °C overnight.Fabrication of Nafion/ceria nanorod composite membranes
Nafion/ceria nanorod composite membranes were fabricated using a solution casting strategy.30–32 A Nafion D520 (DuPont, 5 wt%) PFSR dispersion was mixed with dimethyl sulfoxide (DMSO) at a weight ratio of 20![[thin space (1/6-em)]](https://www.rsc.org/images/entities/char_2009.gif) :
:![[thin space (1/6-em)]](https://www.rsc.org/images/entities/char_2009.gif) 9. The mixture was transferred to a round-bottom flask to perform rotary evaporation. During rotary evaporation, solvents with low boiling points (water, ethanol and 1-propanol) were completely removed. The remnant solution was a 10 wt% Nafion/DMSO dispersion.
9. The mixture was transferred to a round-bottom flask to perform rotary evaporation. During rotary evaporation, solvents with low boiling points (water, ethanol and 1-propanol) were completely removed. The remnant solution was a 10 wt% Nafion/DMSO dispersion.
Before membrane casting, 3 mg ceria nanorods was added to a 3 g Nafion/DMSO dispersion to form a homogeneous dispersion after vigorous stirring. The Nafion-ceria/DMSO dispersion was then poured into a horizontal glass casting mold in a vacuum oven. Then, the solvent was removed at 40 °C under high vacuum for 12 h, followed by annealing at 150 °C under high vacuum for 4 h to enhance the degree of crystallinity of the composite membrane. After cooling to room temperature, the glass casting mold was removed from the vacuum oven, and the composite membrane was peeled away from the glass mold. The membrane was then immersed in 1 M H2SO4 aqueous solution at 80 °C to fully protonate the composite membrane. The composite membrane was transferred to 80 °C deionized water to clean the surface of the composite membranes. The as-prepared composite membrane was preserved in deionized water for subsequent use, and the composite membrane was marked as Nafion/1% ceria nanorods. Commercial ceria nanoparticles with particle sizes between 30 nm and 50 nm were also applied to the Nafion matrix via the same process, and the composite membrane was marked as Nafion/1% ceria nanoparticles.
Material characterization
Transmission electron microscopy (TEM, FEI Tecnai F20, 200 kV) was applied to investigate the morphology of ceria nanorods. X-ray diffraction (XRD, Thermo Fisher X’TRA, Cu Kα) was used to determine the lattice structure of the ceria nanorods, and the scan rate was 5° min−1. X-ray photoelectron spectroscopy (XPS, ULVAC-PHI PHI5000 VersaProbe, Al kα) was used to investigate the surface properties of ceria nanorods, and each sample was interrogated for one site. XPS fitting was performed with shirley as the background type and d as the peak type, and the XPS location was calibrated to keep C–C bonds at 284.8 eV. To further confirm the surface state of the ceria nanorods, a surface area and porosity analyzer (Micromeritics ASAP 2460) was used for characterization. The front and cross-sectional morphology of the fabricated composite membranes was investigated by scanning electron microscopy (SEM, Hitachi S-3400N, 3 kV, Au coating was fabricated). The membranes were dried overnight in advance, and the cross-section was fabricated by breaking off in liquid nitrogen. The tensile test was carried out on a universal tensile testing machine (MTS, C45.105) at room temperature with 2 cm × 5 cm specimens, and the specimens were dried overnight before testing.Ex situ Fenton's degradation tests
An ex situ Fenton's degradation test was performed to evaluate the free radical scavenging efficacy of ceria nanorods in PEMs. Fenton's reagent can generate free radicals efficiently by catalyzing ferrous ions via reaction (4) and reaction (5),33 and the generated free radicals can simulate the in situ environment in MEA.| H2O2 +Fe2+ → Fe3+ + OH˙ + OH− | (4) |
| H2O2 + Fe3+ → Fe2+ + OOH˙ + H+ | (5) |
Nafion 211, Nafion/1% ceria nanoparticle and Nafion/1% ceria nanorod were dried in air circulation oven and weighed immediately when taken out of the oven before Fenton's degradation test. 30 mL 30% H2O2 was diluted to 100 mL, and 5 mg FeSO4·7H2O was added to serve as catalyst. 27 μL H2SO4 (98%) was added to maintain the pH at 2 to simulate the acidic environment in PEMs, while avoiding the sediment of ferrous ion. After the Fenton's reagent was prepared, the dried membranes were immersed in under room temperature. The membranes were taken out of the solution every 24 h, and the membranes were washed to remove the residual solutes on the surface on the membranes. The membranes were dried and weighed for the next 24 h experiment. Meanwhile, the solution was collected every 24 h, and fluoride emission was measured on an ion chromatograph (IC, Metrohm 930). After 72 h degradation tests, the front images of the membranes were investigated on a SEM. To confirm the remaining cerium in the membranes, the membranes were immersed in a mixed solution (10 mL H2O 10 mL HNO3 and 2 mL 30% H2O2) at 70 °C for 2 h to dissolve ceria completely. The cerium ion concentration was measured using an inductively coupled plasma optical emission spectrometer (ICP-OES, PE Avoi500).
Cerium migration investigation
A membrane conductance cell (WonAtech Co., Ltd, MCC) was modified for cerium migration investigation. The inner two electrodes were removed, and the outer two electrodes remained to apply an electric field. The membrane samples were cut into 2 cm × 5 cm pieces and fixed in the conductance cell, and the distance between the two electrodes was 3 cm. The membrane conductance cell was assembled in a single cell fixture to create a mini space with constant temperature and humidity. The inner environment of the conductance cell was equilibrated at 60 °C and 100% RH in pure hydrogen for 2 h before an electric field was applied. A potentiostat (Solartron 1287A) was used to apply a voltage of 5 V between the two outer electrodes for a period of 5 h. The composite membranes were disassembled and cut into pieces immediately to prevent the diffusion of cerium. The cerium in the membrane pieces was dissolved via the same method used in Fenton's degradation tests, and ICP-OES was applied to confirm the relative cerium concentration distribution in the membrane after cerium migration investigation.Preparation of the membrane electrode assembly (MEA)
Since the ex situ degradation test cannot represent in situ fuel cell conditions, the membranes were assembled in MEAs for the in situ accelerated degradation tests.27To prepare catalyst ink, 500 mg Pt@C (Johnson Matthey, 60 wt%), 4.286 g Nafion D520 dispersion and a certain amount of isopropanol were mixed to form 20 mL catalyst ink. The catalyst ink was magnetically stirred in an ice bath for 24 h and ultrasonically dispersed for 30 min before spraying on gas diffusion layers (GDL, Sunrise Power Inc., China). Two pieces of 2.5 cm × 2.5 cm GDLs were cut off and purged with compressed air to clean the surface. The prepared catalyst ink was then electrostatically sprayed on both GDLs with Pt loadings of 0.4 mg cm−2 for the cathode and 0.2 mg cm−2 for the anode. The as-prepared gas diffusion electrode, PEM and two sealing PTFE gaskets were hot-pressed together at 4 MPa for 2 min to obtain MEAs.
Fuel cell tests
Single cells were assembled to evaluate the performance and durability of the MEAs. The MEAs were sandwiched in two serpentine graphite flow field plates with an active area of 6.25 cm2, and a polyvinyl chloride (PVC) ring with a thickness of 340 μm was deployed around the MEA to keep the compression ratio of the MEAs at 30%.All fuel cell tests were conducted on a fuel cell test station (Scribner 850e) equipped with an automulti-gas module. The polarization curve of each MEA was acquired at 90 °C with a 100% RH hydrogen flow rate of 200 sccm in the anode and a 100% RH air flow rate of 500 sccm in the cathode, and no backpressure was applied. Hydrogen crossover was measured by performing linear sweep voltammetry (LSV) on a potentiostat (Solartron 1287A).34 Before hydrogen crossover measurement, the cathode was purged by nitrogen with a flow rate of 200 sccm under 100% RH until the atmosphere in the cathode stabilized. Moreover, the anode was purged by hydrogen under the same conditions as those used in the polarization curve test. The cathode served as the working electrode, while the anode served as the counter electrode and reference electrode. LSV was conducted in the voltage range of 0.1–0.45 V with a scan rate of 2 mV s−1, and the current density at 0.3 V is the value of hydrogen crossover.
For the evaluation of the durability of the composite membranes, ADTs were applied by referring to the PEM combined chemical/mechanical cycling protocols of the United States Department of Energy (DOE), and the test protocols were adjusted according to laboratory conditions. Single cells were held at OCV and at 90 °C throughout the ADTs. The anode was purged by hydrogen with a flow rate of 40 sccm, while the cathode was purged by air with a flow rate of 100 sccm. Both sides were alternated between 100% RH for 45 s and 0% RH for 30 s. The ADTs were terminated when one of the following conditions was reached: (1) the OCV decrease exceeded 20%; (2) the hydrogen crossover exceeded 15 mA cm2; and (3) the ADTs reached 10![[thin space (1/6-em)]](https://www.rsc.org/images/entities/char_2009.gif) 000 cycles. The polarization curves and hydrogen crossover were recorded every 1000 cycles.
000 cycles. The polarization curves and hydrogen crossover were recorded every 1000 cycles.
Results and discussion
Characterization of ceria nanorods
The synthesis of ceria nanorods follows reaction (6) and reaction (7). According to reaction (6), hydrous CeO2 sediment is generated immediately when NaOH solution and Ce(NO3)3·6H2O are mixed, and the oxygen in the air participates in the reaction. Hydrous CeO2 starts to decompose when the hydrothermal reaction starts, and the CeO2 crystals grow along the specific crystal surface to form CeO2 nanorods, according to reaction (7). The residual Ce3+ in the solution will deposit on the surface of the CeO2 nanorods.28| 4Ce3+ + 12OH− + O2 + (4n − 6)H2O → 4CeO2·nH2O | (6) |
| CeO2·nH2O → CeO2 + nH2O | (7) |
The TEM images of ceria nanorods are shown in Fig. 2 with different scale bars, and the morphology of ceria nanorods is uniform, with few nanoparticles. Fig. 2d is a high-resolution TEM (HRTEM) image of ceria nanorods, with Fourier transform patterns embedded in the corner. The Fourier transform pattern indicates the same crystal structure as that of fluorite and excellent crystallinity, and the conclusion can be further confirmed according to the XRD patterns in Fig. 3. Note that the XRD pattern of ceria nanorods is exactly the same as that of commercial ceria nanoparticles (purchased from Macklin, 30–50 nm), indicating no transformation in crystal structure when the morphology changes.
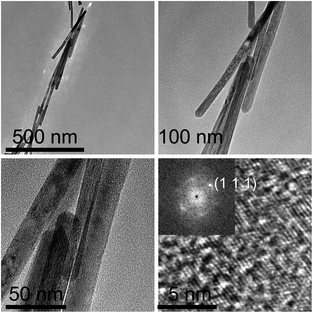 | ||
| Fig. 2 TEM images of ceria nanorods with different scale bars. The concentrations of Ce(NO3)3·6H2O solution and NaOH solution were 0.6 M and 18.4 M, respectively. | ||
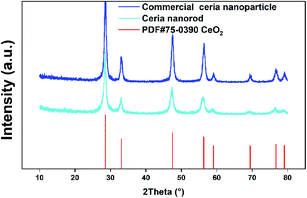 | ||
| Fig. 3 XRD patterns of commercial ceria nanoparticles, ceria nanorods and the standard PDF card of CeO2. | ||
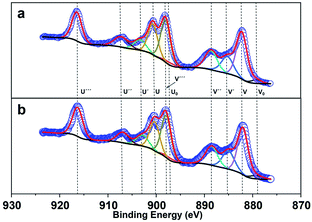
Fig. 4a and b show the Ce 3d XPS spectra of both ceria nanorods and ceria nanoparticles. The Ce3+ ions on the surface corresponds to peaks marked as U0, V0 and U′ and V′ and the peaks marked as U, V, U′′, V′′, U′′′, V′′′ can ascribe to the Ce4+ ions.35,36 The integral area of each peak was listed in Table S1,† and the ratio between the amount of cerium atoms and oxygen atoms on the surface can be calculated via formula (8) and (9).37 The Ce![[thin space (1/6-em)]](https://www.rsc.org/images/entities/char_2009.gif) :
:![[thin space (1/6-em)]](https://www.rsc.org/images/entities/char_2009.gif) O ratio on the surface is 0.5232 and 0.5251 for ceria nanoparticles and ceria nanorods, respectively, which means the similar surface of both two ceria samples.
O ratio on the surface is 0.5232 and 0.5251 for ceria nanoparticles and ceria nanorods, respectively, which means the similar surface of both two ceria samples.
 | (8) |
 | (9) |
In Fig. S2a,† both adsorption desorption isotherms are type IV, and the hysteresis loop is type H3, indicating similar surface states.38 The Brunauer–Emmett–Teller (BET) surface areas of ceria nanorods and ceria nanoparticles are 46.192 m2 g−1 and 46.612 m2 g−1, respectively. Fig. S2b† shows the pore diameter distribution of both ceriananorods and ceria nanoparticles calculated from the adsorption curve. The pores between 2 nm and 3 nm can be ascribed to the cracks on the surface for both ceria nanorods and ceria nanoparticles, while the pores at approximately 10 nm can be ascribed to the stacking of the nanoparticles. The similar BET surface area and surface morphology can ensure that all other property changes are independent of the surface area.
Characterization of composite membranes
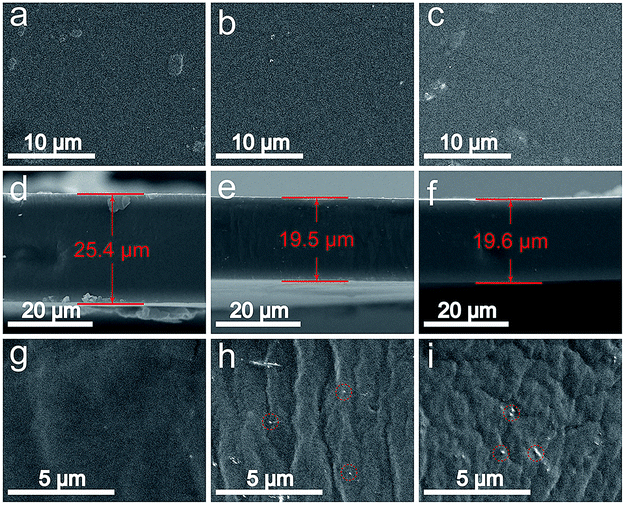
SEM images of Nafion/1% ceria nanorods, Nafion/1% ceria nanoparticles and Nafion 211 are presented in Fig. 5. No cracks or pinholes can be observed in the front SEM images in Fig. 5a–c, demonstrating the excellent quality of the membranes. Fig. 5d–f shows the cross-sectional SEM images of the membranes. The thicknesses of both Nafion/1% ceria nanoparticles and Nafion/1% ceria nanorods are 19.5–19.6 μm, indicating the high reproducibility of the casting method. Fig. 5g–i shows the partially enlarged view of Fig. 5d–f, and randomly distributed ceria nanoparticles and ceria nanorods can be seen obviously, indicating the successful fabrication of the composite membranes without severe sedimentation of ceria on the bottom side of the composite membranes.It can be expected that the addition of ceria nanorods into the Nafion matrix can enhance the mechanical properties of the composite membrane.25,39 Fig. 6 shows the stress as a function of strain for Nafion/1% ceria nanoparticles and Nafion/1% ceria nanorods. The tensile strength and elastic modulus of Nafion/1% ceria nanorods are significantly higher than those of Nafion/1% ceria nanoparticles, while the elongation at break of Nafion/1% ceria nanorods is far lower than that of Nafion/1% ceria nanoparticles. The difference between the two composite membranes is a typical phenomenon of ionomer/one-dimensional filler composite membranes.25 It can also be expected that the dimensional stability of Nafion/1% ceria nanorods is better when they absorb water.
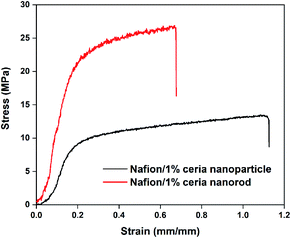 | ||
| Fig. 6 Stress as a function of strain for Nafion/1% ceria nanoparticles and Nafion/1% ceria nanorods. | ||
Ex situ Fenton's degradation tests
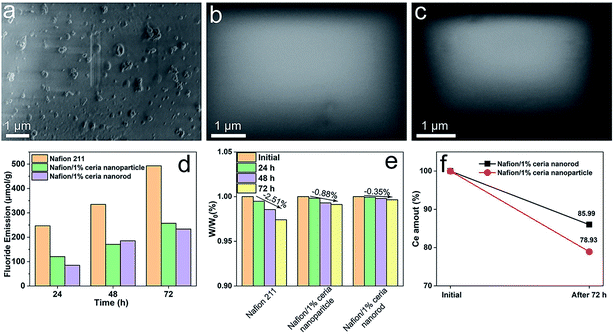
Fenton's degradation tests are a classical strategy used to evaluate the chemical durability of PEMs with no need for the fabrication of single cells.18,40–42 In this work, Fenton's degradation tests are applied to investigate the free radical scavenging property in PEMs, along with the cerium solubility and diffusion behavior in PEMs. According to Fig. 7a, the surface of Nafion 211 became rough after 72 h of degradation, indicating that Nafion 211 had been severely corroded. In Fig. 7b and c, the surface of the composite membranes remained intact after 72 h of degradation, demonstrating that ceria nanorods have a free radical scavenging efficacy similar to that of ceria nanoparticles regardless of the morphology. The fluoride emission of each membrane is plotted in Fig. 7d, and the total fluoride emission was 492.9 μmol g−1, 257.1 μmol g−1 and 233.4 μmol g−1 for Nafion 211, Nafion/1% ceria nanoparticles and Nafion/1% ceria nanorods, respectively. The weight loss throughout the degradation tests is recorded in Fig. 7e. The weight loss of Nafion 211, Nafion/1% ceria nanoparticles and Nafion/1% ceria nanorods was 2.51%, 0.88% and 0.35%, respectively, and the results are consistent with the SEM images and fluoride emission. Fig. 7f shows the cerium retention rate in the composite membranes after 72 h of degradation. The cerium retention rate is 78.93% for Nafion/1% ceria nanoparticles and 85.99% for Nafion/1% ceria nanorods. The cerium loss of ceria nanorods is 33.5% lower than that of ceria nanoparticles. Although ceria is hardly soluble in most acidic solutions except concentrated sulfuric acid and concentrated nitric acid, traces of dissolved cerium ions can exchange with protons and diffuse to electrodes, finally causing the performance loss of single cells. Thus, it is important to research the dissolution behavior of ceria. The cerium loss in this experiment can be interpreted as the combination of ceria dissolution and diffusion of cerium ions. Moreover, ceria particle movement can be excluded because there was no water flux or electric field in this system, and the amount of residual cerium ions in the PEMs can be ignored in comparison with that of ceria particles. It can be concluded that the transformation from nanoparticles to nanorods can relieve the dissolving behavior of ceria in acidic environments. In consideration of the similar BET surface areas, the solubility change can be ascribed to the change in the average curvature radius.43Cerium migration investigation
The electric field mainly causes the electromigration of charged particles, including ceria with ions absorbed on the surface, protons and cerium ions. The ions absorbed on the surface of ceria can be protons or cerium ions. The inner environment of the testing fixture was pure hydrogen to enhance charge migration in the membrane via hydrogen oxidation at the anode and hydrogen evolution at the cathode.44 The high-relative humidity environment ensured that the membranes fully absorbed water to provide a migration path for ceria particles. Fig. 8 shows the relative cerium distribution in the composite membranes after applying an electric field for 5 h. Locations 1–3 are between the two electrodes, and the electric field direction point from location 1 to location 3 and the cerium concentration for both membranes increase with decreasing potential. It is obvious that the cerium gradient of Nafion/1% ceria nanoparticles is larger than that of Nafion/1% ceria nanorods. Considering that the concentration of cerium ions can be ignored, the major species of cerium migrating in this system is ceria. Thus, it can be concluded that the one-dimensional ceria nanorods can better mitigate the migration of the overall particles than zero-dimensional ceria nanoparticles.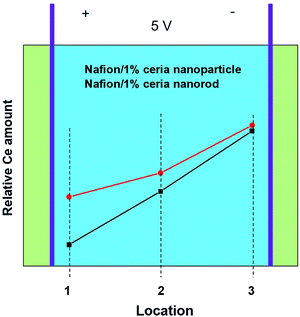 | ||
| Fig. 8 Cerium migration behavior under an electric field of 1.67 V cm−1 for 5 h at 60 °C and 100% RH. | ||
Fuel cell tests
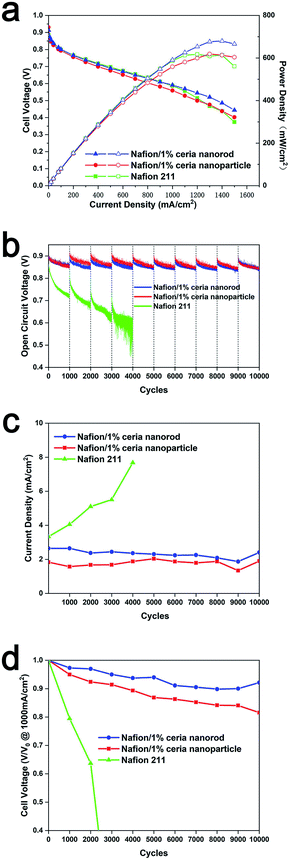
Nafion 211, Nafion/1% ceria nanoparticles and Nafion/1% ceria nanorods were assembled in single cells for all fuel cell tests, and Fig. 9a shows the polarization curves of each cell. The three cells exhibit similar performances at 1000 mA cm−2, and the power densities are 587 mW cm−2, 559 mW cm−2 and 591 mW cm−2 for Nafion 211, Nafion/1% ceria nanoparticles and Nafion/1% ceria nanorods, respectively, which are very close to each other. It was expected that the performance of a single cell containing Nafion 211 would be far better than that of the two composite membranes, but the experimental data seem inconsistent with the expectation. The inconsistency can be ascribed to the thickness and equivalent weight (EW). Nafion 211 is 30% thicker than the composite membranes, and the EW is 1100 g mol−1 and 1000 g mol−1 for Nafion 211 and the ionomer in composite membranes, both of which cause a performance reduction for Nafion 211.45 Moreover, the polarization curve of Nafion 211 drops quickly when the current density exceeds 1100 mA cm−2, while the composite membranes drop smoothly, and this phenomenon can also be ascribed to the thickness.46 The superiority in the performance of Nafion/1% ceria nanorods compared to that of Nafion/1% ceria nanoparticles can be ascribed to the aggregation of ion clusters on the surface of ceria nanorods, and the coordination between sulfonated acid groups and cerium ions on the surface of ceria can promote aggregation.47,48Since the inconsistency between ex situ Fenton's degradation tests and fuel cell durability is always concerning, it is necessary to carry out ADTs to further confirm the chemical durability of the composite membranes.27 Considering the simultaneous enhancement in the chemical durability and dimension stability of Nafion/1% ceria nanorods, combined chemical/mechanical cycle protocols were utilized to assess the composite membranes. Moreover, the frequent desiccation/moisture switch can increase the water flux in PEMs, and the migration of ceria will be accelerated.23 Fig. 9b shows the OCV curves throughout the ADTs of the three membranes. Both composite membranes exhibit excellent durability, with little OCV decay after 10![[thin space (1/6-em)]](https://www.rsc.org/images/entities/char_2009.gif) 000 cycles, while the OCV of Nafion 211 decreases severely after only 4000 cycles. The severe degradation of Nafion 211 can be ascribed to both mechanical and chemical degradation, which is consistent with the exception.26,31 However, it is unexpected that Nafion/1% ceria nanoparticles suffer little from mechanical degradation, and this phenomenon can be attributed to the water retention of ceria nanoparticles. Thus, the water uptake of the composite membranes may fluctuate less than that of Nafion 211, causing little mechanical degradation in the composite membranes. The hydrogen crossover in Fig. 9c indicates similar results as the OCV curves. The hydrogen crossover of Nafion 211 increases quickly, while the hydrogen crossover of the composite membranes remains at a relatively low value.
000 cycles, while the OCV of Nafion 211 decreases severely after only 4000 cycles. The severe degradation of Nafion 211 can be ascribed to both mechanical and chemical degradation, which is consistent with the exception.26,31 However, it is unexpected that Nafion/1% ceria nanoparticles suffer little from mechanical degradation, and this phenomenon can be attributed to the water retention of ceria nanoparticles. Thus, the water uptake of the composite membranes may fluctuate less than that of Nafion 211, causing little mechanical degradation in the composite membranes. The hydrogen crossover in Fig. 9c indicates similar results as the OCV curves. The hydrogen crossover of Nafion 211 increases quickly, while the hydrogen crossover of the composite membranes remains at a relatively low value.
Fuel cell performance is always one of the most important parameters of PEMs. During the ADTs, polarization curves were recorded every 1000 cycles, and the cell voltage at 1000 mA cm−2 was extracted as the performance value of the PEMs. Fig. 9d shows the performance value of each PEM during ADTs, and each value was normalized to the initial performance value. The performance value of Nafion 211 decreases by over 90% after 4000 cycles, indicating that Nafion 211 has been severely corroded. The performance loss of Nafion/1% ceria nanoparticles and Nafion/1% ceria nanorods is 18.4% and 7.8%, respectively, and the difference between the two composite membranes may result from cerium migration. It is generally known that cerium aggregation at both anode and cathode catalyst layers can cause performance loss.23,25,27 Cerium migration in MEAs is a combination of ceria particle movement, ceria dissolution and cerium ion migration, and the migration agent can be an electric field, concentration gradient and water flux. Thus, it is difficult to analyze a single migration mechanism of cerium in such a complicated system, and macroscopic investigation of the cerium distribution after ADTs seems to be a suitable approach in the current stage.
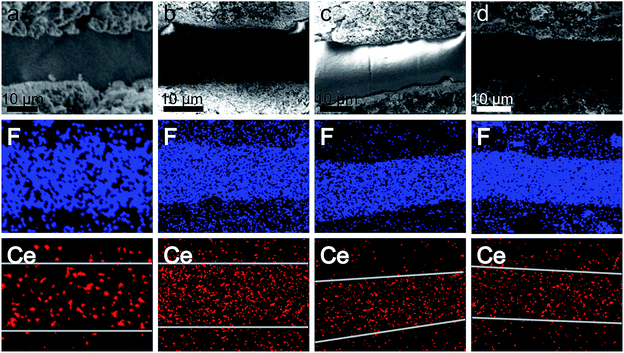
To investigate cerium migration after ADTs, the MEAs containing composite membranes were separated from single cells with the GDLs detached, which was followed by breaking off in liquid nitrogen to fabricate fresh cross-sections, and the samples were investigated by SEM and energy dispersion spectrum mapping (EDS mapping). Fig. 10 exhibits the SEM images and EDS mapping of both MEAs containing Nafion/1% ceria nanoparticles and Nafion/1% ceria nanorods before and after 10![[thin space (1/6-em)]](https://www.rsc.org/images/entities/char_2009.gif) 000 ADT cycles. Both MEAs have no obvious membrane thinning, indicating the excellent free radical scavenging properties of both ceria nanoparticles and nanorods. The EDS mapping of fluorine is presented to mark the interface between catalyst layers and PEMs. In the EDS mapping of cerium, cerium migration occurs in both composite membranes, but the relative cerium density in catalyst layers outside of Nafion/1% ceria nanoparticles is greater than that of Nafion/1% ceria nanorods, demonstrating that ceria nanorods are more stable than ceria nanoparticles in PEMs.
000 ADT cycles. Both MEAs have no obvious membrane thinning, indicating the excellent free radical scavenging properties of both ceria nanoparticles and nanorods. The EDS mapping of fluorine is presented to mark the interface between catalyst layers and PEMs. In the EDS mapping of cerium, cerium migration occurs in both composite membranes, but the relative cerium density in catalyst layers outside of Nafion/1% ceria nanoparticles is greater than that of Nafion/1% ceria nanorods, demonstrating that ceria nanorods are more stable than ceria nanoparticles in PEMs.
Conclusion
In summary, ceria nanorods were fabricated via a hydrothermal method and added into a Nafion matrix to form composite membranes. TEM, XRD, XPS and BET specific area analyses were applied to investigate the properties of ceria nanorods. Ceria nanorods were fabricated successfully with the surface state and pore diameter distribution were similar. SEM and tensile tests were used to characterize the fabricated composite membranes. The prepared membranes are of high quality, with no pinholes or cracks and uniform thickness. In addition, Nafion/1% ceria nanorods exhibit higher tensile strength and elastic modulus and lower elongation at break than Nafion/1% ceria nanoparticles. According to the single-cell polarization curve measurement, ceria nanorods in the Nafion matrix can reduce the performance loss induced by coordination between cerium ions and sulfonated acid groups. The free radical scavenging property of ceria nanorods was assessed via ex situ Fenton's degradation tests and in situ fuel cell ADTs. It has been confirmed that the change in morphology does not sacrifice the free radical scavenging property of ceria. Both performance loss and hydrogen crossover enhancement have been better mitigated with the presence of ceria nanorods than with Nafion 211. This work also focuses on the investigation of cerium migration in different environments. In ex situ Fenton's degradation tests, cerium migration can mainly be ascribed to particle dissolution. In the electric field-induced cerium migration tests, cerium migration can mainly be ascribed to particle movement. In in situ ADTs, cerium migration is the combination of ceria particle movement, ceria dissolution and cerium ion migration. All the experiments demonstrated the stability of ceria nanorods and their resistance to cerium migration. The anti-dissolving property can be ascribed to the enhancement of the average curvature radius, and particle immobilization can be ascribed to the one-dimensional structure. The stabilization of ceria can obtain two benefits: the first is to reduce the performance loss induced by cerium aggregation in the catalysts, and the second is to retain enough ceria in the PEMs to scavenge the free radicals. Throughout the ADTs, the presence of ceria nanorods can reduce the performance loss by 57.6% compared to ceria nanoparticles due to the improvement in cerium migration behavior. Therefore, it can be expected that ceria nanorods can serve as highly stable free radical scavengers in PEMs and applied to industrial-scale production.Author contributions
Rui Zhiyan: conceptualization, experimental operation and writing. Li Qingbing: assisting in experiment and writing. Huo Youxiu: data processing and writing. Ding Rui: material characterization. Liu Jia: writing and editing. Li Jia: review, editing and planning. Liu Jianguo: project administration and supervision.Conflicts of interest
There is no declaration of conflicts of interest.Acknowledgements
The authors gratefully acknowledge financial support from National Key R&D Plan of China (grant number 2017YFB0102803), National Natural Science Foundation of China (No. 21676135), the Key R&D programs in Jiangsu (No. BE2018051) and the Key R&D programs of Zhejiang Province (No. 2020C01006).References
- O. Groeger, H. A. Gasteiger and J.-P. Suchsland, J. Electrochem. Soc., 2015, 162, A2605–A2622 CrossRef CAS.
- Y. Wang, K. S. Chen, J. Mishler, S. C. Cho and X. C. Adroher, Appl. Energy, 2011, 88, 981–1007 CrossRef CAS.
- R. B. Tom Benjamin, N. Garland, G. Craig, B. Habibzadeh, S. Hirano, D. Ho and G. Kleen, Fuel Cell Technical Team Roadmap, 2017, https://www.energy.gov/sites/prod/files/2017/11/f46/FCTT_Roadmap_Nov_2017_FINAL.pdf Search PubMed.
- B. C. H. Steele and A. Heinzel, Nature, 2001, 414, 345–352 CrossRef CAS PubMed.
- S. J. Peighambardoust, S. Rowshanzamir and M. Amjadi, Int. J. Hydrogen Energy, 2010, 35, 9349–9384 CrossRef CAS.
- J. F. Wu, X. Z. Yuan, J. J. Martin, H. J. Wang, J. J. Zhang, J. Shen, S. H. Wu and W. Merida, J. Power Sources, 2008, 184, 104–119 CrossRef CAS.
- V. O. Mittal, H. R. Kunz and J. M. Fenton, J. Electrochem. Soc., 2007, 154, B652–B656 CrossRef CAS.
- L. Ghassemzadeh, K.-D. Kreuer, J. Maier and K. Mueller, J. Phys. Chem. C, 2010, 114, 14635–14645 CrossRef CAS.
- M. Zatoń, J. Rozière and D. J. Jones, Sustainable Energy Fuels, 2017, 1, 409–438 RSC.
- R. Borup, J. Meyers, B. Pivovar, Y. S. Kim, R. Mukundan, N. Garland, D. Myers, M. Wilson, F. Garzon, D. Wood, P. Zelenay, K. More, K. Stroh, T. Zawodzinski, J. Boncella, J. E. McGrath, M. Inaba, K. Miyatake, M. Hori, K. Ota, Z. Ogumi, S. Miyata, A. Nishikata, Z. Siroma, Y. Uchimoto, K. Yasuda, K.-i. Kimijima and N. Iwashita, Chem. Rev., 2007, 107, 3904–3951 CrossRef CAS PubMed.
- S. Hommura, K. Kawahara, T. Shimohira and Y. Teraoka, J. Electrochem. Soc., 2008, 155, A29–A33 CrossRef CAS.
- D. E. Curtin, R. D. Lousenberg, T. J. Henry, P. C. Tangeman and M. E. Tisack, J. Power Sources, 2004, 131, 41–48 CrossRef CAS.
- Z. Rui and J. Liu, Prog. Nat. Sci.: Mater. Int., 2020, 30(6), 732–742 CrossRef CAS.
- V. Prabhakaran, C. G. Arges and V. Ramani, Proc. Natl. Acad. Sci. U. S. A., 2012, 109, 1029–1034 CrossRef CAS.
- P. Trogadas, J. Parrondo and V. Ramani, Electrochem. Solid-State Lett., 2008, 11(7), B113–B116 CrossRef CAS.
- Z. Wang, H. Tang, H. Zhang, M. Lei, R. Chen, P. Xiao and M. Pan, J. Membr. Sci., 2012, 421–422, 201–210 CrossRef CAS.
- B. P. Pearman, N. Mohajeri, R. P. Brooker, M. P. Rodgers, D. K. Slattery, M. D. Hampton, D. A. Cullen and S. Seal, J. Power Sources, 2013, 225, 75–83 CrossRef CAS.
- B. P. Pearman, N. Mohajeri, D. K. Slattery, M. D. Hampton, S. Seal and D. A. Cullen, Polym. Degrad. Stab., 2013, 98, 1766–1772 CrossRef CAS.
- J. Hao, Y. Jiang, X. Gao, F. Xie, Z. Shao and B. Yi, J. Membr. Sci., 2017, 522, 23–30 CrossRef CAS.
- M. J. Parnian, S. Rowshanzamir, A. K. Prasad and S. G. Advani, J. Membr. Sci., 2018, 556, 12–22 CrossRef CAS.
- S. Yang and D. Kim, J. Power Sources, 2018, 393, 11–18 CrossRef CAS.
- K. H. Wong and E. Kjeang, J. Electrochem. Soc., 2019, 166, F128–F136 CrossRef CAS.
- A. M. Baker, R. Mukundan, D. Spernjak, E. J. Judge, S. G. Advani, A. K. Prasad and R. L. Borup, J. Electrochem. Soc., 2016, 163, F1023–F1031 CrossRef CAS.
- K. H. Wong and E. Kjeang, J. Electrochem. Soc., 2017, 164, F1179–F1186 CrossRef CAS.
- A. M. Baker, L. Wang, W. B. Johnson, A. K. Prasad and S. G. Advani, J. Phys. Chem. C, 2014, 118, 26796–26802 CrossRef CAS.
- M. Vinothkannan, S. Ramakrishnan, A. R. Kim, H. K. Lee and D. J. Yoo, ACS Appl. Mater. Interfaces, 2020, 12, 5704–5716 CrossRef CAS PubMed.
- K. R. Yoon, K. A. Lee, S. Jo, S. H. Yook, K. Y. Lee, I.-D. Kim and J. Y. Kim, Adv. Funct. Mater., 2019, 29(3), 1806929 CrossRef.
- A. G. M. da Silva, D. C. Batalha, T. S. Rodrigues, E. G. Candido, S. C. Luz, I. C. de Freitas, F. C. Fonseca, D. C. de Oliveira, J. G. Taylor, S. I. Córdoba de Torresi, P. H. C. Camargo and H. V. Fajardo, Catal. Sci. Technol., 2018, 8, 1828–1839 RSC.
- V. Gautham, C. Chinglenthoiba, J. John and V. Sajith, Appl. Nanosci., 2020, 10(7), 2429–2438 CrossRef CAS.
- Y. Yao, J. Liu, W. Liu, M. Zhao, B. Wu, J. Gu and Z. Zou, Energy Environ. Sci., 2014, 7, 3362–3370 RSC.
- Z. Rui, J. Wang, J. Li, Y. Yao, Y. Huo, J. Liu and Z. Zou, J. Electrochem. Soc., 2019, 166, F3052–F3057 CrossRef CAS.
- H. Wan, Y. Yao, J. Liu, Y. You, X. Li, K. Shao and Z. Zou, Int. J. Hydrogen Energy, 2017, 42, 21294–21304 CrossRef CAS.
- D. T. Sawyer, A. Sobkowiak and T. Matsushita, Acc. Chem. Res., 1996, 29, 409–416 CrossRef CAS.
- W. Liu, L. Wan, J. Liu, M. Zhao and Z. Zou, Int. J. Hydrogen Energy, 2015, 40, 7159–7167 CrossRef CAS.
- A.-R. Hwang, J.-Y. Park and Y.-C. Kang, Bull. Korean Chem. Soc., 2011, 32, 3338–3342 CrossRef CAS.
- W. Li, X. Shen, R. Zeng, J. Chen, W. Xiao, S. Ding, C. Chen, R. Zhang and N. Zhang, Appl. Surf. Sci., 2019, 492, 818–825 CrossRef CAS.
- P. Bera and C. Anandan, RSC Adv., 2014, 4, 62935–62939 RSC.
- K. Ketpang, K. Lee and S. Shanmugam, ACS Appl. Mater. Interfaces, 2014, 6, 16734–16744 CrossRef CAS PubMed.
- P. Kallem, N. Yanar and H. Choi, ACS Sustainable Chem. Eng., 2019, 7, 1808–1825 CrossRef CAS.
- S.-H. Shin, A. Kodir, D. Shin, S.-H. Park and B. Bae, Electrochim. Acta, 2019, 298, 901–909 CrossRef CAS.
- Y. Park and D. Kim, J. Membr. Sci., 2018, 566, 1–7 CrossRef CAS.
- C. H. Park and C. H. Lee, Macromol. Res., 2014, 23, 45–52 CrossRef.
- D. Banham, S. Ye, T. Cheng, S. Knights, S. M. Stewart, M. Wilson and F. Garzon, J. Electrochem. Soc., 2014, 161, F1075–F1080 CrossRef CAS.
- A. M. Baker, S. K. Babu, R. Mukundan, S. G. Advani, A. K. Prasad, D. Spernjak and R. L. Borup, J. Electrochem. Soc., 2017, 164, F1272–F1278 CrossRef CAS.
- K. A. Mauritz and R. B. Moore, Chem. Rev., 2004, 104, 4535–4585 CrossRef CAS PubMed.
- T. Susai, M. Kaneko, K. Nakato, T. Isono, A. Hamada and Y. Miyake, Int. J. Hydrogen Energy, 2001, 26, 631–637 CrossRef CAS.
- J. Li, Q. Zhang, S. Peng, D. Zhang, X. Yan, X. Wu, X. Gong, Q. Wang and G. He, J. Membr. Sci., 2019, 583, 93–102 CrossRef CAS.
- Y. Yao, Z. Lin, Y. Li, M. Alcoutlabi, H. Hamouda and X. Zhang, Adv. Energy Mater., 2011, 1, 1133–1140 CrossRef CAS.
Footnote |
| † Electronic supplementary information (ESI) available. See DOI: 10.1039/d1ra05026e |
| This journal is © The Royal Society of Chemistry 2021 |

