 Open Access Article
Creative Commons Attribution 3.0 Unported Licence
Hierarchical hyper-branched titania nanorods with tuneable selectivity for CO2 photoreduction†
Gavrielides Stelios ,
Jeannie Z. Y. Tan
 * and
M. Mercedes Maroto-Valer
 *
*
Research Centre of Carbon Solutions (RCCS), School of Engineering & Physical Sciences, Heriot–Watt University, Edinburgh, UK. E-mail: J.Tan@hw.ac.uk; M.Maroto-Valer@hw.ac.uk
First published on 28th September 2021
Abstract
Utilising captured CO2 and converting it into solar fuels can be extremely beneficial in reducing the constantly rising CO2 concentration in the atmosphere while simultaneously addressing energy crisis issues. Hence, many researchers have focused their work on the CO2 photoreduction reaction for the last 4 decades. Herein, the titania hyper-branched nanorod (HBN) thin films, with a novel hierarchical dendritic morphology, revealed enhanced CO2 photoreduction performance. The HBNs exhibited enhanced photogenerated charge production (66%), in comparison with P25 (39%), due to the unique hyper-branched morphology. Furthermore, the proposed HBN thin films exhibited a high degree of control over the product selectivity, by undergoing a facile phase-altering treatment. The selectivity was shifted from 91% towards CO, to 67% towards CH4. Additionally, the HBN samples showed the potential to surpass the conversion rates of the benchmark P25 TiO2 in both CO and CH4 production. To further enhance the selectivity and overall performance of the HBNs, RuO2 was incorporated into the synthesis, which enhanced the CH4 selectivity from 67% to 74%; whereas the incorporation of CuO revealed a selectivity profile comparative to P25.
Introduction
CO2 photoreduction is one of the promising carbon neutral energy sources, which has the potential to produce solar fuels, such as CH4 and CO, by using water as an electron donor and light as the input of energy.1,2 However, CO2 photoreduction is a thermodynamically unfavourable process, which requires a large energy input to stimulate the occurrence of the reduction reaction.3 The main challenge for CO2 photoreduction is the limited light energy absorbance in addition to the high stability of the CO2 molecule, and thus high energy input is required for this conversion (1498 kJ mol−1).4 Consequently, the fabrication of highly efficient photocatalysts becomes a very important task.TiO2 is the most extensively used photocatalyst for photocatalysis as well as CO2 photoreduction, accounting for roughly 40% of the publications on CO2 photoreduction.5–11 The main advantages of TiO2 are its chemical and thermal stability, high charge transfer potential, abundance, non-toxicity and cost.12–14 TiO2 has a relatively wide band gap, which allows for an effective redox potential for CO2 photoreduction, but at the same time limits the range of electromagnetic radiation wavelengths that it can absorb. Hence, the wide band gap and the consequent wavelength absorption limitation is considered the main challenge for TiO2.12,15 Foreign element doping, semiconductor coupling, and photosensitisation are amongst the most popular methods implemented to expand the light absorbance and improve the photocatalytic performance of TiO2.16 Despite the fact that morphological alterations wouldn't widen the range of wavelengths that can be absorbed by the photocatalyst, morphology still is an important parameter and it has the potential to improve the amount of light absorbed, increase the surface area and thereby expose more active sites.
The morphological alterations of 3D hierarchical TiO2 nanostructures have received considerable attention as they were found to enhance the photocatalytic performance.17 This was attributed to the synergistic benefits of their complex structure, which is composed from basic nanoscale building blocks that preserve their unique individual properties (i.e., 0D spheres, 1D nanorods, 2D sheets, etc.). Such 3D hierarchical structures, which consists of 1D building blocks that are combined to form 3D super-structures, have been reported to enhance light harvesting due to light scattering effects, increase surface area and improved charge transport.18–22
The effects of morphological design for CO2 photoreduction is demonstrated herein using hierarchical 1–3D TiO2 Hyper-Branched Nanorod (HBNs) grown on Fluorine–Tin Oxide (FTO) conductive glass. The unique morphology of the HBNs microstructures revealed a significant increase of light absorption due to increased number of exposed active sites and light scattering effects. Hence, the fabricated HBNs showed high photocatalytic performance in CH4 and CO production under visible light irradiation. Interestingly, the fabricated HBNs demonstrated the ability to shift and increase the product selectivity through a facile protonation treatment. The best performing sample has demonstrated an internal quantum efficiency of ΦCH4 = 69%.
Experimental procedure
Materials & synthesis
Potassium titanium oxide oxalate dihydrate (PTO, ≥98.0%), diethylene glycol (DEG, 99.0%), bis(cyclopentadienyl)ruthenium ((C5H5)2Ru, 98.0%), copper(II) acetate (Aldrich, 98%), n-hexane (C6H14, 95.0%). Isopropanol (IPA, 99.5%), acetone (>95.0%) and ethanol (99.0%) were procured from Fisher Scientific. All chemicals were used without any further purification. All aqueous solutions were prepared using Milli-Q ultrapure type 1 water (18.2 MΩ.cm) collected from a Millipore system. Fluorine-doped tin oxide (FTO) TEC-15 glass was purchased from Ossila (2.5 cm × 2.5 cm, roughness of 12.5 nm, FTO layer thickness of 200 nm, 83.5% transmission and resistivity of 12–14 Ω cm−1).Before the use of the FTO glass slides, they were cleaned using a solution of H2O, IPA, and Acetone in a ratio of 1![[thin space (1/6-em)]](https://www.rsc.org/images/entities/char_2009.gif) :
:![[thin space (1/6-em)]](https://www.rsc.org/images/entities/char_2009.gif) 1
1![[thin space (1/6-em)]](https://www.rsc.org/images/entities/char_2009.gif) :
:![[thin space (1/6-em)]](https://www.rsc.org/images/entities/char_2009.gif) 1. The glass was submerged into the solution and sonicated for 1 h. The glass was then dried at 75 °C for 30 min.
1. The glass was submerged into the solution and sonicated for 1 h. The glass was then dried at 75 °C for 30 min.
Titania hyper-branched nanorods (HBNs BP) were fabricated using a hydrothermal approach. Similar synthesis has been performed in our previous studies.23 PTO was dissolved in a mixture of H2O and DEG in a 1![[thin space (1/6-em)]](https://www.rsc.org/images/entities/char_2009.gif) :
:![[thin space (1/6-em)]](https://www.rsc.org/images/entities/char_2009.gif) 7 ratio. The concentration of PTO was 0.05 M. The precursor solution was stirred for 30 min before it was transferred to a 100 mL Teflon-lined autoclave along with the FTO glass. The FTO glass was resting against the Teflon-liner walls with the conductive side facing down at approximately 60°. The hydrothermal synthesis was carried out at 180 °C for 9 h. The autoclave was allowed to cool down to room temperature and the titania HBNs were rinsed several times using Milli-Q, water and ethanol. The rinsed samples were then calcined at atmospheric conditions at 550 °C for 1 h. This sample was depicted as HBNs BP, which stands for “before protonation”.
7 ratio. The concentration of PTO was 0.05 M. The precursor solution was stirred for 30 min before it was transferred to a 100 mL Teflon-lined autoclave along with the FTO glass. The FTO glass was resting against the Teflon-liner walls with the conductive side facing down at approximately 60°. The hydrothermal synthesis was carried out at 180 °C for 9 h. The autoclave was allowed to cool down to room temperature and the titania HBNs were rinsed several times using Milli-Q, water and ethanol. The rinsed samples were then calcined at atmospheric conditions at 550 °C for 1 h. This sample was depicted as HBNs BP, which stands for “before protonation”.
Hyper-branched nanorods (HBNs) protonation treatment was performed after the calcination of the previous step. The as-prepared HBNs BP were allowed to naturally cool down to room temperature and were then submerged in ethanolic HCl (0.04 M) for 3 h and aqueous HCl (0.02 M) for another 3 h, with mild agitation. The HCl solution was replaced with fresh HCl solution every 1 h. Following this procedure, the as-prepared thin-films were rinsed with both ethanol and DI water several times and were submerged in ethanol for another 1 h in mild agitation. They were then dried in the oven at 70 °C overnight before another calcination at atmospheric conditions at 400 °C for 2 h. The resulted sample was depicted as HBNs AP.
Synthesis of RuO2 loaded HBN (RuO2-HBNs) was synthesized under dry nitrogen atmosphere, in a custom-made glove box. Bis(cyclopentadienyl)ruthenium (C5H5)2Ru, was dissolved in n-hexane (C6H14) to achieve a molar concentration of 0.005 M and stirred vigorously at atmospheric temperature for 1.5 h until a clear solution was obtained. The HBNs AP loaded glass-slide was then placed into the Teflon liner resting against its walls at 60° as described before, with the coated surface facing down. The ruthenium precursor liquid was added to the Teflon-liner to cover the entire FTO glass surface (25 mL). The Teflon liner was then transferred into the autoclave and was placed in the oven at 180 °C for 30 h. The Ru–TiO2 FTO glass was then rinsed with n-hexane and calcined to 400 °C for 10 h with a ramp rate of 10 °C min−1.
Synthesis of CuO loaded TiO2 (CuO-HBNs) was synthesised using copper(II) acetate, which was dissolved in 50 mL of ethanol at a concentration of 0.005 M. The solution was stirred for 30 minutes. Then 2 mL of NaOH was added dropwise and stirred for another 60 min, obtaining the final solution that was used to fabricate the CuO-HBNs thin film. The Cu precursor solution was transferred to a 100 mL Teflon-lined autoclave along with the HBNs AP loaded FTO glass. The glass was positioned resting against the Teflon-liner walls with the coated side facing down at approximately 60°. The solvothermal treatment was carried out at 150 °C for 5 h. The autoclave was allowed to cool down to room temperature, and the CuO-HBNs slides were rinsed with ethanol and then calcined to 400 °C for 10 h with a ramp rate of 10 °C min−1.
Characterization
Crystallinity and phase identification of the synthesized products were conducted using powder X-ray diffraction XRD (Bruker D8 Advanced diffractometer) equipped with Cu Kα radiation (λ = 1.5418 Å) and compared with the ICDD-JCPDS powder diffraction file database. The morphological features of the synthesized samples were examined by a field emission scanning electron microscope (FE-SEM, FEI Quanta 200 F). Further investigation on the morphology at higher magnification and the element composition of the samples was carried out using a high-resolution transmission electron microscope (HR-TEM, FEI Titan Themis 200) equipped with an energy dispersive X-ray spectroscope (EDX) detector operated at 200 kV. The sample for HR-TEM analysis was prepared by gently removing the coating off the FTO glass surface. And then, the powder obtained was suspended in ethanol shaken vigorously for 5 minutes until a cloudy solution was achieved, then a few drops of the solution were placed on a carbon-coated nickel TEM grid and was left to dry in atmospheric conditions. Crystallinity and phase identification of the synthesized products were performed using Raman, which were recorded using a Renishaw inVia Raman Microscope with 785 nm excitation source. The diffuse reflectance was measured using a PerkinElmer Lambda 950 UV-vis equipped with an integrating sphere (150 mm) and the band gap energy was estimated using the Kubelka Munk function. X-ray photoelectron spectroscopy (XPS) was performed on Scienta 300 XPS machine incorporating with a rotating Al Kα X-ray source operating at 13 kV × 333 mA (4.33 kW). Electron analysis was performed using a 300 cm radius hemispherical analyser and lens system. The electron counting system consist of a multichannel plate, phosphorescent screen and CCD camera. All multichannel detection counting is done using proprietary Scienta software. The elements present were determined via a wide energy range survey scan (200 mW step, 20 ms dwell time, 150 eV pass energy and summed over 3 scans). The high-resolution scans were performed at a similar pass energy (150 eV), but a step size of 20 mV. A dwell time of 533 ms was used and accumulated over 3 scans. The instrument operated at a base pressure of 1 × 10⁻⁹ mbar; the energy scale is calibrated using the Au 4f, Ag 3d and Cu 2p emission lines, where the half width of the Au 4f7 emission line is approximately 1.0 eV. All data analysis and peak fitting were performed using the CaseXPS software. The photon flux was measured by using the spectroradiometer (Apogee-200 from Apogee Instruments), at a set distance of 20 cm from the light source (OmniCure S2000) that was used in the CO2 photoreduction reaction. The blank measurement was performed using a blank FTO glass. The quantum efficiency measurement of CO and CH4 were calculated using eqn (1) and (2), respectively. The average production value was used for the internal quantum efficiency measurement of each product.
 | (1) |
 | (2) |
Photocatalytic test
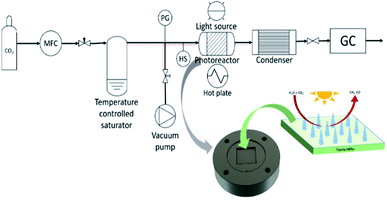
The CO2 photoreduction were performed using the experimental set-up as described in previous work.24 Briefly, the FTO glass samples were inserted into the cut-out slot of the photoreactor as shown on Fig. 1. Before each photocatalytic test, a purge and equilibration regime was followed, where the system was placed under vacuum (−100 kPa) and then the vacuum was released with CO2 (99.995%) until it reached 100 kPa of pressure. The pressure was then released through the injection port of the gas chromatograph (GC, Agilent, Model 7890B series). This process was repeated three times and on the final repetition the system was left with a CO2 flow rate of 0.35 mL min−1 passing through a temperature-controlled saturator for at least 16 h (overnight) to allow the system to equilibrate. Relative humidity (±1.8% RH) was measured using an inline Sensirion SHT75 humidity sensor embedded (MG Chemicals 832HD) nested into a Swagelok 1/4′′ T-piece. The temperature of the photoreactor (40 °C) was controlled using a hot plate and the surface of the photocatalyst measured using a Radley's pyrometer (±2.0 °C). An OmniCure S2000 light source (300–600 nm wavelength) was placed 30 mm above the surface of the investigated sample. Irradiance (150 mW cm−2) at the end of the fiber optic light guide was measured before each experiment using an OmniCure R2000 radiometer (±5%). An inline GC with a Hayesep Q column (1.5 m, 1/16 inch OD, 1 mm OD), Molecular Sieve 13X (1.2 m, 1/16-inch OD, 1 mm ID), thermal conductivity detector (TCD), nickel catalyzed mechanizer, and flame ionization detector (FID) was used to analyze the output of the photoreactor every four min. The GC was calibrated using 1000 ppm calibration gas (H2, CO, O2 and CH4 in Ar balance). It was then further diluted with Ar (99.995%) using mass flow controllers to 17.04, 4.62 and 1 ppm using the FID detector for CH4 and CO, respectively, and 69.49, 34.72 and 17.04 ppm using the TCD detector for H2 and O2.Control experiments were carried using all the fabricated samples to investigate the genuine production of carbonaceous products from CO2.
(1) CO2 was replaced with N2;
(2) Light source was turned off.
Other experimenting parameters were unchanged.
Results and discussion
The titania HBNs were fabricated using a facile hydrothermal treatment on conductive FTO glass slides. The XRD pattern of HBNs BP evidenced the presence of anatase and K2Ti4O9 (Fig. 2a). After the protonation treatment, K2Ti4O9 was removed, leaving only anatase phase within the sample HBNs AP. Due to the weak signal in XRD, Raman spectroscopy was utilised to investigate the crystallinity and crystal phase of the samples (Fig. 2b). Raman signal responds to spatial order, associated with crystalline structures, with a sharp peak and narrow bands, whereas amorphous solids and their lack of spatial order in the crystal lattice translates to broad peak signals.25 The as-prepared HBNs BP sample exhibited mainly potassium titanate features shown at 188, 279, 441 and 652 cm−1.26 Meanwhile, a weak signal of the anatase phase feature was observed at 143, 395, 517, and 638 cm−1 associated with the Eg, B1g, A1g, and Eg vibrations, respectively.23 Potassium titanate was the dominant phase and the relative ratio of potassium titanate to anatase was estimated at 7![[thin space (1/6-em)]](https://www.rsc.org/images/entities/char_2009.gif) :
:![[thin space (1/6-em)]](https://www.rsc.org/images/entities/char_2009.gif) 1.
1.
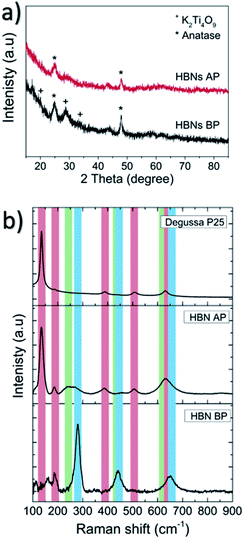 | ||
| Fig. 2 X-ray diffraction pattern for the as prepared HBNs BP and HBNs AP (a), Raman spectra of the fabricated samples with potassium titanates (blue), anatase (red) and rutile (green) components (b). | ||
The HBNs BP was treated with a facile protonation treatment forming HBNs AP. As a result, a phase shift was observed, in which the anatase phase (i.e., 143, 395, 517, and 638 cm−1, Fig. 2) was shown the dominant phase. The relative ratio of potassium titanate to anatase was reduced to 1![[thin space (1/6-em)]](https://www.rsc.org/images/entities/char_2009.gif) :
:![[thin space (1/6-em)]](https://www.rsc.org/images/entities/char_2009.gif) 10. Additionally, traces of rutile phase were spotted at 442 and 631 cm−1, attributing to the use of HCl acid.26 Degussa P25, which is used as the benchmark sample in this study was also characterised as shown in Fig. 2.
10. Additionally, traces of rutile phase were spotted at 442 and 631 cm−1, attributing to the use of HCl acid.26 Degussa P25, which is used as the benchmark sample in this study was also characterised as shown in Fig. 2.
The as-prepared HBNs samples showed homogeneous and full coverage of coating on the surface of the FTO glass (Fig. 3a–c). A dendritic microstructure (3–5 μm in height) was revealed, decorated with numerous nano-branches growing along the dendrites. The growth orientation was generally upwards with a chaotic directionality of the nano-branches. The width and length of the nano-branches were ∼5–20 and 50–350 nm, respectively (Fig. 3d–g).23,27,28
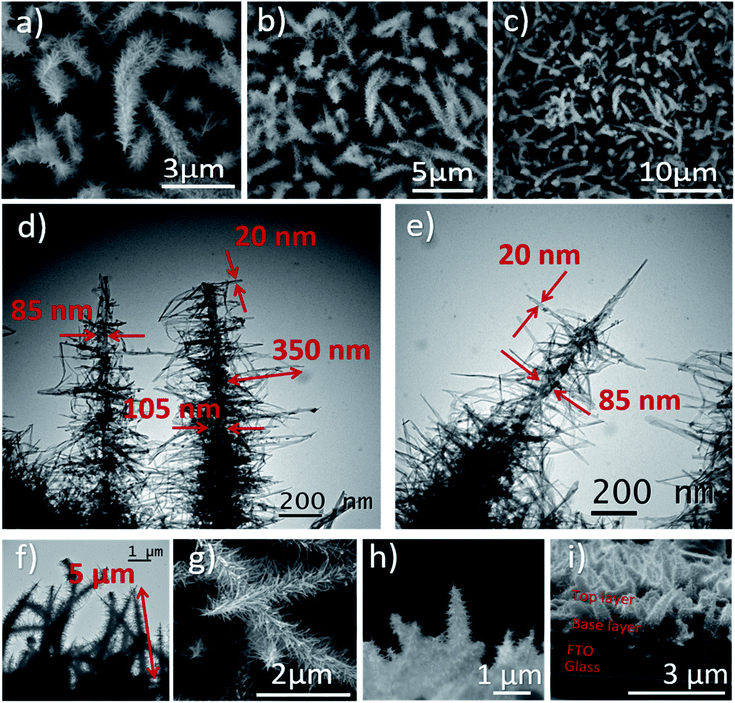 | ||
| Fig. 3 The HBNs BP sample under SEM (a–c) and TEM (d–f). The top view (g) and cross-section (h and i) of HBNs AP sample under SEM. | ||
After the protonation treatment, no significant changes were observed in the morphology of the HBNs structure (Fig. 3g) and the thin film remained intact. Prior to the subsequent calcination, the titanate phase of the thin film remained as the dominant phase (Fig. S1†) and exhibited a polycrystalline structure under SAED examination (Fig. 4a). After the calcination, the polycrystalline titanate phase was significantly reduced and a highly crystallised c-axis elongated anatase phase emerged (Fig. 4b). As a result of protonation treatment and calcination processes, the formation of pores was observed on the nano-branches and dendrites (Fig. 4c and d). Hence, the mechanism of protonation was proposed. During the protonation treatment, ionic exchange reaction took place, in which potassium titanate converted to protonated-titanate. Then, the subsequent calcination treatment resulted the protonated titanate to re-organise into anatase phase of TiO2 as observed in the Raman spectra (Fig. S1†) and the re-organisation created the observed porosity (Fig. 4d).26,29
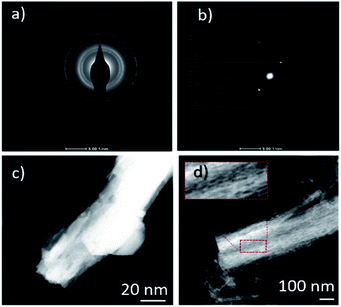 | ||
| Fig. 4 SAED pattern and TEM images of HBNs BP (a and c, respectively) and HBNs AP (b and d, respectively). | ||
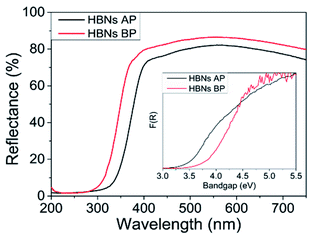
The optical properties of the HBNs were analysed using UV-vis and spectroradiometry. The HBNs BP sample showed higher reflectance compared to the HBN AP, indicating the latter possessed higher optical properties than the former (Fig. 5). Moreover, the cut-off wavelength of the HBNs AP was longer than HBNs BP, implying a band gap narrowing after the protonation treatment. The band gap of the HBNs BP was estimated at 3.7 eV; whereas after protonation treatment, the band gap was reduced to 3.4 eV. This was attributed to the shift from titanates to anatase phase. The photon flux of HBNs AP increased from 39.8 (i.e., HBNs BP sample) to 48.2 μmol m−2 under irradiation of visible light in the range of 300–600 nm. The increase of photon flux could be explained by the band gap narrowing as shown in the UV-vis results, in which more photogenerated charges were excited to the conduction band and available for the CO2 photoreduction reaction. Meanwhile, the benchmark P25 showed a photon flux of 28.6 μmol m−2. Hence, the effective photon flux for the photocatalytic reaction obtained from the HBNs BP, HBNs AP and P25 samples were 54, 66 and 39%, respectively. As expected, the amount of light absorbed by the HBNs microstructures was significantly higher than P25 due to the unique morphology of the HBNs even though P25 possessed a narrower band gap.
The CO2 photoreduction reaction was performed using a custom-made reactor designed for the FTO glass and was connected and analysed using GC (Fig. 1).24,30,31 The HBNs BP exhibited a cumulative conversion of CO at 7.9 μmol gcat−1 h−1. On the other hand, it exhibited a very low selectivity towards CH4 (9%) and produced only 0.4 μmol gcat−1 h−1 of CH4 in contrast to 6.9 μmol gcat−1 h−1 for P25. Although the overall conversion of HBNs BP was the lowest among the samples, the superior selectivity towards CO resulted the highest production of CO. HBNs AP displayed a selectivity shift towards CH4 (67%), producing the highest cumulative conversion of CH4 (8.7 μmol gcat−1 h−1, Table 1) surpassing both the P25 and HBNs BP sample. Therefore, the HBNs had shown great flexibility in adjusting the product selectivity by treating the sample using a facile protonation step. It is worth noting that the HBNs AP with dominating anatase phase had shown significantly higher photocatalytic activity compared to the titanate rich HBNs BP. This was attributed to the higher charge transfer potential associated with the anatase phase of TiO2 as well as the porosity formed which provides easy access to the surface of the material.32 To the best of the authors knowledge, the utilisation of a simple protonation step to alter the selectivity of the HBN material for CO2 photoreduction has not been reported in the literature.
| Sample name | CH4 selectivity (%) | CH4 cumulative production (μmol gcat−1 h−1) | CO selectivity (%) | CO cumulative production (μmol gcat−1 h−1) |
|---|---|---|---|---|
| HBNs BP | 9 | 0.4 | 91 | 7.9 |
| HBNs AP | 67 | 8.7 | 33 | 4.3 |
| Degussa P25 | 56 | 6.9 | 44 | 5.1 |
| RuO2-HBNs | 74 | 5.2 | 26 | 1.8 |
| CuO-HBNs | 53 | 2.5 | 47 | 2.2 |
To further investigate the potential of the already modified selectivity and performance of the as-prepared photocatalyst, the HBNs microstructures were loaded with RuO2 and CuO, respectively and the photoreduction results are shown in Table 1. The best performing HBNs AP sample (i.e., in terms of cumulative overall conversion), was employed for the synthesis of the RuO2-HBNs and CuO-HBNs samples. HBNs AP, RuO2-HBNs and CuO-HBNs were examined under Raman and revealed very similar peaks of predominantly anatase, weak signals of potassium titanate and traces of rutile.
However, no Ru or Cu related peaks could be identified (Fig. S2†). This could be attributed to the low concentration of the RuO2 and CuO as well as highly dispersed clusters of these foreign elements.23,33 The microstructure of RuO2-HBNs and CuO-HBNs did not show significant changes after the loading of RuO2 and CuO.
The CuO-HBNs samples revealed some dangling nanoparticles (50–150 nm) attached to the tips of the nano-branches of the HBNs (Fig. 6a and b). These particles were evidenced as Cu nanoparticles under the elemental analysis of HR-TEM (Fig. 6c–f). Upon closer inspection of RuO2-HBNs under HR-TEM, some nanoparticles (50–60 nm) were found loaded on the HBNs structures (Fig. 6g–i). Elemental analysis was performed to identify the elemental composition of the observed nanoparticles on the sample. Ru element was spotted and identified on the HBNs while Ti and O were identified as the dominant elements of the HBN structure (Fig. 6i–l).
Further insight regarding elemental composition was acquired utilising XPS. The XPS results showed that the loaded Cu and Ru was 3 and 1 at%, respectively. The Ru 3d5/2 peak was found at 280.7 eV, which is associated to Ru4+, evidencing the presence of RuO2 nano-particles on the RuO2-HBNs sample (Fig. 7b).34,35 Regarding the CuO-HBNs sample, the Cu 2p3/2 peak emerged at 932.9 eV and was attributed to Cu2+, which led to the conclusion that the observed dangling particles were CuO nanoparticles (Fig. 7c). The Ti 2p with 5.7 eV of spacing between Ti 2p1/2 and 2p2/3 evidenced the presence of TiO2. The Ti 2p, O 1s as well as the adventitious carbon C 1s peaks were found in all samples as expected under X-ray photoelectron spectroscopy.36 A weak signal of K 2p was observed even after the protonation treatment on the survey scan for both samples, (Fig. S3†) showing some amount of potassium was still present in the sample as it was also confirmed by the Raman investigation.37
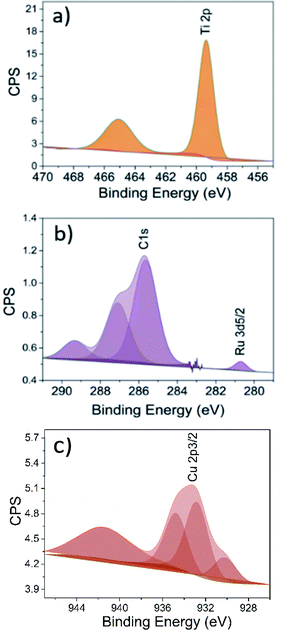 | ||
| Fig. 7 XPS analysis, magnification of the peaks (a) Ti 2p of HBNs AP, (b) Ru 3d5/2 of RuO2-HBNs and (c) Cu 2p3/2 of CuO-HBNs samples. | ||
The optical properties were examined using UV-Vis and spectroradiometer measurements. The RuO2-HBNs exhibited a very similar reflectance to the HBN-AP, possibly because of the very low concentration of RuO2 on the sample. However, CuO-HBNs has shown increased light absorption in the 350–800 nm range (Fig. 5). The band gap energy of was estimated at 3.4 eV for all the samples as can be seen in the inset of Fig. 5. The spectroradiometer measurements have shown the RuO2-HBNs to have slightly reduced photon flux 45 μmol m−2 when compared to the HBNs AP 48.2 μmol m−2. However, the CuO-HBNs exhibited increased photon flux at 54.2 μmol m−2. The results acquired from the GC for RuO2-HBNs and CuO-HBNs are shown in Table 1. The RuO2-HBNs sample has shown further increase on the CH4 selectivity to 74% compared to HBNs AP sample (67%). However, a reduction in conversion yield was observed in RuO2-HBNs (i.e., from 8.7 μmol gcat−1 h−1 to 5.2 μmol gcat−1 h−1 in HBNs AP). This was attributed to the reduced photon flux observed under the spectroradiometer measurements when compared with HBNs AP. The improved product selectivity towards CH4 as exhibited in RuO2-HBNs was attributed to the effective charge separation, and suppressed electron–hole recombination, allowing more photogenerated electrons to participate in CO2 photoreduction reaction, consequently amplifying the multi-electron conversion of CH4 as opposed to the 2-electron conversion of CO.38–41
An altered selectivity profile was observed with the incorporation of CuO for CuO-HBNs where CH4 selectivity was decreased compared to HBNs AP. The incorporation of CuO have been reported to improve optical performance and to have the potential to facilitate charge migration.42 Despite the improved optical performance observed, the CuO-HBNs exhibited a modest overall conversion even though the loading composition was higher than RuO2-HBNs. This was attributed to the CuO functioning as a recombination centre thereby prohibiting the reaction flow most likely due to the agglomerated relatively large ∼300 nm CuO particles observed in Fig. 6a–f. Researchers have previously reported CuO loading acting as a recombination centre resulting in reduced conversion rates.16,33,43,44 It has also been reported that excessive CuO loading could result in masking the illuminated TiO2 surface therefore reducing conversion rates.16,35 Control experiments were conducted as described in the experimental procedure section and no or only trace amount of products was observed on the GC.
Conclusions
A facile protonation treatment has demonstrated the ability to tune the product selectivity of CO2 photoreduction under 300–600 nm of light irradiation. The hierarchical 1–3D nanostructured HBNs had significantly improved the optical properties of TiO2, in which the HBNs possessed 66% of photon flux while P25 only showed 39% under 300–600 nm of irradiation. The proposed protonation treatment was able to manipulate the product selectivity of the as-prepared HBNs from 91% towards CO to 67% towards CH4. As a result, as-prepared HBNs exhibited the highest production of CO, whereas the HBNs AP had the highest production of CH4. Additionally, the overall conversion of HBNs AP was the highest amongst other samples and achieved an overall quantum efficiency of 77%. The RuO2 loaded HBNs AP managed to further increase the CH4 selectivity to 74%. CuO loaded HBNs showed drastic increased in light absorption with comparative selectivity performance as P25. Overall, the titania HBN thin films have shown to be a high performing and highly versatile nanostructured material with great flexibility in terms of selectivity for CO2 photoreduction.Author contributions
Stelios Gavrielides: conceptualisation, methodology, data curation, writing the original draft. Jeannie Z. Y. Tan: conceptualisation, methodology, writing-review & editing, supervision. M. Mercedes Maroto-Valer: supervision.Conflicts of interest
There are no conflicts to declare.Acknowledgements
The authors thank the financial support provided by the Engineering and Physical Sciences Research Council EP/K021796/1 and CRITICAT Centre for Doctoral Training for financial support [PhD studentship to SG; Grant code: EP/L016419/1] and the Research Centre for Carbon Solutions (RCCS) at Heriot-Watt University. The electron microscopy facility in the School of Chemistry, University of St. Andrews, which is supported by the EPSRC Capital for Great Technologies Grant EP/L017008/1, is acknowledged.Notes and references
- X. Chang, T. Wang and J. Gong, Energy Environ. Sci., 2016, 9, 2177–2196 RSC.
- L. Liu, C. Zhao, J. Xu and Y. Li, Appl. Catal., B, 2015, 179, 489–499 CrossRef CAS.
- F. E. Osterloh, ACS Energy Lett., 2017, 2, 445–453 CrossRef CAS.
- W. A. Thompson, E. Sanchez Fernandez and M. M. Maroto-Valer, ACS Sustainable Chem. Eng., 2020, 8, 4677–4692 CrossRef CAS.
- R. Shankar, M. Sachs, L. Francàs, D. Lubert-Perquel, G. Kerherve, A. Regoutz and C. Petit, J. Mater. Chem., 2019, 7, 23931–23940 RSC.
- T. W. Woolerton, S. Sheard, E. Reisner, E. Pierce, S. W. Ragsdale and F. A. Armstrong, J. Am. Chem. Soc., 2010, 132, 2132–2133 CrossRef CAS PubMed.
- J. Núñez, V. A. de la Peña O'Shea, P. Jana, J. M. Coronado and D. P. Serrano, Catal. Today, 2013, 209, 21–27 CrossRef.
- C. Wang, R. L. Thompson, P. Ohodnicki, J. Baltrus and C. Matranga, J. Mater. Chem., 2011, 21, 13452–13457 RSC.
- Art Leaf Database – CO2 Valorization by Artificial Photosynthesis, http://www.artleafs.eu, accessed, 2021 Search PubMed.
- S. N. Habisreutinger, L. Schmidt-Mende and J. K. Stolarczyk, Angew. Chem., Int. Ed., 2013, 52, 7372–7408 CrossRef CAS.
- J. Z. Y. Tan, Y. Fernández, D. Liu, M. Maroto-Valer, J. Bian and X. Zhang, Chem. Phys. Lett., 2012, 531, 149–154 CrossRef CAS.
- J. Schneider, M. Matsuoka, M. Takeuchi, J. Zhang, Y. Horiuchi, M. Anpo and D. W. Bahnemann, Chem. Rev., 2014, 114, 9919–9986 CrossRef CAS PubMed.
- H. J. Yun, H. Lee, J. B. Joo, N. D. Kim, M. Y. Kang and J. Yi, Appl. Catal., B, 2010, 94, 241–247 CrossRef CAS.
- Q. Zhang, Y. Li, E. A. Ackerman, M. Gajdardziska-Josifovska and H. Li, Appl. Catal., A, 2011, 400, 195–202 CrossRef CAS.
- J. Z. Y. Tan, S. Gavrielides, X. Luo, W. A. Thompson and M. M. Maroto-Valer, in Nanostructured Photocatalysts, ed. R. Boukherroub, S. B. Ogale and N. Robertson, Elsevier, 2020, pp. 39–73, DOI:10.1016/b978-0-12-817836-2.00003-x.
- K. Song, J. Zhou, J. Bao and Y. Feng, J. Am. Ceram. Soc., 2008, 91, 1369–1371 CrossRef CAS.
- T.-V. Nguyen, J. C. S. Wu and C.-H. Chiou, Catal. Commun., 2008, 9, 2073–2076 CrossRef CAS.
- Y. Wang, W. Yang and W. Shi, Ind. Eng. Chem. Res., 2011, 50, 11982–11987 CrossRef CAS.
- F. Xu, X. Zhang, Y. Wu, D. Wu, Z. Gao and K. Jiang, J. Alloys Compd., 2013, 574, 227–232 CrossRef CAS.
- E. Hosono, S. Fujihara, H. Imai, I. Honma, I. Masaki and H. Zhou, ACS Nano, 2007, 1, 273–278 CrossRef CAS PubMed.
- J. Lin, Y.-U. Heo, A. Nattestad, Z. Sun, L. Wang, J. H. Kim and S. X. Dou, Sci. Rep., 2014, 4, 5769 CrossRef.
- E.-H. Kong, Y.-J. Chang, Y.-C. Park, Y.-H. Yoon, H.-J. Park and H. M. Jang, Phys. Chem. Chem. Phys., 2012, 14, 4620–4625 RSC.
- S. Gavrielides, J. Z. Y. Tan, E. S. Fernandez and M. M. Maroto-Valer, Faraday Discuss., 2019, 215, 407–421 RSC.
- W. A. Thompson, A. Olivo, D. Zanardo, G. Cruciani, F. Menegazzo, M. Signoretto and M. M. Maroto-Valer, RSC Adv., 2019, 9, 21660–21666 RSC.
- T. David, Spectroscopy, 2017, 32, 26–33 Search PubMed.
- H. C. X.-Y. Liu and S. Afr, J. Chem., 2005, 58, 110–115 Search PubMed.
- W.-Q. Wu, H.-S. Rao, H.-L. Feng, X.-D. Guo, C.-Y. Su and D.-B. Kuang, J. Power Sources, 2014, 260, 6–11 CrossRef CAS.
- W.-Q. Wu and L. Wang, J. Mater. Chem., 2019, 7, 932–939 RSC.
- T. Butburee, Y. Bai, H. Wang, H. Chen, Z. Wang, G. Liu, J. Zou, P. Khemthong, G. Q. M. Lu and L. Wang, Adv. Mater., 2018, 30, 1705666 CrossRef PubMed.
- J. Z. Y. Tan, S. Gavrielides, H. R. Xu, W. A. Thompson and M. M. Maroto-Valer, RSC Adv., 2020, 10, 27989–27994 RSC.
- W. A. Thompson, E. Sanchez Fernandez and M. M. Maroto-Valer, Chem. Eng. J., 2020, 384, 123356 CrossRef CAS.
- T. Luttrell, S. Halpegamage, J. Tao, A. Kramer, E. Sutter and M. Batzill, Sci. Rep., 2014, 4, 4043 CrossRef PubMed.
- Y. Li, W.-N. Wang, Z. Zhan, M.-H. Woo, C.-Y. Wu and P. Biswas, Appl. Catal., B, 2010, 100, 386–392 CrossRef CAS.
- X. Wei, Q. An, Q. Wei, M. Yan, X. Wang, Q. Li, P. Zhang, B. Wang and L. Mai, Phys. Chem. Chem. Phys., 2014, 16, 18680–18685 RSC.
- S. Kaliaguine, in Stud. Surf. Sci. Catal., ed. H. Chon, S. I. Woo and S. E. Park, Elsevier, 1996, vol. 102, pp. 191–230 Search PubMed.
- M. Descostes, F. Mercier, C. Beaucaire, P. Zuddas and P. Trocellier, Nucl. Instrum. Methods Phys. Res., Sect. B, 2001, 181, 603–609 CrossRef CAS.
- Q. Wang, Z. Guo and J. S. Chung, Mater. Res. Bull., 2009, 44, 1973–1977 CrossRef CAS.
- R. Vinoth, S. G. Babu, V. Bharti, V. Gupta, M. Navaneethan, S. V. Bhat, C. Muthamizhchelvan, P. C. Ramamurthy, C. Sharma, D. K. Aswal, Y. Hayakawa and B. Neppolian, Sci. Rep., 2017, 7, 43133 CrossRef CAS PubMed.
- C. N. Fleming, K. A. Maxwell, J. M. DeSimone, T. J. Meyer and J. M. Papanikolas, J. Am. Chem. Soc., 2001, 123, 10336–10347 CrossRef CAS PubMed.
- C. A. Kent, B. P. Mehl, L. Ma, J. M. Papanikolas, T. J. Meyer and W. Lin, J. Am. Chem. Soc., 2010, 132, 12767–12769 CrossRef CAS PubMed.
- T.-D. Nguyen-Phan, S. Luo, D. Vovchok, J. Llorca, S. Sallis, S. Kattel, W. Xu, L. F. J. Piper, D. E. Polyansky, S. D. Senanayake, D. J. Stacchiola and J. A. Rodriguez, Phys. Chem. Chem. Phys., 2016, 18, 15972–15979 RSC.
- M. A. Ávila-López, S. Gavrielides, X. Luo, A. E. Ojoajogwu, J. Z. Y. Tan, E. Luévano-Hipólito, L. M. Torres-Martínez and M. M. Maroto-Valer, J. CO2 Util., 2021, 50, 101588 CrossRef.
- I. H. Tseng, W.-C. Chang and J. C. S. Wu, Appl. Catal., B, 2002, 37, 37–48 CrossRef CAS.
- B. Xin, P. Wang, D. Ding, J. Liu, Z. Ren and H. Fu, Appl. Surf. Sci., 2008, 254, 2569–2574 CrossRef CAS.
Footnote |
| † Electronic supplementary information (ESI) available: Raman spectra, XPS Survey scan and GC gaseous products production plot. See DOI: 10.1039/d1ra05414g |
| This journal is © The Royal Society of Chemistry 2021 |

