 Open Access Article
Study on the performance of a MOF-808-based photocatalyst prepared by a microwave-assisted method for the degradation of antibiotics
Fangwai Wang ab,
Ruixue Xueab,
Yujie Maab,
Yizhao Geab,
Zijun Wang
 *ab,
Xiuwen Qiao*a and
Paiang Zhoua
aSchool of Chemistry and Chemical Engineering, Key Laboratory for Green Processing of Chemical Engineering of Xinjiang Bingtuan, Shihezi University, Beisi Road, Shihezi, Xinjiang 832003, P. R. China. E-mail: wzj_tea@shzu.edu.cn; Tel: +86 15699322089
bCarbon Neutralization and Environmental Catalytic Technology Laboratory, Shihezi University, Shihezi 832003, P. R. China
First published on 6th October 2021
Abstract
In this paper, a simple method was used to rapidly prepare MOF-808 with a large specific surface area and high stability. Bi2S3 and MOF-808 were used to design and synthesize high-stability Bi2S3/MOF-808 nanocomposites, which were then used for the photocatalytic degradation of antibiotic tetracyclines. The performance test results showed that the 0.7-808 composite material had good photocatalytic degradation performance for tetracycline under visible-light irradiation, and the degradation rate reached 80.8%, which was 3.21 times and 1.76 times that of MOF-808 and Bi2S3, respectively. This was mainly due to the high photocurrent response and photoluminescence of the Bi2S3/MOF-808 composite material. Therefore, the close contact of n–n Bi2S3/MOF-808 can transfer light-generated electrons and holes to improve the utilization efficiency of photogenerated charges, thereby greatly improving the photocatalytic reaction activity. Particle-capture experiments and ESR confirmed that ˙OH was the main active substance in the photocatalytic degradation.
1. Introduction
In recent years, with the development and demands of modern industrialization, antibiotics have been widely used in medical care and animal husbandry. However, the excessive use of antibiotics has caused serious water pollution.1–3 Facing the progressively serious water pollution and energy crisis, there is an urgent need to develop an efficient and green technology to solve these problems. Due to its environmental friendliness, low energy consumption and low cost, the photocatalysis of semiconductor materials is considered to be an effective candidate method to solve antibiotic pollution in water, and this technology has received more and more attention.4,5 However, compared with dyes and other pollutants, the photocatalytic degradation of antibiotics is relatively difficult.6,7 Therefore, it is necessary to develop new effective photocatalysts with higher antibiotic degradation efficiency. In addition, the photogenerated carriers of the catalyst have strong oxidizing and reducing properties, and can quickly degrade pollutants, which has become one of the effective ways to remove water pollution.8–10 Nowadays, researchers have devoted themselves to the study of high-efficiency semiconductor photocatalysts.Metal–organic frameworks (MOFs) are a new type of crystalline porous materials with a periodic network framework structure formed by the self-assembly of organic ligands and inorganic metal centers (metal ions or metal clusters). The materials have the advantages of a large specific surface area, high porosity, and a designable structure.11–14
As a new type of photocatalyst, MOFs have the following advantages: (1) high porosity: there are more channels for the transport of substrates and products and more exposed reactive sites, which is conducive to the rapid transfer and utilization of photogenerated charges, and reduces the recombination rate of electrons–holes in the photocatalytic system. (2) Adjustable porous structure: the introduction of groups with a long-spectral effect, such as organic ligands, can broaden the light-response range of MOFs, and allow realizing the visible-light and even near-infrared photocatalysis of MOFs, so that they can generate more electron–hole pairs under sunlight irradiation.15 (3)There are structural defects: these are usually recombination centers for photogenerated electron–hole pairs in the catalyst, which together with MOFs having an ordered crystalline structure is beneficial for inhibiting the recombination of photogenerated electrons and holes. (4) Similar semiconductor features are easy to recombine with some nanomaterials to form heterojunctions or Schottky structures.16
MOF-808 is a polyhedral structure formed with metal zirconium (Zr) as a unit. In addition, Zr-based MOF has good stability. The polyhedral framework structure gives it a large specific surface area.17 A variety of semiconductor materials can use it as a carrier or form a heterojunction to improve the photocatalytic activity. However, due to its wide band gap (4.03 eV), MOF-808 can only absorb less than 321 nm ultraviolet light, and the visible-light-utilization rate is extremely low, which greatly limits the wide application of MOF-808 in the photocatalytic treatment of water pollution. Therefore, it is particularly important to find a semiconductor material to modify MOF-808 to broaden its light-response range.
Bismuth sulfide (Bi2S3) has attracted extensive attention from researchers as a narrow band gap (1.3–1.7 eV) semiconductor photocatalyst with an extremely high utilization of visible light.18 It can be easily excited to generate electron–hole pairs under visible light, and Bi2S3 is non-toxic, so it is considered to be a promising semiconductor material. As a semiconductor photocatalyst, Bi2S3 has a cut-off absorption wavelength of about 930 nm, and has a strong absorption capacity in the full visible-light region and even in part of the infrared light region.19 However, the band gap of pure Bi2S3 is relatively narrow, so it can easily aggregate. The photogenerated electron–hole pairs under visible-light irradiation can easily recombine, which greatly reduces the number of electrons as the main active species, resulting in a low concentration of active species, so the photocatalytic performance is poor. In general, it is difficult to improve the activity of single-component photocatalytic semiconductor materials. Therefore, the introduction of a new energy band into band gap and other energy band engineering is a basic strategy to improve the photocatalytic activity.20
In this paper, MOF-808 with a large specific surface area and high stability was prepared simply and quickly by using a microwave oven. According to the previously reported literature,21,22 the Bi2S3/MOF-808 composite was then prepared by a hydrothermal method and applied to the photocatalytic degradation of tetracycline. The 0.7-808 composite catalyst had the best catalytic degradation performance. Under visible light, the degradation rate of tetracycline reached 80.8%, which was 3.21 times and 1.76 times that of simple MOF-808 and bismuth sulfide, respectively. This was mainly due to the high photocurrent response and photoluminescence of the Bi2S3/MOF-808 composite material. Bi2S3 tightly connects with MOF-808 after contacting, which can transfer electrons and holes generated by light, improve the utilization efficiency of photogenerated charges, and greatly improve the photocatalytic reaction activity. Particle-capture experiments and ESR confirmed that ˙OH was the main active substance in the photocatalytic degradation.
2. Experimental
2.1 Materials
The L-cysteine, absolute ethanol, tetracycline, 1,3,5-benzenetricarboxylic acid, zirconium oxychloride octahydrate, bismuth nitrate pentahydrate, and other chemicals used in the experiment were all analytically pure (99%) without further purification. Deionized water was used in all the experimental work in this study. All the medicines come from Titan.2.2 Sample preparation
![[thin space (1/6-em)]](https://www.rsc.org/images/entities/char_2009.gif) :
:![[thin space (1/6-em)]](https://www.rsc.org/images/entities/char_2009.gif) 1) in a 200 mL reaction flask. Then the mixture was put into a microwave oven and heated over a medium heat for about 5 min. After centrifugation, filtration, and washing with DMF, then shaking for 10–15 min, this operation was repeated three times, before finally putting the mixture into the vacuum oven and drying it at 60 °C for about 12 h. After drying, a white powder was obtained.
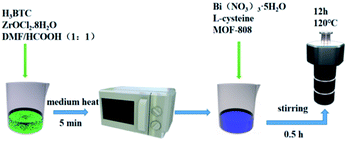
1) in a 200 mL reaction flask. Then the mixture was put into a microwave oven and heated over a medium heat for about 5 min. After centrifugation, filtration, and washing with DMF, then shaking for 10–15 min, this operation was repeated three times, before finally putting the mixture into the vacuum oven and drying it at 60 °C for about 12 h. After drying, a white powder was obtained.The preparation of pure Bi2S3 is the same as above, except that MOF-808 is not added. A schematic illustration of the preparation of Bi2S3/MOF-808 composite can be seen in Fig. 1.
2.3 Characterization of the photocatalysts
D8 ADVANCED powder X-ray diffraction (XRD, Cu-Kα radiation, λ = 1.5418 Å) and Nexus 470 Fourier-transform infrared spectrometry were used to test the phase structure of the samples. A Nicolet iS10 Fourier-transform infrared (FTIR) spectrometer was employed to record the FTIR spectra of the samples in the wavenumber range of 500–4000 cm−1. A JSM-7001F field emission scanning electron microscopy (SEM) system and JEM-2100 transmission electron microscopy (TEM) system were used to characterize the morphology and microstructure of the sample. The ESCAPHI 500 X-ray photoelectron spectroscopy (XPS) system was used to determine the element composition and valence state distribution of the surface. A UV-2450 UV-vis spectrophotometer (UV-vis DRS) with barium sulfate as the substrate was used to test the light-absorption performance of the sample. A Cary Eclipse fluorescence spectrometer was used to measure the photoluminescence (PL) performance of the sample. A CHI660D electrochemical workstation was used to test the photocurrent, impedance, and Mott–Schottky plots were performed for the samples. The low-temperature electron spin resonance (ESR spectrum) of the prepared sample was measured using a Bruker EXMEPR spectrometer at liquid nitrogen temperature (77 K).2.4 Photocatalytic activity
The photocatalytic activity of all the samples was tested by simulating organic pollutants with tetracycline (CP) aqueous solution under simulated visible-light irradiation. The specific steps were as follows: the photoreaction experiments of different organic pollutants were similar, that is, 50 mg sample and 50 mL corresponding pollutant solution (CP, 20 mg L−1) were added into the photocatalytic reactor, and the reactor was placed in the photocatalytic reactor (equipped with a 300 W xenon lamp and a filter (≥420 nm) (CEL-HXF300, Beijing, China)), and the stirring was turned on to mix the catalyst and solution evenly. The catalyst was stirred in the dark for 30 min to achieve adsorption–desorption equilibrium between the organic pollutants and catalyst. After turning on the lamp, the water circulation system was opened to maintain the reaction system at 25 °C to eliminate the deviations of light temperature. Within a certain interval, 6 mL of the suspension was taken with a syringe and centrifuged at 9000 rpm for 15 min, and an ultraviolet visible spectrophotometer (UV-31/32/3300) was used to analyze and determine the characteristic absorption peak of CP at 358 nm, so as to determine the degree of photocatalytic degradation. In order to ensure the repeatability of the results, three parallel experiments were conducted to obtain the average value of each group of conditions. A blank test was also performed by irradiating the reactant solution in the absence of a catalyst to evaluate its light-induced self-sensitive photodegradation.In the formula, η is the photocatalytic efficiency; C0 is the concentration of the reactants before illumination, and Ct is the concentration of the reactant after t hours of illumination.
3. Results and discussion
3.1 Structural and textural properties of Bi2S3/MOF-808
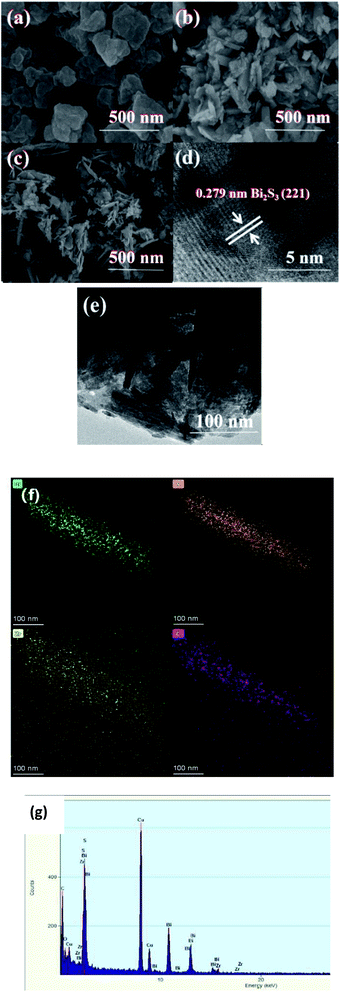 | ||
| Fig. 3 SEM images of (a) MOF-808; (b) Bi2S3; (c) 0.7-808, (d) HRTEM images of 0.7-808, (e) TEM images of 0.7-808, (f) elemental mappings of 0.7-808, (g) EDS spectrum of 0.7-808. | ||
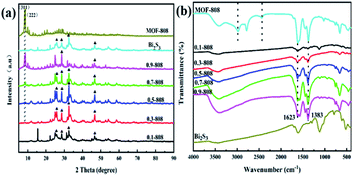
Compared with pure Bi2S3, Bi2S3 was more dispersed in the 0.7-808 composite material, which could increase the photoreaction area during the photocatalytic reaction process and further improve the photocatalytic activity. In order to analyze its structure more deeply, 0.7-808 was characterized by TEM and high-resolution TEM (HRTEM). Fig. 3(d) presents the HRTEM images of 0.7-808, in which a lattice fringe with a width of 0.279 nm can be clearly seen, which corresponds to the (221) crystal plane of Bi2S3. The result is consistent with those of XRD. In addition, the EDS spectrum images and elemental mappings were used to reveal the microstructure and composition of 0.7-808. As shown in Fig. 3(f) and (g), it is obvious that the 0.7-808 composite material was composed of C, O, Zr, S, and Bi elements, which fully proves the successful synthesis of the 0.7-808 composite material.
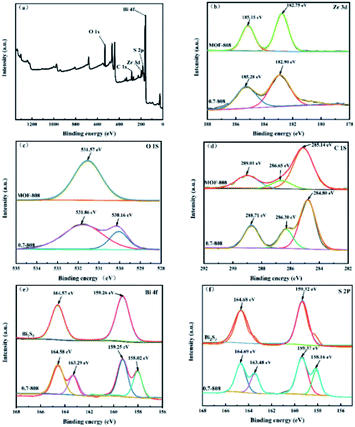
![[double bond, length as m-dash]](https://www.rsc.org/images/entities/char_e001.gif) O bond, respectively.28 Fig. 4(c) shows two characteristic peaks of O 1s at 531.9 and 530.2 eV, corresponding to defect/vacancy oxygen (OV) and lattice oxygen (OL), respectively.29 As shown in Fig. 4(e), the Bi 4f XPS spectrum of pure Bi2S3 shows two obvious peaks (164.6 and 159.3 eV), which could be attributed to the 4f5/2 and 4f7/2 of Bi3+.30 In addition, compared with pure Bi2S3, Bi 4f has a split peak at 0.7-808. As shown in Fig. 4(f), the binding energies of the other two characteristic peaks of S 2p were 164.7 and 159.3 eV.31 In the 0.7-808 complex, S 2p also showed a split peak. It is speculated that there was a relatively strong interaction between the synthesized MOF-808 and Bi2S3, which led to the split peak in Bi2S3. Based on SEM, XRD, and XPS analyses, it was considered that the compound Bi2S3/MOF-808 had been successfully synthesized.
O bond, respectively.28 Fig. 4(c) shows two characteristic peaks of O 1s at 531.9 and 530.2 eV, corresponding to defect/vacancy oxygen (OV) and lattice oxygen (OL), respectively.29 As shown in Fig. 4(e), the Bi 4f XPS spectrum of pure Bi2S3 shows two obvious peaks (164.6 and 159.3 eV), which could be attributed to the 4f5/2 and 4f7/2 of Bi3+.30 In addition, compared with pure Bi2S3, Bi 4f has a split peak at 0.7-808. As shown in Fig. 4(f), the binding energies of the other two characteristic peaks of S 2p were 164.7 and 159.3 eV.31 In the 0.7-808 complex, S 2p also showed a split peak. It is speculated that there was a relatively strong interaction between the synthesized MOF-808 and Bi2S3, which led to the split peak in Bi2S3. Based on SEM, XRD, and XPS analyses, it was considered that the compound Bi2S3/MOF-808 had been successfully synthesized.
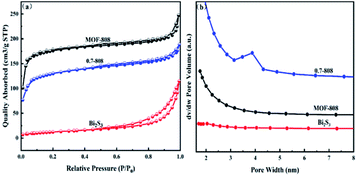 | ||
| Fig. 5 N2 adsorption–desorption isotherms (a) and NL-DFT pore-size distributions (b) for MOF-808, Bi2S3 and 0.7-808. | ||
| Sample | BET surface area (m2 g−1) | Pore volume (cm3 g−1) |
|---|---|---|
| 0.7-808 | 410 | 0.29 |
| Bi2S3 | 45.3 | 0.177 |
| MOF-808 | 545 | 0.383 |
| αhν = A(hν − Eg)n/2 | (1) |
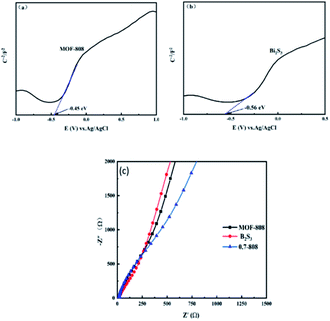 | ||
| Fig. 7 (a and b) Mott–Schottky plots of MOF-808, and Bi2S3; (c) Nyquist plots of EIS for MOF-808, Bi2S3 and 0.7-808 composites. | ||
Fig. 7(a and b) present the Mott–Schottky curves of MOF-808 and Bi2S3, respectively. The Mott–Schottky curves were measured to determine the band structures of 0.7-808, Bi2S3, and MOF-808. It can be seen from the figure that the Mott–Schottky curves of Bi2S3 and MOF-808 both had positive slopes, so MOF-808 and Bi2S3 were both n-type semiconductors. Among them, the intercept between the linear region of the curve and the X axis is the flat band potential (Efb) of the corresponding semiconductor. From Fig. 7(a and b), the obtained flat band potentials of MOF-808 and Bi2S3 were −0.45 and −0.56 V (vs. Ag/AgCl), respectively. Generally, the flat band potential is related to the effective electron quantity and carrier concentration, and the bottom of the conduction band of the n-type semiconductor is close to the flat band potential,36,37 according to the Nernst formula:
| ERHE = EAg/AgCl + 0.059 pH + E0Ag/AgCl | (2) |
| EVB = ECB + Eg | (3) |
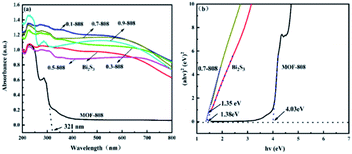
From Fig. 6(b), it can be concluded that the band gap width Eg values of MOF-808 and Bi2S3 were 4.03 and 1.38 eV, respectively, and the valence band potentials of MOF-808 and Bi2S3 were calculated to be 3.78 and 1.02 V, respectively. These characterizations indicated that the interaction between Bi2S3 and MOF-808 produced a complex with outstanding photocatalytic degradation properties. The rod-like structure of Bi2S3 is conducive to the capture of photoexcited electrons, and MOF-808 provided more catalytic centers, which increased the reaction and adsorption active sites to ensure the photocatalytic degradation ability of 0.7-808.
3.2 Research on the photocatalytic activity
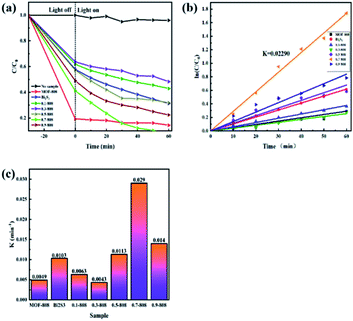
The photocatalytic performance of the prepared photocatalytic material was evaluated by degradation of an antibiotic contaminant (CP) solution, and the results are shown in the Fig. 9a. When no photocatalyst was added, the pollutants were hardly reduced under visible-light irradiation, indicating that CP had good light stability. Moreover, pure MOF-808 and Bi2S3 showed low photocatalytic activity for CP, but the 0.7-MOF-808 composite showed the highest photocatalytic degradation effect, and MOF-808 had a good adsorption capacity for CP solution. For the degradation of antibiotics, as shown in the figure, the simple MOF-808 only had an adsorption effect and could not photodegrade CP, while Bi2S3 degraded 45.8% of CP solution. The most active photocatalytic composite material was 0.7-808, where CP was degraded by 80.8% within 60 min. In order to better study the kinetic characteristics of the photodegradation of CP by materials, the kinetic fitting curve of the degradation of antibiotics was drawn through the experimental data, indicating that the reaction was a first-order reaction, and the reaction equation is:| ln(C/C0) = Kt | (4) |
3.3 Research on the mechanism of photocatalysis
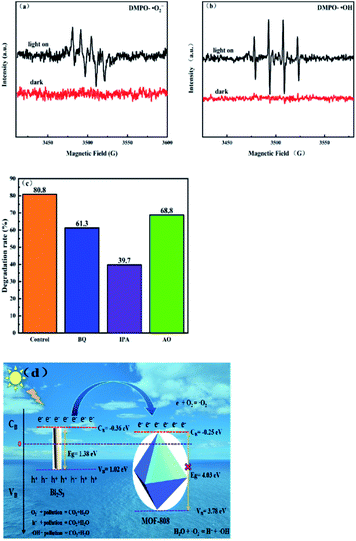
In order to study the catalytic mechanism of the 0.7-808 composite material for the photocatalytic degradation of pollutants, different scavengers, such as isopropanol (IPA), ammonium oxalate (AO), and benzoquinone (BQ), were introduced for when the 0.7-808 composite material degraded CP to capture ˙OH, h+, and ˙O2−,41 respectively, and the results are shown in Fig. 10(c). In the presence of BQ, the degradation of CP had no significant effect, which indicated that O2− was not the main active substance. When AO was added to the reaction, the degradation of CP did not decrease significantly, indicating that h+ was not the main active species either. However, with the addition of IPA, the degradation of CP was dramatically inhibited, which indicated that ˙OH played a pivotal role in the degradation reaction of CP, and confirmed that ˙OH was the main active species in this photocatalytic reaction. With the aim of further exploring the active oxygen of 0.7-808 in the process of photocatalysis, electron spin resonance (ESR) spectroscopy was performed on the sample. DMPO was used as a free radical trapping agent to determine the formation of ˙OH− and ˙O2− in the photocatalytic reaction process through the ESR test, and the results are shown in Fig. 10(a and b). No ESR signal was detected in the dark. After turning on the light, the intensity of the characteristic peak of DMPO–˙O2− was weaker, while the intensity of the characteristic peak of DMPO–˙OH was more obvious, which further confirmed that ˙OH was generated during the photocatalytic reaction. These results all indicate that ˙OH was the main active species in the photocatalytic degradation.Based on the above research, we proposed the possible photocatalytic mechanism of 0.7-808 composite photocatalyst to degrade tetracycline. According to literature reports, ˙OH− is the main influencing substance in Bi2S3 photocatalysis.42 Fig. 10(d) shows the possible photocatalytic mechanism of the 0.7-808 composite photocatalytic material. According to the Mott–Schottky test, the MOF-808 and Bi2S3 produced by the reaction were both n-type semiconductors.
When irradiated by visible light, the electrons in the valence band (VB) of Bi2S3 are excited to transition to the conduction band (CB), leaving more holes in the valence band, forming electron–hole pairs. The conduction band potential of Bi2S3 is −0.36 V (vs. NHE), which is slightly higher than that of MOF-808 (−0.25 V vs. NHE). Therefore, the photogenerated electrons on the conduction band of Bi2S3 would migrate to the conduction band of MOF-808. The porous structure of MOF-808 is conducive to the transfer and transmission of electrons. The tetracycline adsorbed on the surface can quickly undergo a reduction reaction with the photogenerated electrons. The conduction band potential of MOF-808 is more negative than the standard redox potential E0 (O2/˙O2−, −0.046 V vs. NHE),43 so the electrons accumulating on the conduction band of MOF-808 can oxidize the dissolved oxygen in the water and ˙O2− is generated; water reacts with the ˙O2−, and the main active species of this photoreaction is ˙OH. The holes accumulating in the valence band can also directly oxidize with CP molecules. In addition, the bridging ligand of MOF-808 may also speed up the transfer of photoelectrons, thereby improving the photocatalytic activity. Therefore, the close contact of n–n Bi2S3/MOF-808 promotes the separation of electrons and holes, and the photocatalytic degradation process of tetracycline. This electron-transfer process can fully inhibit electron–hole recombination, improve the charge-separation efficiency, and further improve the photocatalytic activity.
3.4 Repeatability and stability of the 0.7-808 composites testing
In order to evaluate the possibility of composite catalysts in practical application, reproducibility and stability tests were carried out for the 0.7-808 material. As shown in Fig. 11(a), after the photocatalytic degradation of CP was repeated four times, the fourth repetitive experiment running for 60 min showed a certain decrease in the removal rate of CP, but it was still stronger than the pure monomer. This shows that the 0.7-808 composite photocatalyst has high stability and could be reused in practical application. Therefore, it could be seen that the heterogeneous structure of the composite catalyst not only improved its activity, but also improved its stability. With the aim of further assessing whether the structure of the catalyst was damaged after use, the catalyst was characterized by XRD before and after use, and the results are demonstrated in Fig. 11(b). It can be seen from the figure that the intensity of the XRD diffraction peak of the catalyst was basically unchanged before and after use. Therefore, it could be concluded that the structure of the catalyst was not destroyed after use.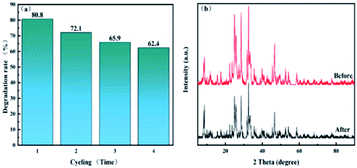 | ||
| Fig. 11 (a) Cycling runs of 0.7-808 in the degradation of CP under visible light. (b) XRD pattern of 0.7-808 before and after carrying out the photocatalytic experiments. | ||
4. Conclusions
In this paper, a microwave oven was used to prepare porous MOF-808 with a large specific surface area simply and quickly, and then Bi2S3/MOF-808 composite materials with different loading ratios were synthesized by a hydrothermal method. Under visible-light irradiation, the photocatalytic reduction performance of the Bi2S3/MOF-808 composite material was greatly improved compared with pure Bi2S3 and MOF-808, which may be due to the better adsorption performance of MOF-808. The enhanced absorption between MOF-808 and Bi2S3 and close contact between MOF-808 and Bi2S3 greatly increased the separation rate of photogenerated electron–hole pairs. Therefore, the production of O2−, ˙OH, and h+ was promoted. After 4 cycles, the composite catalyst still had good cycle stability and structural stability.Conflicts of interest
The authors declare no competing financial interests.Acknowledgements
We are grateful for grants from Natural Science Foundation of China (No. 21566031).Notes and references
- G. Naling, Z. Zhu, D. Hongjun, X. Yao and L. Ziyang, Construction of high-dispersed Ag/Fe3O4/g-C3N4 photocatalyst by selective photo-deposition and improved photocatalytic activity, Appl. Catal., B, 2016, 182, 115–122 CrossRef.
- M. Xia, H. Mingjun, Q. Zhang, C. Zhigang and Y. Shengxia, Advanced photocatalytic performance of graphene-like BN modifified BiOBr flflower-like materials for the removal of pollutants and mechanism insight, Appl. Catal., B, 2016, 183, 254–262 CrossRef.
- X. Liu, J. C. Steele and X. Z. Meng, Usage, residue, and human health risk of antibiotics in Chinese aquaculture: a review, Environmental Pollutants, 2017, 223, 161–169 CrossRef CAS PubMed.
- J. Han, X. Zheng, L. Zhang, H. Fu and J. Chen, Removal of SO2 on a nanoporous photoelectrode with simultaneous H2 production, Environ. Sci.: Nano, 2017, 4(4), 834–842 RSC.
- L. Weitao, W. Jiajun, Z. Jiye, T. Chen and W. Minghong, Simulated solar driven catalytic degradation of psychiatric drug carbamazepine with binary BiVO4 heterostructures sensitized by graphene quantum dots, Appl. Catal., B, 2017, 205, 587–596 CrossRef.
- N. Liu, H. Wenyuan, Z. Xiaodong, L. Tang and W. Yuxin, Ultrathin graphene oxide encapsulated in uniform MIL-88A(Fe) for enhanced visible light-driven photodegradation of RhB, Appl. Catal., B, 2018, 221, 119–128 CrossRef CAS.
- T. Li, C. Jia, Y. Xue, L. Li, A. Wang and G. Xu, Fabrication of compressible and recyclable macroscopic g-C3N4/GO aerogel hybrids for visible-light harvesting: A promising strategy for water remediation, Appl. Catal., B, 2017, 219, 241–248 CrossRef.
- J. Chaoran, L. Ki Yip, M. A. P. Christopher, K. B. Mustafa, L. Chiching, R. Qiushi, J. A. M. Savio, F. L. Adam and T. Junwang, Size-controlled TiO2 nanoparticles on porous hosts for enhanced photocatalytic hydrogen production, Appl. Catal., A, 2015, 521, 133–139 Search PubMed.
- A. Ning, M. Yuwei, L. Juming, M. Huiyan, Y. Jucai and Z. Qiancheng, Enhanced visible-light photocatalytic oxidation capability of carbon-doped TiO2 via coupling with fly ash, Chin. J. Catal., 2018, 39, 1890–1900 CrossRef.
- T. Zhenwei, Y. Dong, X. Tianxiong, T. Yao and J. Zhongyi, Biomimetic fabrication of g-C3N4/TiO2 nanosheets with enhanced photocatalytic activity toward organic pollutant degradation, Chem. Eng. J., 2015, 260, 117–125 CrossRef.
- Y. Li, Y. Fang, Z. Cao, N. Li, D. Chen, Q. Xu and J. Lu, Construction of g-C3N4/PDI@MOF heterojunctions for the highly efficient visible light-driven degradation of pharmaceutical and phenolic micropollutants, Appl. Catal., B, 2019, 250, 150–162 CrossRef CAS.
- A. Gómez-Avilés, M. Peñas-Garzón, J. Bedia, D. D. Dionysiou, J. J. Rodríguez and C. Belver, Mixed Ti-Zr metal–organic-frameworks for the photodegradation of acetaminophen under solar irradiation, Appl. Catal., B, 2019, 253, 253–262 CrossRef.
- D. He, H. Niu, S. He, L. Mao, Y. Cai and Y. Liang, Strengthened Fenton degradation of phenol catalyzed by core/shell Fe–Pd@C nanocomposites derived from mechanochemically synthesized Fe-Metal organic frameworks, Water Res., 2019, 162, 151–160 CrossRef CAS PubMed.
- C. Wenqian, L. Linyue, L. Li, Q. Wenhui, T. Tang, L. Xu, X. Kejun and W. Mingong, MoS2/ZIF-8 Hybrid Materials for Environmental Catalysis: Solar-Driven Antibiotic-Degradation Engineering, Eng, 2019, 5(4), 755–767 CrossRef.
- K. V. Kovtunov, V. V. Zhivonitko, A. Corma and I. V. Koptyug, Parahydrogen induced polarization in heterogeneous hydrogenations catalyzed by an immobilized Au (III) complex, J. Phys. Chem. Lett., 2010, 1(11), 1705–1708 CrossRef CAS.
- C. Cheng, F. Jianzhang, L. Shaoyou, C. Chaoping, Y. Chen, L. Ren, F. Weihua and F. Zhanqiang, Zirconium metal–organic framework supported highly-dispersed nanosized BiVO4 for enhanced visible-light photocatalytic applications, J. Chem. Technol. Biotechnol., 2016, 91(11), 2785–2792 CrossRef CAS.
- H. Furukawa, F. Gándara, Z. Yuebiao, J. Juncong, W. L. Queen, M. R. Hudson and O. M. Yaghi, Water adsorption in porous metal–organic frameworks and related materials, J. Am. Chem. Soc., 2014, 136(11), 4369–4381 CrossRef CAS PubMed.
- C. Yumin, J. Qingfeng, L. Huiquan, H. Jingyu, Z. Liangjun, L. Shigang, Y. Zou and J. Yang, Photocatalytic activities of Bi2S3/BiOBr nanocomposites synthesized by a facile hydrothermal process, Appl. Surf. Sci., 2014, 290, 233–239 CrossRef.
- Z. Zhijie, W. Wenzhong, L. Wang and S. Songmei, Enhancement of Visible-Light Photocatalysis by Coupling with Narrow-Band-Gap Semiconductor: A Case Study on Bi2S3/Bi2WO6, ACS Appl. Mater. Interfaces, 2012, 4(2), 593–597 CrossRef PubMed.
- Y. Yang, M. Qiangqiang, J. Xiaoliang, M. Sugang, Z. Xiuzhen, Z. Sujuan, F. Xianliang and C. Shifu, Photocatalytic Performance of NiS/CdS Composite with Multistage Structure, ACS Appl. Energy Mater., 2020, 3(8), 7736–7745 CrossRef CAS.
- M. Samy, M. G. Ibrahim, M. Fujii, K. E. Diab, M. ElKady and M. G. Alalm, CNTs/MOF-808 painted plates for extended treatment of pharmaceutical and agrochemical wastewaters in a novel photocatalytic reactor, Chem. Eng. J., 2021, 406, S1385-8947(20)33279-4 CrossRef.
- C. Ardila-Suárez, D. R. Molina, V. H. Alem, V. G. Baldovino-Medrano and G. E. Ramírez-Caballero, Synthesis of ordered microporous/macroporous MOF-808 through modulator-induced defect-formation, and surfactant self-assembly strategies, Phys. Chem. Chem. Phys., 2020, 22(22), 12591–12604 RSC.
- S. Lin, Z. Yufeng, J. K. Bediako, C. W. Cho, A. K. Sarkar, C. R. Lim and Y. S. Yun, Structure-controlled recovery of Palladium (II) from acidic aqueous solution using metal–organic frameworks of MOF-802, UiO-66 and MOF-808, Chem. Eng. J., 2019, 362, 280–286 CrossRef CAS.
- A. Phuruangrat, T. Thongtem and S. Thongtem, Characterization of Bi2S3 nanorods and nano-structured flowers prepared by a hydrothermal method, Mater. Lett., 2009, 63(17), 1496–1498 CrossRef CAS.
- T. Thongtem, C. Pilapong and J. Kavinchan, et al., Microwave assisted hydrothermal synthesis of Bi2S3 nanorods in flower-shaped bundles, J. Alloys Compd., 2010, 500(2), 195–199 CrossRef CAS.
- L. Ullah, Z. Guoying, X. Zichen, H. Hongyan, U. Muhammad and Z. Suojiang, 12-Tungstophosphoric acid niched in Zr-based metal–organic framework: a stable and efficient catalyst for Friedel-Crafts acylation, Sci. China: Chem., 2018, 61(4), 402–411 CrossRef CAS.
- G. Wang, C. Sharp, A. M. Plonka, Q. Wang, A. I. Frenkel, W. Guo, C. Hill, C. Smith, J. Kollar, D. Troya and J. R. Morris, Mechanism and Kinetics for Reaction of the Chemical Warfare Agent Simulant, DMMP(g), with Zirconium (IV) MOFs: An Ultrahigh-Vacuum and DFT Study, J. Phys. Chem. C, 2017, 121(21), 11261–11272 CrossRef CAS.
- Y. Wu, H. J. Luo and H. Wang, Synthesis of iron(iii)-based metal–organic framework/graphene oxide composites with increased photocatalytic performance for dye degradation, RSC Adv., 2014, 4(76), 40435–40438 RSC.
- M. J. Islam, H. K. Kim, D. A. Reddy, K. Yujin, R. Ma, H. Baek, J. Kim and T. K. Kim, Hierarchical BiOI nanostructures supported on a metal organic framework as efficient photocatalysts for degradation of organic pollutants in water, Dalton Trans., 2017, 46(18), 6013–6023 RSC.
- H. Zetian He, S. Liu, Y. Zhong, C. Daimei, H. Ding, J. Wang, D. Gaoxiang, G. Yang and Q. Hao, Preparation of BiPO4/graphene photoelectrode and its photoelectrocatalyitic performance, Chin. J. Catal., 2020, 41(2), 302–311 CrossRef.
- M. Lu, Y. Guotao, W. Zuoshan, W. Yuyuan and J. Guo, Synthesis of BiPO4/Bi2S3 Heterojunction with Enhanced Photocatalytic Activity under Visible-Light Irradiation, Nanoscale Res. Lett., 2015, 10(1), 385 CrossRef PubMed.
- M. Xiaodong, M. Wanxia, J. Deli, D. Li, M. Suci and M. Chen, Construction of novel WO3/SnNb2O6 hybrid nanosheet heterojunctions as efficient Z-scheme photocatalysts for pollutant degradation, J. Colloid Interface Sci., 2017, 15(506), 93–101 Search PubMed.
- H. Liu, X. Caiyun, L. Dandan Li and J. Hailong, Photocatalytic hydrogen production coupled with selective benzylamine oxidation over MOF composites, Angew. Chem., Int. Ed., 2018, 57, 1–6 CrossRef.
- M. A. Mahadadalka, S. W. Gosavi and B. B. Kale, Interstitialcharge transfer pathways in a TiO2/CdIn2S4 heterojunction photocatalyst for direct conversion of sunlight into fuel, J. Mater. Chem. A, 2018, 33(6), 16064–16073 RSC.
- M. A. Najeeb, A. Alkareem, M. Awais, Z. Ahmad and R. A. Shakoor, et al., Effect of microwave sintering on the crystal domain and electrical properties of TiO2 nanoparticles, J. Nanopart. Res., 2017, 19(6), 199–208 CrossRef.
- Z. Dai, F. Qin, Z. Huiping, F. Tian, L. Yunling and C. Rong Chen, Time-dependent evolution of the Bi3.64Mo0.36O6.55/Bi2MoO6 heterostructure for enhanced photocatalytic activity via the interfacial hole migration, Nanoscale, 2015, 28(7), 11991–11999 RSC.
- J. Yan, T. Wang, G. Wu, W. Dai, N. Guan, L. Li and J. Gong, Nanosheets: tungsten oxide single crystal nanosheets for enhanced multichannel solar light harvesting, Adv. Mater., 2015, 27, 1580–1586 CrossRef CAS PubMed.
- Y. Huang, W. Fan, B. Long, H. Li, F. Zhao, Z. Liu, Y. Tong and H. Ji, Visible light Bi2S3/Bi2O3/Bi2O2CO3 photocatalyst for effective degradation of organic pollutions, Appl. Catal., B, 2016, 185, 68–76 CrossRef CAS.
- A. Gómez-Avilés, M. Peñas-Garzón, J. Bedia, D. D. Dionysiou, J. J. Rodríguez and C. Belver, Mixed Ti-Zr metal–organic-frameworks for the photodegradation of acetaminophen under solar irradiation, Appl. Catal., B, 2019, 253, 253–262 CrossRef.
- D. He, H. Niu, S. He, L. Mao, Y. Cai and Y. Liang, Strengthened Fenton degradation of phenol catalyzed by core/shell Fe–Pd@C nanocomposites derived from mechanochemically synthesized Fe-Metal organic frameworks, Water Res., 2019, 162, 151–160 CrossRef CAS PubMed.
- X. M. Lv, J. X. Wang and Z. X. Yan, et al., Design of 3D h-BN architecture as Ag3VO4 enhanced photocatalysis stabilizer and promoter, J. Mol. Catal. A: Chem., 2016, 418–419, 146–153 CrossRef CAS.
- T. Zhao, X. F. Zhu, Y. F. Huang and Z. J. Wang, One-step hydrothermal synthesis of a ternary heterojunction g-C3N4/Bi2S3/In2S3 photocatalyst and its enhanced photocatalytic performance, RSC Adv., 2021, 11(17), 9788–9796 RSC.
- S. Leqiang, J. Deli, P. Xiao, Z. Liming, M. Suci and M. Chen, Enhancement of g-C3N4 nanosheets photocatalysis by synergistic interaction of ZnS microsphere and RGO inducing multistep charge transfer, Appl. Catal., B, 2016, 198, 200–210 CrossRef.
| This journal is © The Royal Society of Chemistry 2021 |

