DOI:
10.1039/D1RA05106G
(Paper)
RSC Adv., 2021,
11, 34117-34124
Production of nitrogen-doped carbon quantum dots with controllable emission wavelength, excellent sensing of Fe3+ in aqueous solution, and potential application for stealth quick response coding in the visible regime†
Received
2nd July 2021
, Accepted 27th September 2021
First published on 20th October 2021
Abstract
Nitrogen-doped carbon quantum dots (N-CQDs) exhibit a high quantum yield with controllable emission wavelength and intensity in the blue-green regime. N-CQDs were tested and determined to be thermally and optically stable during 150 °C heat treatment and prolonged UV irradiation. Potential applications of N-CQDs were demonstrated, including excellent Fe3+ sensing in aqueous solution, fluorescent polymer fibres, and stealth quick response coding at visible wavelengths.
1 Introduction
Quantum dots (QDs) show great potential for imaging applications and are mostly made of semiconductor materials.1 However, the production process for QDs is lengthy, and in particular, the toxicity of QDs remains to be addressed.2,3 Carbon materials including graphite, carbon fibres, carbon nanotubes, graphene, carbon black, activated carbon, and fullerenes are sp2-bonded structures and are now widely used.4–12 There has been great interest in carbon quantum dots (CQDs) because they represent a new class of fluorescent nanomaterials mainly due to their water solubility, eco-friendliness, ability to be processed with ease, and low synthetic cost.13–15 Reports indicate that CQDs can be used in bio-imaging,16,17 anti-counterfeiting,18 photocatalysis,19,20 chemical sensing,21–23 drug delivery,24 light-emitting diodes,17,25 and energy technology.26 For example, perovskite solar cells can be inexpensively produced and show high power conversion efficiency.3,27–30 However, devices suffer greatly from dangling edge-induced carrier recombination, which thus lowers performance. Uncoordinated ions may be passivated by oxygenated groups of CQDs, which in turn reduce non-radiative processes. CQD production currently relies on top-down and bottom-up techniques. The former is achieved through breakdown of large carbon masses into nano-sized clusters, using techniques such as arc discharge,31 laser ablation,32 and high energy ball milling.33 The top-down method is also time-consuming, with a quantum yield (QY) lower than 10%. The bottom-up approach uses organic molecules as precursors and produces CQDs through different routes, including solvothermal reactions (ST),34–36 microwave-assisted pyrolysis,37 heterogeneous reactions (HR),38 and combustion (Table 1).39
Table 1 Synthetic methods and related parameters for CQDs
| |
Top-down routes |
Bottom-up routes |
| Precursors |
•Large carbon masses (such as CNT-s, activated carbon, graphite, and carbon fiber) |
•Small organic molecules |
| Methods |
•Arc discharge |
•Solvothermal/hydrothermal |
| •Laser ablation |
•Microwave |
| •Electrochemical synthesis |
•Chemical vapor deposition |
| •High-energy ball milling |
•Heterogeneous reaction |
| Characteristics |
•Low quantum yields |
•Heteroatom doping |
| •Tuneable emission wavelength |
Chemical doping is a technique capable of modifying the band diagram of solids and has been applied to carbon materials.40,41 Studies have revealed that nitrogen-doping increases the photoluminescence (PL) of CQDs, and the underlying mechanism involves the creation of optical states around the band edges.42,43 Attributed to lone-pair electrons, nitrogen-doped CQDs (N-CQDs) behave as conjugated bases and are highly sensitive to cations in aqueous solution.44–47 N-CQDs can be made by ST using organic precursors, such as citric acid (CA), ammonium citrate, L-cysteine, urea (UA), ethylenediamine, and hexamethylenetetramine.48–52 Reports indicate that CQDs produced in organic solvents emit mostly green-red light, while the emission wavelength (Eλ) of CQDs produced in water is essentially limited to blue.53–55
In this work, blue-green emission (420–500 nm) from CQDs is achieved through adjustment of the N-doping content as follows. First, N-CQDs are produced using mixed precursors (CA + UA); the former provides the carbon source, and the latter provides N-doping. Note that because UA is inexpensive, we therefore selected it as a precursor. Second, the doping content is controlled by tuning of the UA/CA ratio. We found that Eλ varied with UA/CA, and the QY reached a value as high as 36% in 395 nm excitation energy (Eex). Incorporation of N-CQDs into polyvinyl alcohol (PVA) and polystyrene (PS) produces luminescent polymer films and fibres; the latter is made by an electrospinning technique that does not involve high temperature or coagulation processes. Applications of N-CQDs are also demonstrated, including sensing of Fe3+ in aqueous solution and stealth QR coding and labelling in the visible regime.
2 Experimental section
2.1 Materials
Anhydrous CA, UA, and metal salts NaCl, KCl, MgCl2, CaCl2, FeCl2, FeCl3, CuSO4, Zn(NO3)2, Pb(NO3)2, CrCl3, Co(NO3)2, and Ni(NO3)2 were purchased from Showa Chemical Industry Co., Ltd. PVA (Mw = 121![[thin space (1/6-em)]](https://www.rsc.org/images/entities/char_2009.gif) 000) and PS (Mw = 192
000) and PS (Mw = 192![[thin space (1/6-em)]](https://www.rsc.org/images/entities/char_2009.gif) 000) were purchased from the First Chemical Works (Taiwan) and Sigma-Aldrich. E-132 epoxy resin and H-TK curing agent were obtained from Fong Yong Chemical Co., Ltd. Light fabric transfer papers were purchased from Upsilon Enterprise Co., Ltd.
000) were purchased from the First Chemical Works (Taiwan) and Sigma-Aldrich. E-132 epoxy resin and H-TK curing agent were obtained from Fong Yong Chemical Co., Ltd. Light fabric transfer papers were purchased from Upsilon Enterprise Co., Ltd.
2.2 Synthetic procedures for ST
CA and UA, mixed respectively in a molar ratio of 1, 3, 7, 15, 30, and 60 (hereafter defined as ST1, ST3, ST7, ST15, ST30, and ST60), were dissolved in deionized water (10 ml) (top, Table 2). The solution was loaded into a Teflon-lined stainless steel autoclave and heated at 150 °C for 2 h. After cooling to room temperature, the treated solution was mixed with ethanol (200 ml), followed by sonication for 5 min, and centrifugation at 6000 rpm for 15 min. The precipitates were dried at 70 °C, and were then re-dispersed in water (Fig. 1a). Removal of the aqueous solution resulted in a production yield of 4–6 wt%.
Table 2 Synthetic parameters for ST (top) and HR (lower)
| Sample |
CA (g) |
UA (g) |
Molar ratio (UA/CA) |
Solvent |
Conditions |
Product mass (g) |
| ST1 |
0.4 |
0.125 |
1 |
H2O |
150 °C, 2 h |
0.094 |
| ST3 |
0.375 |
3 |
0.270 |
| ST7 |
0.875 |
7 |
0.314 |
| ST15 |
1.875 |
15 |
0.339 |
| ST30 |
3.75 |
30 |
0.303 |
| ST60 |
7.5 |
60 |
0.228 |
| ST15et |
1.875 |
15 |
Ethanol |
0.212 |
| Sample |
CA (g) |
UA (g) |
Molar ratio (UA/CA) |
Temperature (°C) |
Time (h) |
Product mass (g) |
| HR2 |
0.4 |
0.25 |
2 |
160 |
4 |
0.138 |
| HR5 |
0.625 |
5 |
0.204 |
| HR10 |
1.25 |
10 |
0.281 |
| HR15 |
1.875 |
15 |
0.266 |
| HR15II |
1.875 |
15 |
150 |
4 |
0.245 |
| HR15III |
2 |
0.232 |
| HR15IV |
0.5 |
0.073 |
| HR15V |
135 |
4 |
0.187 |
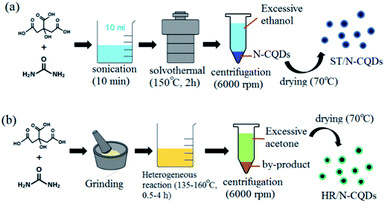 |
| | Fig. 1 Synthetic procedures for (a) ST and (b) HR. | |
2.3 Synthetic procedures for HR
CA and UA, mixed in molar ratios of 2, 5, 10, and 15 (hereafter defined as HR2, HR5, HR10, and HR15, lower, Table 2), were ground in an agate mortar. The mixture was transferred to a glass bottle and was aerially heated at 160 °C for 4 h. After cooling to room temperature, the resultant dark powder was dispersed in deionized water and acetone (50 ml), followed by sonication for 10 min and centrifugation at 6000 rpm for 15 min. The upper-layer suspension was dried at 70 °C and was then re-dispersed in acetone and/or water (Fig. 1b). Removal of solution resulted in a production yield of 4–6 wt%, with the product resembling ST-made CQDs.
2.4 Fabrication of HR15/PVA composite films
HR15 (12.5 mg) and PVA (2.5 g) were mixed in deionized water (12.5 ml), followed by magnetic stirring at 90 °C for 3 h to attain a homogeneous solution. The solution was transferred onto a glass slide and was dried under a fume hood for a day to obtain a HR15/PVA composite film.
2.5 Fabrication of HR15/PVA and HR15/PS composite fibres
HR15/PVA composite fibres are prepared as follows. HR15 (4 wt%), PVA (5 wt%), and dimethyl sulfoxide (DMSO, 15 wt%) were dissolved in water and were magnetically stirred at 90 °C for 3 h to attain a homogeneous solution. The solution was subjected to electrospinning at 24 kV with a working distance of 10 cm and feeding rate of 1 ml h−1 (top, Table 3). HR15/PS composite fibres were also fabricated by an electrospinning technique. PS was first melted in mixed solvents (toluene/acetone, 8![[thin space (1/6-em)]](https://www.rsc.org/images/entities/char_2009.gif) :
:![[thin space (1/6-em)]](https://www.rsc.org/images/entities/char_2009.gif) 2), followed by HR15 addition. Due to viscosity arising from PS, the electrospinning was carried out at 20 kV with working distance and feeding rate of 10 cm and 3.5 ml h−1, respectively (lower, Table 3).
2), followed by HR15 addition. Due to viscosity arising from PS, the electrospinning was carried out at 20 kV with working distance and feeding rate of 10 cm and 3.5 ml h−1, respectively (lower, Table 3).
Table 3 Electrospinning parameters for HR15/PVA (top) and HR15/PS fibres (lower)
| CHR15/PVA |
Solvent ratio (DMSO/water) |
Csolution |
Work distance |
Voltage |
Flow rate |
| 4 wt% |
0![[thin space (1/6-em)]](https://www.rsc.org/images/entities/char_2009.gif) : :![[thin space (1/6-em)]](https://www.rsc.org/images/entities/char_2009.gif) 10 10 |
5 wt% |
10 cm |
24 kV |
1 ml h−1 |
0![[thin space (1/6-em)]](https://www.rsc.org/images/entities/char_2009.gif) : :![[thin space (1/6-em)]](https://www.rsc.org/images/entities/char_2009.gif) 10 10 |
8 wt% |
1.5![[thin space (1/6-em)]](https://www.rsc.org/images/entities/char_2009.gif) : :![[thin space (1/6-em)]](https://www.rsc.org/images/entities/char_2009.gif) 10 10 |
8 wt% |
| CHR15/PS |
Solvent ratio (toluene/acetone) |
Csolution |
Work distance |
Voltage |
Flow rate |
| 2 wt% |
2![[thin space (1/6-em)]](https://www.rsc.org/images/entities/char_2009.gif) : :![[thin space (1/6-em)]](https://www.rsc.org/images/entities/char_2009.gif) 8 8 |
5 wt% |
10 cm |
20 kV |
3.5 ml h−1 |
| 4 wt% |
| 8 wt% |
2.6 Thermal stability
The thermal stability of the HR15/PVA composite films, HR15, and ST3 was tested as follows. First, samples were heated at 75, 100, 125, 150, 175, 200, 225, and 250 °C for 1 h. Second, PL, emission intensity (EI), and Eλ were compared before and after heat treatments. Note that comparisons were made on the basis of similar concentrations and conditions, i.e., ST3/water (0.5 mg ml−1), HR15/acetone (0.1 mg ml−1), and HR15/water (0.5 mg ml−1). Third, the solution was illuminated by 365 nm UV lamp at the distance of 5 cm, and PL spectra were recorded for 2, 4, 6, 8, 10, 12, and 24 h.
2.7 Sensing of Fe3+ in aqueous solution
Different concentrations of Fe3+ (0–500 µM) were added to 0.4 µg ml−1 HR15 aqueous solution, followed by PL recording at Eex = 395 nm (=3.138 eV). The selectivity of Fe3+ was investigated by adding 12 types of metal ions with concentrations of 1 mM (Na+, K+, Mg2+, Ca2+, Fe2+, Fe3+, Co2+, Ni2+, Cu2+, Zn2+, Cr3+, and Pb2+) to 4 µg ml−1 HR15 aqueous solution.
2.8 Instrumental analyses
The ultraviolet-visible (UV-Vis) absorption spectra and PL spectra were recorded by a Hitachi U-2010 spectrophotometer and PerkinElmer LS-55 luminescence spectrometer. Transmission electron microscopy (TEM, JEOL, JEM-ARM200FTH) and electron diffraction (Gatan Microscopy Suite software) were employed to analyse structures of ST- and HR-produced CQDs, in conjunction with X-ray diffraction (XRD, Bruker D2 Phaser under Cu-Kα radiation, λ = 1.5406 Å, 2θ mode), Fourier transform infrared spectroscopy (FTIR, Horiba FT-730 spectrometer), Raman spectroscopy (Horiba LabRAM HR800 spectrometer with He–Ne laser at 632.8 nm wavelength), optical microscopy (Microtech MX53 microscope), and scanning electron microscopy (SEM). Energy-dispersive X-ray spectroscopy (EDX, Hitachi SU-8010 electron microscope) and X-ray photoelectron emission spectroscopy (XPS, ULVAC-PHI PHI 5000 Versaprobe II) were used for elemental analyses.
2.9 QY measurements
QY was calculated according to the equation QY = QY′ × (m/m′) × (n2/n′2), where m denotes the profile slope of EI against absorbance and is determined using quinine sulfate as a reference.56 The n denotes the refraction index, and is 1.33 for water and 1.36 for acetone.
3 Results and discussion
3.1 Characterization of CQD structures
TEM images indicate that samples produced by HR or ST consist of spherical nanoparticles embedded in an amorphous carbon matrix (Fig. 2a). Particles consist of layered structures, where the (002) and (110) diffraction vectors originate from inter-layer spacing (3.4 Å) and zigzag lines of graphite sheets (2.1 Å) (Fig. 2b).57 TEM further reveals that the average diameter is 8.6 ± 3.5 nm for ST3- and 11.4 ± 3.2 nm for HR15-made CQDs (Fig. 2c and d). TEM images of ST-made CQDs are shown in Fig. S1 (ESI†).
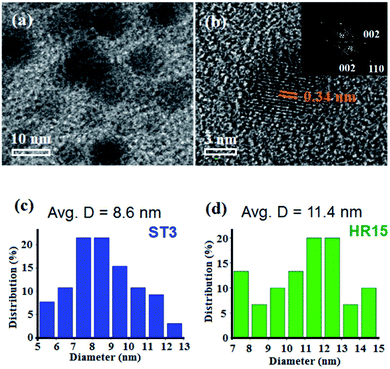 |
| | Fig. 2 (a) HRTEM image of HR-CQDs. (b) Magnified image of a selected HR-CQD and electron diffraction pattern (top right inset). Diameter distribution of (c) ST3 and (d) HR15. | |
The (002) reflection was also observed in XRD, along with profiles arising from sp2–sp3 hybrids (4.9 Å) and graphite oxide (6.4 Å) (Fig. 3a).58–60 Note that the (002) bandwidth of ST-made CQDs is broad, indicative of an amorphous governed structure (Fig. 3a). HR-created N-doping is evident by (i) Raman, (ii) FTIR, and (iii) EDX as follows. First, doping produces lattice defects, thus giving ID/IG ∝ UA/CA, where ID and IG represent the intensity of Raman D (1340 cm−1) and G (1570 cm−1) bands; the former is due to phonon scattering by defects/zone boundaries, and the latter is due to the vibration of sp2-bonded carbons (Fig. 3b).61 Second, the stretching mode of N–H (3348 cm−1) and O–H (3200 cm−1) was observed via FTIR spectroscopy, along with stretching (2800 cm−1) and bending (760 cm−1) of C–H and vibrations of C![[double bond, length as m-dash]](https://www.rsc.org/images/entities/char_e001.gif) O (1713 cm−1), C
O (1713 cm−1), C![[double bond, length as m-dash]](https://www.rsc.org/images/entities/char_e001.gif) C (1600 cm−1), C–N (1368 cm−1), and C–O (1060 cm−1) (Fig. 3c).62,63 Third, EDX confirmed the presence of C, O, and N signals with a C/O ratio greater than UA (1.00) and CA (0.86), which is indicative of dehydration during N-CQD formation (Table 4). Four, the doping content ∝ UA/CA again verifies the presence of UA-created N-doping (Table 4). However, doping is absent in ST3, accounting for lower ID/IG and greater C/O ratios (Fig. 3c and Table 4). Fig. S2† shows the XPS results for ST3 and HR15; the latter displays a greater content of N-dopants according to peak area integration (ESI†).
C (1600 cm−1), C–N (1368 cm−1), and C–O (1060 cm−1) (Fig. 3c).62,63 Third, EDX confirmed the presence of C, O, and N signals with a C/O ratio greater than UA (1.00) and CA (0.86), which is indicative of dehydration during N-CQD formation (Table 4). Four, the doping content ∝ UA/CA again verifies the presence of UA-created N-doping (Table 4). However, doping is absent in ST3, accounting for lower ID/IG and greater C/O ratios (Fig. 3c and Table 4). Fig. S2† shows the XPS results for ST3 and HR15; the latter displays a greater content of N-dopants according to peak area integration (ESI†).
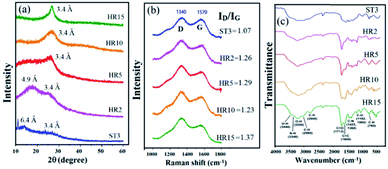 |
| | Fig. 3 (a) XRD, (b) Raman, and (c) FTIR spectra of CQDs made by ST and HR. | |
Table 4 Elemental analyses of ST- and HR-made CQDs
| Samples |
C (at%) |
O (at%) |
N (at%) |
C/O |
| ST3 |
70.9 |
29.1 |
0 |
2.44 |
| HR2 |
59.2 |
31.3 |
9.5 |
1.89 |
| HR5 |
56.0 |
32.6 |
11.4 |
1.72 |
| HR10 |
46.7 |
37.6 |
15.7 |
1.24 |
| HR15 |
50.4 |
29.4 |
20.2 |
1.71 |
3.2 PL of CQDs
Fig. 4a and b displays the PL spectra and optical images of ST-CQDs-dispersed water (right inset). Clearly, all samples emit blue-green light with a similar full width at half maximum (FWHM = 65 nm) and peak centre (EλC = 440 nm), indicating that Eex and the UA/CA ratio have no effect on Eλ tuning. EI, however, varies with UA/CA and follows the sequence ST3 > ST7–ST15 > ST30 > ST1. Because emission involves radiative processes around band edges, it is important to understand how optical transitions proceed in CQDs. Fig. 4c displays the UV-Vis spectra of ST-made CQDs, where the absorption at 200–211 nm is attributed to the π–π* transition of C![[double bond, length as m-dash]](https://www.rsc.org/images/entities/char_e001.gif) C/C–C bonds in the sp2-hybridized domains and barely contributes to PL.13 The peak at 335 nm originates from the nO–π* transition of C
C/C–C bonds in the sp2-hybridized domains and barely contributes to PL.13 The peak at 335 nm originates from the nO–π* transition of C![[double bond, length as m-dash]](https://www.rsc.org/images/entities/char_e001.gif) O/C–OH bonds in amorphous regions, where nO denotes the radiative relaxation of excited lone pairs in oxygen and significantly contributes to blue emission.64 By using quinine sulfate/0.1 M H2SO4 solution as a reference, the QY of ST3 was determined to be 37.5% and 23.3% for Eex = 365 and 395 nm, respectively (Fig. S3, ESI†).
O/C–OH bonds in amorphous regions, where nO denotes the radiative relaxation of excited lone pairs in oxygen and significantly contributes to blue emission.64 By using quinine sulfate/0.1 M H2SO4 solution as a reference, the QY of ST3 was determined to be 37.5% and 23.3% for Eex = 365 and 395 nm, respectively (Fig. S3, ESI†).
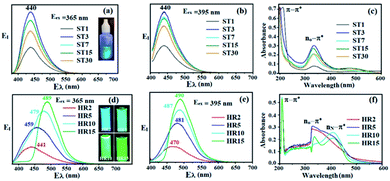 |
| | Fig. 4 (a–c) 365 and 395 nm excited EI–E, and UV-Vis spectra of ST-made CQDs. (d–f) 365 and 395 nm excited EI–E, and UV-Vis spectra of HR-made CQDs. | |
HR-made N-CQDs show EI ∝ UA/CA, indicative of additional emission from N-doped structures (Fig. 4d and e).65 The EλC also varies with UA/CA and Eex, i.e., EλC = 441 (HR2), 459 (HR5), 479 (HR10), and 489 nm (HR15) for Eex = 365 nm (right insets, Fig. 4d). At Eex = 395 nm, the EλC redshifts to 470 (HR2), 481 (HR5), 487 (HR10), and 490 nm (HR15), verifying the movement of absorption edges to long wavelengths (Fig. 4d and e). The UV-Vis spectra confirmed that doping induced an nN–π* transition of C–N bonds in amorphous regions (408 nm), where nN denotes radiative relaxation of excited lone pairs in nitrogen, accounting for the emission of greenish light and red-shifted EλC (Fig. 4f).65 The QY of HR-acetone exceeds that of HR-water, and the UA/CA ∝ QY relation again supports improved PL (Tables 5 and 6, and Fig. S3, ESI†).
Table 5 EλC, FWHM and QY of HR15/acetone and HR15/water measured at Eex = 395 nm
| Sample |
Eex = 365 nm |
| EλC |
FWHM |
QY |
| HR15/acetone |
441 |
92 |
10.2% |
| HR15/water |
459 |
105 |
23.8% |
Table 6 EλC, FWHM, and QY of HR2, HR5, HR10, and HR15 measured at Eex = 365 and 395 nm
| Sample |
Eex = 365 nm |
Eex = 395 nm |
| EλC |
FWHM |
QY |
EλC |
FWHM |
QY |
| HR2 |
441 |
92 |
10.2% |
470 |
85 |
10.3% |
| HR5 |
459 |
105 |
23.8% |
481 |
83 |
25.3% |
| HR10 |
479 |
96 |
34.2% |
487 |
74 |
33.0% |
| HR15 |
489 |
71 |
30.5% |
490 |
71 |
36.0% |
Due to radiolysis and oxidation, conventional QDs barely survive under prolonged UV irradiation and heat treatments.25 Here, ST3 and HR15 were selected for 365 nm irradiation and thermal stability tests because both show the highest QY in their own groups. Fig. 5a plots EI/EIo against irradiation time, and measurements were performed with 5 W of lighting power at a distance of 10 cm from the samples. Clearly, ST3 rapidly degrades, and EI/EIo decreases to 40% in 4 h, 12% in 8 h, 8% in 12 h, and 3% in 24 h. In contrast, HR15–H2O and HR15–PVA display a high EI/EIo after 24 h, with measurements indicating 82.4% and 97% (Fig. S4, ESI†). In the thermal stability tests, the EI/EIo of ST3 begins to decrease at approximately 100 °C and decreases to 21.3% at 225 °C (Fig. 5b). HR15, in contrast, is thermally stable prior to 150 °C, where EI/EIo is decreased by less than 2%. The EI/EIo then decreases to 44.6% and 2% at 225 °C for HR15 and HR15–PVA, respectively; the latter is attributed to the thermal decomposition of polymer that induces optical shielding, thus compromising EI (left insets, Fig. 5b and S5, ESI†).
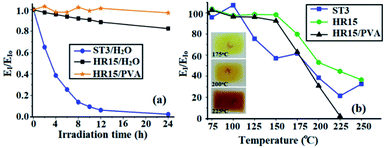 |
| | Fig. 5 (a) EI/EIo vs. UV-irradiation time and (b) EI/EIo vs. temperature of CQDs. | |
3.3 Applications of CQDs
PL pigments are now widely used and are mostly made from organic compounds such as stilbene-, benzimidazole-, coumarin-, and II–VI, III–V, and IV–VI group-based. However, the cited compounds lack thermal stability, and in particular, the issue concerning carcinogenicity remains to be addressed.66,67 The data above clearly show that HR-CQDs exhibit superior thermal and optical properties and were therefore selected to demonstrate their potential applications, including PL polymer fibres, sensing of Fe3+ in aqueous solution, and stealth QR coding and labelling in the visible regime.
3.3.1 CQDs-polymer fibres and films. Fig. 6 displays optical images of 395 nm-excited (a) HR15/PVA and (b) CQDs/PS fibres, along with SEM images taken at 500× magnification (Fig. 6c and d). There is a similar aspect ratio for both types of fibres, which is attributed to their hydrophilic nature and satisfactory wetting, and the CQDs were well dispersed in PVA.68,69 First, the PL was uniform relative to HR15/PS. Second, uniform PL was also present in the HR15/PVA films (inset, Fig. 6a). Third, magnified images confirm that PL was emitted from regions contiguous to surfaces. Fourth, HR15/PVA exhibits a greater fibre density compared with HR15/PS (Fig. 6e and f). Fifth, the EI–Eλ plot supports the descriptions above, which indicates that CQDs are well dispersed in PVA, and thus provide a greater EI; the measured EλC was 498 nm for HR15/PVA and 512 nm for HR15/PS (Fig. 6g).
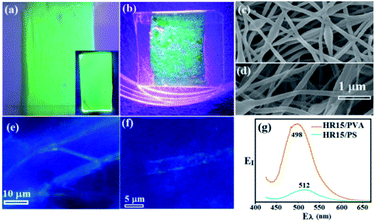 |
| | Fig. 6 Optical images of 395 nm-excited electrospinning-made (a) HR15/PVA and (b) HR15/PS fibre mats. SEM images of (c) HR15/PVA and (d) HR15/PS fibres. Enlarged optical images of 395 nm-excited (e) HR15/PVA and (f) HR15/PS fibres. (g) EI–Eλ plot of HR15/PVA and HR15/PS fibres. | |
3.3.2 Sensing of Fe3+ in aqueous solution by CQDs. Sensing and detection limits of Fe3+ were determined by the 3σ method in 0.4 mg ml−1 HR15 aqueous solution.70 First, a quenching effect appeared, which was evident by the EI decrease with increasing Fe3+ concentration from 0 to 500 mM (Fig. 7a and b).71 Second, profile fitting revealed the R2 coefficient = 0.996 and detection limit = 9.27 µM at 0–170 µM (inset, Fig. 7b), a value which is as accurate as that in reported data.72,73 PL quenching is due to the interaction of Fe3+ with oxygenated and amino groups of CQDs (Fig. S2, ESI†), and therefore, instead of returning to ground states, excited photoelectrons are transferred to half-filled 3d5 orbitals of cations.74 The Fe3+ selectivity was further verified by treating HR15 with Fe3+, Fe2+, Na+, K+, Mg2+, Ca2+, Co2+, Ni2+, Cu2+, Zn2+, Cr3+, and Pb2+ using the same concentrations and conditions (Fig. 7c). Clearly, a significant EI decrease occurred only in Fe3+ aqueous solution, while others displayed a limited quenching effect. The small EI decrease in Co2+, Ni2+, Cu2+, and Cr3+ may originate from the binding between carboxylic groups and cations.75
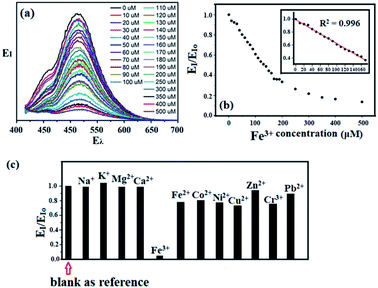 |
| | Fig. 7 (a) EI–Eλ plot against Fe3+ concentration, (b) EI/EIo vs. Fe3+ concentration and highlighted profile at 0–170 µM (inset), and (c) comparison of Fe3+-induced EI/EIo reduction with others. | |
3.4 CQD-made QR codes and trademarks
Quick response (QR) codes are optical labels widely used in admission control, process management, labelling, and packaging of merchandise. However, they can be copied and counterfeited without distortion through screenshots. Here, we demonstrate for the first time CQD-made QR codes, which are only recognized by UV irradiation. Fig. 8a and b demonstrates a low distortion transfer of CQD (HR15) ink from a QR-coded stamp to an ordinary piece of paper (http://www.lib.nthu.edu.tw/) (Fig. 8c). Because CQDs are hydrophilic and fade away with repeated washings (i.e., fastness to washing (FTW)), experiments were then carried out to promote FTW as follows. First, CQDs were dispersed in epoxy–ethanol solution with a ratio of epoxy/curing agent/ethanol = 3![[thin space (1/6-em)]](https://www.rsc.org/images/entities/char_2009.gif) :
:![[thin space (1/6-em)]](https://www.rsc.org/images/entities/char_2009.gif) 1.5
1.5![[thin space (1/6-em)]](https://www.rsc.org/images/entities/char_2009.gif) :
:![[thin space (1/6-em)]](https://www.rsc.org/images/entities/char_2009.gif) 100. It is worth mentioning that epoxy is a thermoset polymer with wear durability and is therefore used as a protective coating. Second, CQDs/epoxy ethanol ink was thermally coated onto synthetic fabrics. Fig. 9a displays a repeatedly washed cotton fabric with an epoxy ink coating in the dark. Upon 395 nm illumination, the PL trademark appears, which is indicative of improved FTW (Fig. 9b). Comparison was also made for CQDs with and without epoxy coatings. Clearly, epoxy-coated CQDs display a similar EI at EλC = 500 nm before and after repeated washings (Fig. 9c). CQDs without epoxy protection, in contrast, completely disappear after washings and do not emit any PL (Fig. 9d).
100. It is worth mentioning that epoxy is a thermoset polymer with wear durability and is therefore used as a protective coating. Second, CQDs/epoxy ethanol ink was thermally coated onto synthetic fabrics. Fig. 9a displays a repeatedly washed cotton fabric with an epoxy ink coating in the dark. Upon 395 nm illumination, the PL trademark appears, which is indicative of improved FTW (Fig. 9b). Comparison was also made for CQDs with and without epoxy coatings. Clearly, epoxy-coated CQDs display a similar EI at EλC = 500 nm before and after repeated washings (Fig. 9c). CQDs without epoxy protection, in contrast, completely disappear after washings and do not emit any PL (Fig. 9d).
 |
| | Fig. 8 (a) QR-coded stamp and HR15-QR-coded paper under (b) dark and (c) bright conditions. | |
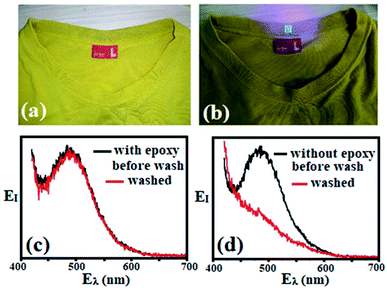 |
| | Fig. 9 A washed cotton fabric with an epoxy-HR15 coating under (a) dark and (b) bright conditions. Comparison of EI–Eλ plots of CQDs (c) with and (d) without epoxy coating before (dark) and after repeated washes (red). | |
4 Conclusions
HR-made CQDs emit green-blue light with high QY, thermal stability at ≤150 °C, and controllable EI and Eλ through UA/CA adjustment. UA serves as a nitrogen source, and the N-doping content ∝ UA/CA was verified. Applications of CQDs were demonstrated, including PL polymer/fibres, stealth QR coding, and labelling at the visible regime, as well as excellent sensing of Fe3+ in aqueous solution.
Author contributions
All authors contributed equally to the manuscript.
Conflicts of interest
The authors declare no competing financial interests.
Acknowledgements
The authors thank the Ministry of Science and Technology of Taiwan for the financial support (MOST-109-2811-M-007-570). This work is also supported by the “High Entropy Materials Centre” from the Featured Areas Research Centre Program within the framework of the Higher Education Sprout Project by the Ministry of Education (MOE) in Taiwan (108QR001J4). The authors also acknowledge the use of F200 HRTEM and ARM200 Cs TEM, which belong to Instrumentation Centre at NTHU under funding by the Ministry of Science and Technology, Taiwan.
Notes and references
- W. Li, Y. Yang, J. Fu, Z. Lin and J. He, ES Energy Environ., 2019, 7, 40–47 Search PubMed , Special Topic on Thermal Metamaterials II, .
- V. P. Bhalekar, P. K. Baviskar, M. B. Rajendra Prasad, B. M. Palve, V. S. Kadam and H. M. Pathan, Eng. Sci., 2019, 7, 38–42 Search PubMed.
- W. Wang, J. Li, P. Ni, B. Liu, Q. Chen, Y. Lu, H. Wu, B. Cao and Z. Liu, ES Mater. Manuf., 2019, 4, 66–73 Search PubMed.
- D. Han, H. Mei, S. Xiao and L. Cheng, Adv. Compos. Hybrid Mater., 2019, 2, 142–150 CrossRef CAS.
- T. K. Das, P. Ghosh and N. C. Das, Adv. Compos. Hybrid Mater., 2019, 2, 214–233 CrossRef CAS.
- M. N. Uddin, H. T. N. Gandy, M. M. Rahman and R. Asmatulu, Adv. Compos. Hybrid Mater., 2019, 2, 339–350 CrossRef CAS.
- M. Ramezankhani, B. Crawford, H. Khayyam, M. Naebe, R. Seethaler and A. S. Milani, Adv. Compos. Hybrid Mater., 2019, 2, 444–455 CrossRef CAS.
- L. Zhao, Q. Ge, J. Sun, J. Peng, X. Yin, L. Huang, J. Wang, H. Wang and L. Wang, Adv. Compos. Hybrid Mater., 2019, 2, 481–491 CrossRef CAS.
- F. Saba, S. A. Sajjadi, S. Heydari, M. Haddad-Sabzevar, J. Salehi and H. Babayi, Adv. Compos. Hybrid Mater., 2019, 2, 540–548 CrossRef CAS.
- Y. Lu, G. Yu, X. Wei, C. Zhan, J.-W. Jeon, X. Wang, C. Jeffryes, Z. Guo, S. Wei and E. K. Wujcik, Adv. Compos. Hybrid Mater., 2019, 2, 711–719 CrossRef CAS.
- M. J. Islam, M. J. Rahman and T. Mieno, Adv. Compos. Hybrid Mater., 2020, 3, 285–293 CrossRef CAS.
- S. O. Mirabootalebi, Adv. Compos. Hybrid Mater., 2020, 3, 336–343 CrossRef CAS.
- Q. Xu, T. Kuang, Y. Liu, L. Cai, X. Peng, T. Sreenivasan Sreeprasad, P. Zhao, Z. Yu and N. Li, J. Mater. Chem. B, 2016, 4, 7204–7219 RSC.
- L. Ai, Y. Yang, B. Wang, J. Chang, Z. Tang, B. Yang and S. Lu, Sci. Bull., 2021, 66, 839–856 CrossRef CAS.
- X. Ma, W. Zhong, J. Zhao, S. L. Suib and Y. Lei, Eng. Sci., 2019, 9, 44–49 Search PubMed.
- A. Chandra and N. Singh, Chem. Commun., 2018, 54, 1643–1646 RSC.
- S. Lu, L. Sui, J. Liu, S. Zhu, A. Chen, M. Jin and B. Yang, Adv. Mater., 2017, 29, 1603443 CrossRef PubMed.
- S. Kalytchuk, Y. Wang, K. Poláková and R. Zbořil, ACS Appl. Mater. Interfaces, 2018, 10, 29902–29908 CrossRef CAS PubMed.
- H. Li, R. Liu, S. Lian, Y. Liu, H. Huang and Z. Kang, Nanoscale, 2013, 5, 3289–3297 RSC.
- X. Huang, L. Yang, S. Hao, B. Zheng, L. Yan, F. Qu, A. M. Asiri and X. Sun, Inorg. Chem. Front., 2017, 4, 537–540 RSC.
- N. Wang, Z. X. Liu, R. S. Li, H. Z. Zhang, C. Z. Huang and J. Wang, J. Mater. Chem. B, 2017, 5, 6394–6399 RSC.
- S. Liu, J. Tian, L. Wang, Y. Zhang, X. Qin, Y. Luo, A. M. Asiri, A. O. Al-Youbi and X. Sun, Adv. Mater., 2012, 24, 2037–2041 CrossRef CAS PubMed.
- W. Lu, X. Qin, S. Liu, G. Chang, Y. Zhang, Y. Luo, A. M. Asiri, A. O. Al-Youbi and X. Sun, Anal. Chem., 2012, 84, 5351–5357 CrossRef CAS PubMed.
- S. Li, D. Amat, Z. Peng, S. Vanni, S. Raskin, G. De Angulo, A. M. Othman, R. M. Graham and R. M. Leblanc, Nanoscale, 2016, 8, 16662–16669 RSC.
- W. Zhou, J. Zhuang, W. Li, C. Hu, B. Lei and Y. Liu, J. Mater. Chem. C, 2017, 5, 8014–8021 RSC.
- Y. Ma, H. Zhang, Y. Zhang, R. Hu, M. Jiang, R. Zhang, H. Lv, J. Tian, L. Chu, J. Zhang, Q. Xue, H.-L. Yip, R. Xia, X. a. Li and W. Huang, ACS Appl. Mater. Interfaces, 2019, 11, 3044–3052 CrossRef CAS PubMed.
- Q.-Y. Li, ES Mater. Manuf., 2021, 12, 1–2 Search PubMed.
- A. Bhorde, R. Waykar, S. R. Rondiya, S. Nair, G. Lonkar, A. Funde, N. Y. Dzade and S. S. Jadkar, ES Mater. Manuf., 2021, 12, 43–52 CAS.
- H. liang, X. Zhang, B. Lin, F. Wang, Z. Cheng, X. Shi and B. G. Lougou, ES Energy Environ., 2020, 10, 22–33 CAS.
- D. Wang and Z. Guo, Eng. Sci., 2020, 11, 1–2 Search PubMed.
- X. Xu, R. Ray, Y. Gu, H. J. Ploehn, L. Gearheart, K. Raker and W. A. Scrivens, J. Appl. Chem. Sci., 2004, 126, 12736–12737 CAS.
- Y.-P. Sun, B. Zhou, Y. Lin, W. Wang, K. A. S. Fernando, P. Pathak, M. J. Meziani, B. A. Harruff, X. Wang, H. Wang, P. G. Luo, H. Yang, M. E. Kose, B. Chen, L. M. Veca and S.-Y. Xie, J. Appl. Chem. Sci., 2006, 128, 7756–7757 CAS.
- L. Wang, X. Chen, Y. Lu, C. Liu and W. Yang, Carbon, 2015, 94, 472–478 CrossRef CAS.
- P. Wu, W. Li, Q. Wu, Y. Liu and S. Liu, RSC Adv., 2017, 7, 44144–44153 RSC.
- W. Li, Y. Liu, B. Wang, H. Song, Z. Liu, S. Lu and B. Yang, Chin. Chem. Lett., 2019, 30, 2323–2327 CrossRef CAS.
- B. Wang, J. Li, Z. Tang, B. Yang and S. Lu, Sci. Bull., 2019, 64, 1285–1292 CrossRef CAS.
- A. Chae, Y. Choi, S. Jo, Nur'aeni, P. Paoprasert, S. Y. Park and I. In, RSC Adv., 2017, 7, 12663–12669 RSC.
- J. Hou, W. Wang, T. Zhou, B. Wang, H. Li and L. Ding, Nanoscale, 2016, 8, 11185–11193 RSC.
- H. Liu, T. Ye and C. Mao, Angew. Chem., Int. Ed., 2007, 46, 6473–6475 CrossRef CAS PubMed.
- C. Hou, B. Wang, V. Murugadoss, S. Vupputuri, Y. Chao, Z. Guo, C. Wang and W. Du, Eng. Sci., 2020, 11, 19–30 CAS.
- S. H. Khan, B. Pathak and M. H. Fulekar, Adv. Compos. Hybrid Mater., 2020, 3, 551–569 CrossRef CAS.
- Y. Liu, L. Jiang, B. Li, X. Fan, W. Wang, P. Liu, S. Xu and X. Luo, J. Mater. Chem. B, 2019, 7, 3053–3058 RSC.
- W.-S. Kuo, C.-Y. Chang, K.-S. Huang, J.-C. Liu, Y.-T. Shao, C.-H. Yang and P.-C. Wu, Int. J. Mol. Sci., 2020, 21 Search PubMed.
- W. Liu, R. Zhang, Y. Kang, X.-y. Zhang, H.-j. Wang, L.-h. Li, H.-p. Diao and W.-l. Wei, New Carbon Mater., 2019, 34, 390–402 CrossRef.
- S. Liao, X. Li, H. Yang and X. Chen, Talanta, 2019, 194, 554–562 CrossRef CAS PubMed.
- H. Shah, Q. Xin, X. Jia and J. R. Gong, Arabian J. Chem., 2019, 12, 1083–1091 CrossRef.
- J. Zhang, X. Chen, Y. Li, S. Han, Y. Du and H. Liu, Anal. Methods, 2018, 10, 541–547 RSC.
- M. Zhou, Z. Zhou, A. Gong, Y. Zhang and Q. Li, Talanta, 2015, 143, 107–113 CrossRef CAS PubMed.
- L. Fang, L. Zhang, Z. Chen, C. Zhu, J. Liu and J. Zheng, Mater. Lett., 2017, 191, 1–4 CrossRef CAS.
- T. Yoshinaga, Y. Iso and T. Isobe, J. Lumin., 2019, 213, 6–14 CrossRef CAS.
- P. Das, S. Ganguly, S. Mondal, M. Bose, A. K. Das, S. Banerjee and N. C. Das, Sens. Actuators, B, 2018, 266, 583–593 CrossRef CAS.
- J. Schneider, C. J. Reckmeier, Y. Xiong, M. von Seckendorff, A. S. Susha, P. Kasák and A. L. Rogach, J. Phys. Chem. C, 2017, 121, 2014–2022 CrossRef CAS.
- J. Zhu, X. Bai, J. Bai, G. Pan, Y. Zhu, Y. Zhai, H. Shao, X. Chen, B. Dong, H. Zhang and H. Song, Nanotechnology, 2018, 29, 085705 CrossRef PubMed.
- H. Ding, J.-S. Wei, N. Zhong, Q.-Y. Gao and H.-M. Xiong, Langmuir, 2017, 33, 12635–12642 CrossRef CAS PubMed.
- Y. Liu, D. Chao, L. Zhou, Y. Li, R. Deng and H. Zhang, Carbon, 2018, 135, 253–259 CrossRef CAS.
- A. N. Fletcher, Photochem. Photobiol., 1969, 9, 439–444 CrossRef CAS PubMed.
- Y. Fang, L. Zhou, J. Zhao, Y. Zhang, M. Yang and C. Yi, Carbon, 2020, 166, 265–272 CrossRef CAS.
- H. Yang, Y. Liu, Z. Guo, B. Lei, J. Zhuang, X. Zhang, Z. Liu and C. Hu, Nat. Commun., 2019, 10, 1789 CrossRef PubMed.
- A. B. Bourlinos, A. Stassinopoulos, D. Anglos, R. Zboril, M. Karakassides and E. P. Giannelis, Small, 2008, 4, 455–458 CrossRef CAS PubMed.
- M. Zhang, H. Ju, L. Zhang, M. Sun, Z. Zhou, Z. Dai, L. Zhang, A. Gong, C. Wu and F. Du, Int. J. Nanomed., 2015, 10, 6943–6953 CAS.
- K.-i. Sasaki, Y. Tokura and T. Sogawa, Crystals, 2013, 3, 120–140 CrossRef CAS.
- Z. Feng, Z. Li, X. Zhang, Y. Shi and N. Zhou, Molecules, 2017, 22, 2061 CrossRef PubMed.
- L. Zhao, F. Di, D. Wang, L.-H. Guo, Y. Yang, B. Wan and H. Zhang, Nanoscale, 2013, 5, 2655–2658 RSC.
- A. N. Emam, S. A. Loutfy, A. A. Mostafa, H. Awad and M. B. Mohamed, RSC Adv., 2017, 7, 23502–23514 RSC.
- Y. Wang, Q. Su and X. Yang, Chem. Commun., 2018, 54, 11312–11315 RSC.
- P. Gombert, H. Biaudet, R. de Seze, P. Pandard and J. Carré, Int. J. Speleol., 2017, 46, 23–31 CrossRef.
- R. Hardman, Environ. Health Perspect., 2006, 114, 165–172 CrossRef PubMed.
- Y. Wang, Y. Zhu, J. Huang, J. Cai, J. Zhu, X. Yang, J. Shen, H. Jiang and C. Li, J. Phys. Chem. Lett., 2016, 7, 4253–4258 CrossRef CAS PubMed.
- X. Wu, W. Li, P. Wu, C. Ma, Y. Liu, M. Xu and S. Liu, Eng. Sci., 2018, 4, 111–118 Search PubMed.
- Y. Chen, Y. Wu, B. Weng, B. Wang and C. Li, Sens. Actuators, B, 2016, 223, 689–696 CrossRef CAS.
- W. Liu, H. Diao, H. Chang, H. Wang, T. Li and W. Wei, Sens. Actuators, B, 2017, 241, 190–198 CrossRef CAS.
- H. Ding, J.-S. Wei and H.-M. Xiong, Nanoscale, 2014, 6, 13817–13823 RSC.
- H. A. Molla, R. Bhowmick, A. Katarkar, K. Chaudhuri, S. Gangopadhyay and M. Ali, Anal. Methods, 2015, 7, 5149–5156 RSC.
- Y. Li, Y. Liu, X. Shang, D. Chao, L. Zhou and H. Zhang, Chem. Phys. Lett., 2018, 705, 1–6 CrossRef CAS.
- F. Yan, Y. Zou, M. Wang, X. Mu, N. Yang and L. Chen, Sens. Actuators, B, 2014, 192, 488–495 CrossRef CAS.
Footnote |
| † Electronic supplementary information (ESI) available: Carbon quantum dots, electrospinning, ion sensing, fluorescent labelling. See DOI: 10.1039/d1ra05106g |
|
| This journal is © The Royal Society of Chemistry 2021 |
Click here to see how this site uses Cookies. View our privacy policy here.  Open Access Article
 *
*
![[thin space (1/6-em)]](https://www.rsc.org/images/entities/char_2009.gif) 000) and PS (Mw = 192
000) and PS (Mw = 192![[thin space (1/6-em)]](https://www.rsc.org/images/entities/char_2009.gif) 000) were purchased from the First Chemical Works (Taiwan) and Sigma-Aldrich. E-132 epoxy resin and H-TK curing agent were obtained from Fong Yong Chemical Co., Ltd. Light fabric transfer papers were purchased from Upsilon Enterprise Co., Ltd.
000) were purchased from the First Chemical Works (Taiwan) and Sigma-Aldrich. E-132 epoxy resin and H-TK curing agent were obtained from Fong Yong Chemical Co., Ltd. Light fabric transfer papers were purchased from Upsilon Enterprise Co., Ltd.
![[thin space (1/6-em)]](https://www.rsc.org/images/entities/char_2009.gif) :
:![[thin space (1/6-em)]](https://www.rsc.org/images/entities/char_2009.gif) 2), followed by HR15 addition. Due to viscosity arising from PS, the electrospinning was carried out at 20 kV with working distance and feeding rate of 10 cm and 3.5 ml h−1, respectively (lower, Table 3).
2), followed by HR15 addition. Due to viscosity arising from PS, the electrospinning was carried out at 20 kV with working distance and feeding rate of 10 cm and 3.5 ml h−1, respectively (lower, Table 3).
![[thin space (1/6-em)]](https://www.rsc.org/images/entities/char_2009.gif) :
:![[thin space (1/6-em)]](https://www.rsc.org/images/entities/char_2009.gif) 10
10![[thin space (1/6-em)]](https://www.rsc.org/images/entities/char_2009.gif) :
:![[thin space (1/6-em)]](https://www.rsc.org/images/entities/char_2009.gif) 10
10![[thin space (1/6-em)]](https://www.rsc.org/images/entities/char_2009.gif) :
:![[thin space (1/6-em)]](https://www.rsc.org/images/entities/char_2009.gif) 10
10![[thin space (1/6-em)]](https://www.rsc.org/images/entities/char_2009.gif) :
:![[thin space (1/6-em)]](https://www.rsc.org/images/entities/char_2009.gif) 8
8
![[double bond, length as m-dash]](https://www.rsc.org/images/entities/char_e001.gif) O (1713 cm−1), C
O (1713 cm−1), C![[double bond, length as m-dash]](https://www.rsc.org/images/entities/char_e001.gif) C (1600 cm−1), C–N (1368 cm−1), and C–O (1060 cm−1) (Fig. 3c).62,63 Third, EDX confirmed the presence of C, O, and N signals with a C/O ratio greater than UA (1.00) and CA (0.86), which is indicative of dehydration during N-CQD formation (Table 4). Four, the doping content ∝ UA/CA again verifies the presence of UA-created N-doping (Table 4). However, doping is absent in ST3, accounting for lower ID/IG and greater C/O ratios (Fig. 3c and Table 4). Fig. S2† shows the XPS results for ST3 and HR15; the latter displays a greater content of N-dopants according to peak area integration (ESI†).
C (1600 cm−1), C–N (1368 cm−1), and C–O (1060 cm−1) (Fig. 3c).62,63 Third, EDX confirmed the presence of C, O, and N signals with a C/O ratio greater than UA (1.00) and CA (0.86), which is indicative of dehydration during N-CQD formation (Table 4). Four, the doping content ∝ UA/CA again verifies the presence of UA-created N-doping (Table 4). However, doping is absent in ST3, accounting for lower ID/IG and greater C/O ratios (Fig. 3c and Table 4). Fig. S2† shows the XPS results for ST3 and HR15; the latter displays a greater content of N-dopants according to peak area integration (ESI†).![[double bond, length as m-dash]](https://www.rsc.org/images/entities/char_e001.gif) C/C–C bonds in the sp2-hybridized domains and barely contributes to PL.13 The peak at 335 nm originates from the nO–π* transition of C
C/C–C bonds in the sp2-hybridized domains and barely contributes to PL.13 The peak at 335 nm originates from the nO–π* transition of C![[double bond, length as m-dash]](https://www.rsc.org/images/entities/char_e001.gif) O/C–OH bonds in amorphous regions, where nO denotes the radiative relaxation of excited lone pairs in oxygen and significantly contributes to blue emission.64 By using quinine sulfate/0.1 M H2SO4 solution as a reference, the QY of ST3 was determined to be 37.5% and 23.3% for Eex = 365 and 395 nm, respectively (Fig. S3, ESI†).
O/C–OH bonds in amorphous regions, where nO denotes the radiative relaxation of excited lone pairs in oxygen and significantly contributes to blue emission.64 By using quinine sulfate/0.1 M H2SO4 solution as a reference, the QY of ST3 was determined to be 37.5% and 23.3% for Eex = 365 and 395 nm, respectively (Fig. S3, ESI†).

![[thin space (1/6-em)]](https://www.rsc.org/images/entities/char_2009.gif) :
:![[thin space (1/6-em)]](https://www.rsc.org/images/entities/char_2009.gif) 1.5
1.5![[thin space (1/6-em)]](https://www.rsc.org/images/entities/char_2009.gif) :
:![[thin space (1/6-em)]](https://www.rsc.org/images/entities/char_2009.gif) 100. It is worth mentioning that epoxy is a thermoset polymer with wear durability and is therefore used as a protective coating. Second, CQDs/epoxy ethanol ink was thermally coated onto synthetic fabrics. Fig. 9a displays a repeatedly washed cotton fabric with an epoxy ink coating in the dark. Upon 395 nm illumination, the PL trademark appears, which is indicative of improved FTW (Fig. 9b). Comparison was also made for CQDs with and without epoxy coatings. Clearly, epoxy-coated CQDs display a similar EI at EλC = 500 nm before and after repeated washings (Fig. 9c). CQDs without epoxy protection, in contrast, completely disappear after washings and do not emit any PL (Fig. 9d).
100. It is worth mentioning that epoxy is a thermoset polymer with wear durability and is therefore used as a protective coating. Second, CQDs/epoxy ethanol ink was thermally coated onto synthetic fabrics. Fig. 9a displays a repeatedly washed cotton fabric with an epoxy ink coating in the dark. Upon 395 nm illumination, the PL trademark appears, which is indicative of improved FTW (Fig. 9b). Comparison was also made for CQDs with and without epoxy coatings. Clearly, epoxy-coated CQDs display a similar EI at EλC = 500 nm before and after repeated washings (Fig. 9c). CQDs without epoxy protection, in contrast, completely disappear after washings and do not emit any PL (Fig. 9d).


