 Open Access Article
Creative Commons Attribution 3.0 Unported Licence
A facile green and one-pot synthesis of grape seed-derived carbon quantum dots as a fluorescence probe for Cu(II) and ascorbic acid†
Jiawei Li,
Ouwen Xu and
Xiashi Zhu *
*
School of Chemistry & Chemical Engineering, College of Guangling, Yangzhou University, Yangzhou, 225002, PR China. E-mail: zhuxiashi@sina.com
First published on 20th October 2021
Abstract
In this study, an on–off–on fluorescence probe for the detection of trace Cu(II) and ascorbic acid (AA) based on biomass-derived sulfur and nitrogen double heteroatom-doped carbon dots (N,S-CDs) was designed. For the first time, the probe (N,S-CDs) was prepared from grape seeds and thiourea as the precursor. Cu(II) was added to the carbon point solution, the fluorescence intensity (FL) of N,S-CDs was strongly quenched (switch OFF) and the fluorescence probe turned to “ON” (switch ON) with the addition of AA. Under the optimal conditions, the as-synthesized N,S-CDs had a good detection performance for Cu(II) and AA assay with the linearity ranges from 150–500 μg mL−1 and 0.1–400 μg mL−1, and the LODs were 0.048 mg L−1 and 0.036 mg L−1, respectively. The as-prepared N,S-CDs exhibited a low cytotoxicity and a good biocompatibility, which show their potential for application in the biological imaging of living cells.
1. Introduction
Carbon dots (CDs) have been applied in pharmaceutical analysis, bio-imaging and other fields due to their advantages of high photostability, good biocompatibility, low toxicity, and excellent optical properties.1 The carbon source is one of the important conditions that directly affects the properties of the CDs.2 Carbon sources mainly include organic chemicals (citric acid,3 etc.) and biomass (plants,4 animals5 and their derivatives6). Due to the high nitrogen content,7 low cost, and good biocompatibility of biomass,8 more and more biomass-derived carbon dots were synthesized, such as soy milk9 (Yu = 8.6%, Yu is the fluorescence quantum yield) and bamboo leaves10 (Yu = 7.1%). Heteroatom doping is a conventional technique to modify CDs.11 Nitrogen,12 phosphorus,13 boron14 and sulfur15 are often doped into CDs. Heteroatoms can be introduced to the surface of CDs to provide more active centers, and add the carbon core of CDs to adjust the bandgap and establish new energy levels,16,17 thereby greatly enhancing the fluorescence intensity of doped CDs.Grape is one of the widely grown fruit crops in the world, with an annual output of about one million ton. Every year, a large amount of grape waste (peels and seeds) is produced, accounting for 13.5–14.5% of the total production.18 This type of biological residue is usually used as a fertilizer or discarded. However, its seeds contain numerous polyphenols,19 which can be used as a good carbon and nitrogen source for CD production. In this study, grape seed was used as the carbon source, thiourea was used as the source of doping elements, and nitrogen and sulfur introduction was carried out for the first time for the facile one-pot synthesis of biomass-derived N–S-CDs. The fluorescence probe was designed by quenching N,S-CDs with Cu(II), followed by a fluorescence recovery by the reaction of Cu(II) with AA. The fluorescence changes of N,S-CDs were directly related to the concentrations of AA and Cu. Further, the fluorescence probe had advantages in the detection of Cu(II) and AA in real samples, and showed a good result. Besides, N,S-CDs have been used in cells DU145 for cell imaging.
2. Experimental
2.1. Chemicals and materials
Grape seeds were purchased from Chinese pharmacy (Yangzhou, China). Quinine sulfate was purchased from Aladdin (Shanghai, China). CuSO4, FeCl3·6H2O, FeSO4, CoCl2, AgNO3, Pb(NO3)2, ZnSO4, Cr(NO3)3, NiSO4, MgCl2, CaCl2, MnCl2, AlCl3, NaCl and CH4N2S were purchased from Sinopharm Chemical Reagent Co, Ltd (Shanghai, China). All reagents were of analytical reagent grade.2.2. Instruments
A BSA224S Analytical balance (Suzhou Sainz Instrument Co., Ltd), MARS 6240/50 Microwave Digestion Apparatus (Peian Technology Company, USA), PHS-25 pH meter (Shanghai INESA Electronics Co, Ltd), F-7000 Fluorescence spectrophotometer (Hitachi, Japan), KQ-50E Ultrasonic cleaner (Kunshan Ultrasonic Instrument Co. Ltd), and thermo-1780 Ultraviolet spectrophotometer (Thermo Fisher Scientific, Inc.) were used to carry out the experiment.2.3. Synthesis of N,S-CDs
We washed grape seeds and dried them in a drying box. Then, the grape seeds were ground into powder and used as the carbon source for synthesising N,S-CDs. 2.50 g of this powder and 3.0 g of thiourea were mixed into a 25.0 mL aqueous solution under magnetic stirring for 30 min. The solution was transferred to a polytetrafluoroethylene autoclave and heated at 200 °C for 8 h. After cooling down to room temperature, the resultant dark brownish suspension was centrifuged at 10![[thin space (1/6-em)]](https://www.rsc.org/images/entities/char_2009.gif) 000 rpm for 20 min to remove large dots. The transparent solution was dialyzed for 24 h using a dialysis membrane (cut off 1/4 3500 Da).
000 rpm for 20 min to remove large dots. The transparent solution was dialyzed for 24 h using a dialysis membrane (cut off 1/4 3500 Da).
2.4. Fluorescence quantum yield (Yu)
We measured quantum yield (Yu) via the reference method.20 Under the same wavelength, the absorbance, FL and integral FL of the two diluted solutions of the test sample and the reference substance were respectively measured, and calculated by substituting them into the following eqn (1)| Yu = Ys × Fu/Fs × As/Au | (1) |
2.5. Recommended procedure
For the determination of Cu(II) and AA, 0.50 mg mL−1 of N,S-CD aqueous solution (1.0 mL) was mixed with a buffer solution (ammonium acetate buffer, pH = 7) and the undetected solution to obtain a 4 mL solution. The fluorescence emission spectra of Cu(II) and AA in a solution were recorded at an excitation wavelength of 430 nm and emission wavelength of 490 nm, and both excitation and emission slits were 5.0 nm.2.6. Preparation of real sample
Water samples were pre-treated with a 0.22 μm micro-pore film filter. The actual water samples were added with different concentrations of the Cu(II) standard solutions and analyzed without any pretreatment.For the fruit juice, different concentrations of AA were introduced into 0.5 mL fruit juice. After that, the mixture was centrifuged at 80![[thin space (1/6-em)]](https://www.rsc.org/images/entities/char_2009.gif) 000 rpm for 30 min. Finally, the sample was collected and used for the detection of AA.
000 rpm for 30 min. Finally, the sample was collected and used for the detection of AA.
2.7. Cell viability assay
MTT assay was used to determine the cell viability. The cells were incubated with different concentrations of N,S-CDs for 24 h, with cells treated with 0.1% DMSO as the control. After 24 h of incubation, the cells were added with 20 μL 5 mg mL−1 MTT of glucose, and then cultured at 37 °C for a 4 h incubation. The optical density (OD) at 470 nm of the final nail was measured on a universal microplate reader EL800. The cell proliferation inhibition rate was calculated according to the formula: 1 − OD (experiment)/OD (control) × 100%.2.8. Cellular imaging
Human prostate epithelial cell line RWPE-1 and human prostate cancer cell line DU145 were obtained from the cell bank of Shanghai Institute of Biochemistry and cell biology, Chinese Academy of Sciences. RWPE-1 cells were grown in DU145 cells in RPMI-1640 supplemented with 10% fetal bovine serum (Gibco, Waltham, USA), 100 U mL−1 penicillin, and 100 U mL−1 streptomycin, which was cultured in a humidified incubator (5% CO2, 37 °C).3. Results and discussion
3.1. Characterization of N,S-CDs
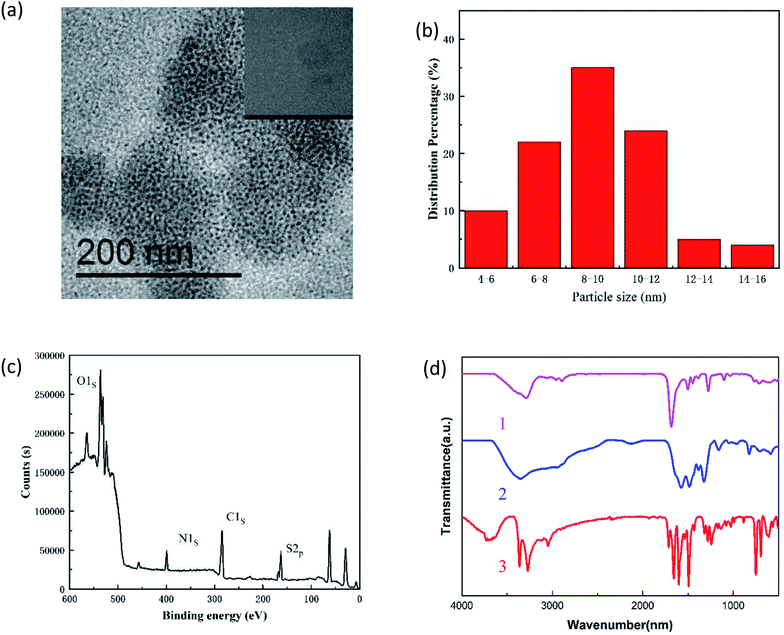
The morphology, structure, elements, and surface groups of the N,S-CDs were analysed.The TEM image of newly prepared N,S-CDs is shown in Fig. 1a. The well-monodispersed N,S-CDs had a uniformly spherical shape, with an average diameter of 8.9 nm and a concentrated size distribution (Fig. 1b). In addition, the HRTEM image (inserted in Fig. 1a) reveals a clear crystal lattice distance of 0.24 nm, similar to the (1120) lattice fringe of graphene. The above observations indicated that N,S-CDs had crystalline properties, as evidenced by a clear fringe distance of 0.22 nm, which was similar to the (1120) characteristic lattice fringes of graphene.21 The analysis results of XPS are shown in Fig. 1c. Four peaks around 165.18 eV, 285.12 eV, 532.12 eV, and 400.12 eV can be attributed to sulfur, carbon, oxygen and nitrogen, respectively, indicating the successful doping of N and S atoms. FT-IR spectroscopy was used for the identification of the functional groups in N,S-CDs. As shown in Fig. 1d, curve 1, curve 2 and curve 3 were the FT-IR spectra of grape seed, thiourea and N,S-CDs, respectively. As for curve 1, the peak at 3510 cm−1 was induced due to the O–H or N–H stretching vibrations, whereas the peaks at 3040 and 1595 cm−1 are attributed to the C–H and C![[double bond, length as m-dash]](https://www.rsc.org/images/entities/char_e001.gif) O stretching vibrations, respectively. The absorption at 1451 cm−1 was attributed to the C–N stretching vibration, and compared to curve 2, the new absorption at 1123 cm−1 was attributed to the stretching vibrations of C–S. The FTIR and XPS results demonstrated that the as-synthesized N,S-CDs had different chemical bonds and surface functional groups, which indicated that the N,S-CDs had good water solubility, and the N,S-CDs were synthesized successfully.
O stretching vibrations, respectively. The absorption at 1451 cm−1 was attributed to the C–N stretching vibration, and compared to curve 2, the new absorption at 1123 cm−1 was attributed to the stretching vibrations of C–S. The FTIR and XPS results demonstrated that the as-synthesized N,S-CDs had different chemical bonds and surface functional groups, which indicated that the N,S-CDs had good water solubility, and the N,S-CDs were synthesized successfully.
3.2. Properties of N,S-CDs
3.3. Optimization of the detection conditions for Cu(II) and AA
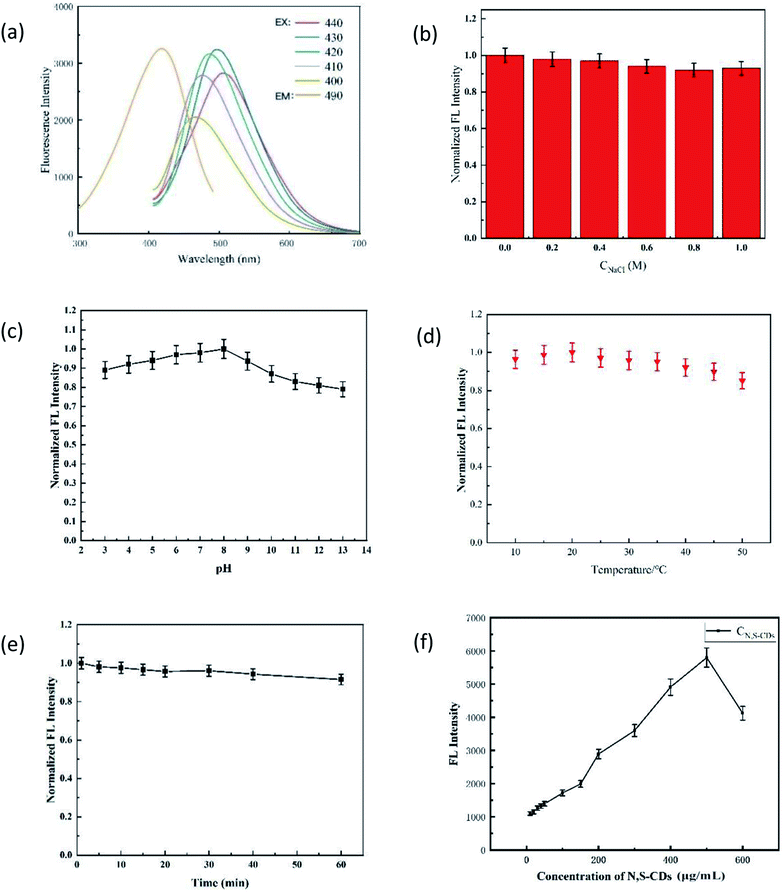
In this experiment, the pH value, ionic strength, and reaction temperature were optimized.The influence of pH on the fluorescence probe is shown in Fig. 4a. ΔFCu-off and ΔFAA-on had similar changing trends with pH, and both had the best values when pH = 7.0. The reasons for this phenomenon may be the same as that ΔFCu-off and ΔFAA-on that (1) the interaction between N,S-CDs and Cu(II) would be enhanced with the increase in pH (3.0–7.0) (ΔFCu-off↑), and weakened with the increase in pH (7.0–13.0) due to the side reaction coefficient of hydroxyl increased in the alkaline medium (ΔFCu-off↓);22–24 (2) AA in the enediol group and the lactone group were easily deprotonated to radical cation at suitable pH, thus binding with Cu(II) stably (ΔFAA-on↑); however, the hydrolysis of the lactone ring in AA and the structure of AA would be destroyed under alkaline conditions, and the hydrolysis of AA was greater than the redox effects.25 Therefore, the pH value of the system was controlled to 7.0 in the process of detecting Cu(II) and AA.
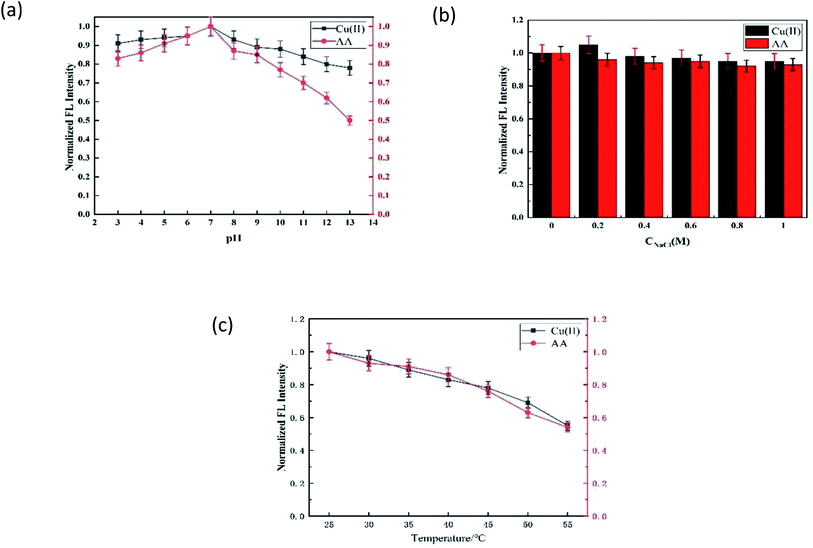 | ||
| Fig. 4 Optimization of the detection conditions for Cu(II) and AA. Effect of (a) pH, (b) ionic strength (c) and temperature. | ||
The effect of the ionic strength on the results of determination can be ignored (Fig. 4b). The ΔFCu-off and ΔFAA-on reached the maximum at 30 °C, which then decreased with the increase in the temperature (Fig. 4c).26 Thus, the optimized pH of 7.0 and temperature of 25 °C were adopted in the following experiments.
3.4. Selectivity of Cu(II) and AA
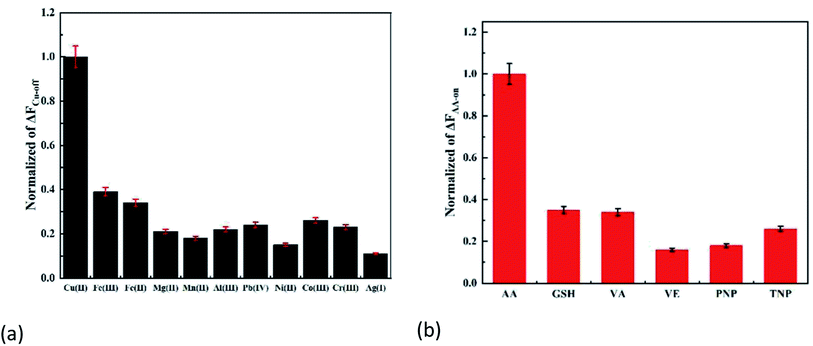
Different interferences were selected to evaluate the potential selectivity of the method. As shown in Fig. 5a and b, ΔFCu-off and ΔFAA-on did not change obviously in the presence of the same concentration of interferences, and the corresponding effect was the best. The results indicated that the interferences can be ignored.The allowable interference multiple (±5%) of Cu(II) and AA detection were determined (Table 1). It can be shown that the probe had a strong anti-interference ability.
| Interference of Cu | Multiple (M/Cu(II)) | Interference of AA | Multiple (M/AA) |
|---|---|---|---|
| Fe(III) | 3 | GSH | 2 |
| Fe(II) | 15 | VE | 3 |
| Mg(II) | 50 | VA | 5 |
| Co(II) | 50 | PNP | 10 |
| Ca(II) | 50 | TNP | 10 |
| Ni(II) | 100 | — | — |
| K(I) | 100 | — | — |
3.5. Analysis performance of Cu(II) and AA
The specifically analyzed performances are shown in Table 2. Compared to other detection methods, the LODs of Cu(II) and AA were much lower than those of in previous studies(Table 3).| Cu(II) | AA | |
|---|---|---|
| Linear | y = 7.3180 × 10⁻⁴x + 0.0626 | y = 0.0059x + 1.084 |
| R2 | 0.99908 | 0.99102 |
| Linear range | 0.150–500 μg mL−1 | 0.100–400 μg mL−1 |
| LOD | 0.048 μg mL−1 | 0.036 μg mL−1 |
| RSD | 0.28% | 0.41% |
3.6. Detection of Cu(II) and AA in real samples
Tap water, Baodai River, lemon juice, and orange juice were selected as real samples to explore the practicability of N,S-CDs in the detection of real samples. The results are shown in Tables 4 and 5. No copper ion was detected in real samples. The concentration of AA in the lemon juice and orange juice were 198 μg mL−1 and 43.2 μg mL−1, respectively. The recoveries of Cu(II) and AA in these samples were 97.5–99.4% and 98.1–102.0%, respectively. These results show that N,S-CDs can be used to detect Cu(II) and AA in practical samples with excellent performances.| Sample | Cu(II) added (μg mL−1) | Cu(II) found (μg mL−1) | Recovery (%) |
|---|---|---|---|
| Tap water | 0 | — | — |
| 2.00 | 2.09 | 104.50% | |
| 4.00 | 3.83 | 95.75% | |
| 6.00 | 6.14 | 102.33% | |
| 8.00 | 7.93 | 99.13% | |
| Baodai river | 0 | — | — |
| 2.00 | 1.96 | 98.00% | |
| 4.00 | 4.13 | 103.25% | |
| 6.00 | 6.09 | 101.50% | |
| 8.00 | 7.86 | 98.25% |
| Sample | Added (μg mL−1) | AA found (μg mL−1) | Recovery (%) |
|---|---|---|---|
| Lemon juice | 0.00 | 201.1 | — |
| 11.7 | 208.9 | 98.1 | |
| 23.4 | 223.0 | 99.4 | |
| 35.1 | 234.0 | 99.1 | |
| 46.8 | 246.6 | 97.5 | |
| Orange juice | 0.00 | 43.2 | — |
| 11.7 | 56.1 | 102.2 | |
| 23.4 | 65.3 | 98.1 | |
| 35.1 | 77.3 | 98.7 | |
| 46.8 | 92.3 | 102.5 |
3.7. Fluorescence quenching mechanism
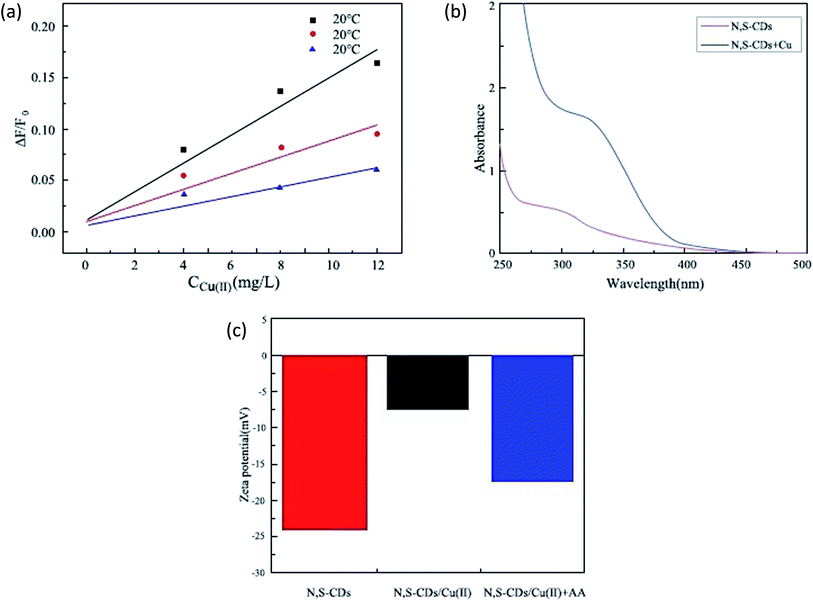
There are numerous reasons for fluorescence quenching, such as electron transfer, molecular rearrangement, formation of nonfluorescent complexes and intermolecular collision quenching,27 which can be discussed by quenching kinetics, UV spectrum and zeta potential.ln![[thin space (1/6-em)]](https://www.rsc.org/images/entities/char_2009.gif) K = −(ΔHΘ/RT) + (ΔSΘ/R) K = −(ΔHΘ/RT) + (ΔSΘ/R) |
3.8. Fluorescence recovery mechanism
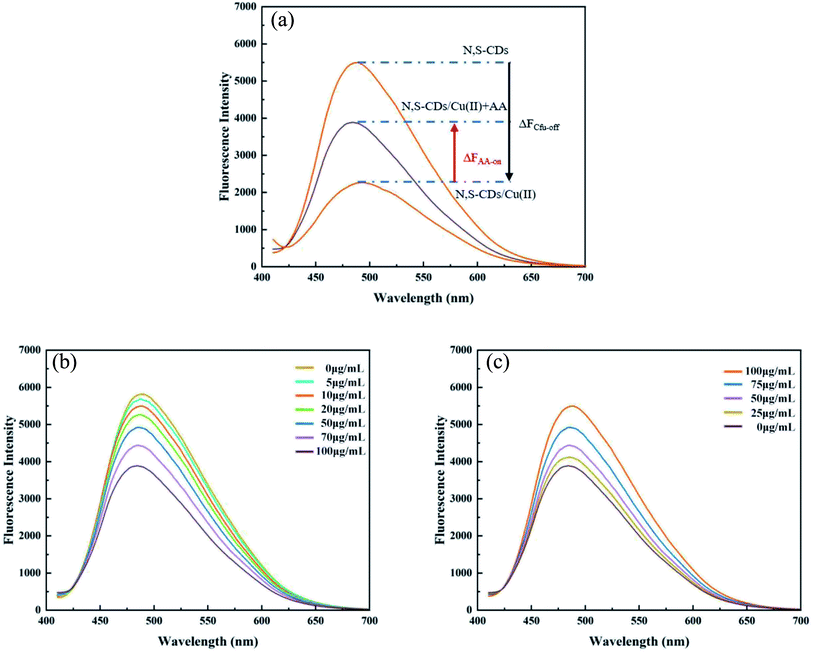
The restore of fluorescence in the system was mainly attributed to the competitive coordination mechanism and redox mechanism. For the competition mechanism, Cu(II) could chelate with several hydroxyl groups in AA efficiently, taking Cu(II) away from the N,S-CD/Cu-based non-luminescence and making the N,S-CD return to the original state, leading to the result that fluorescence reappeared and “turned on”. Simultaneously, some researchers believe that Cu(II) can be reduced to Cu(I) by AA, and Cu(I) has no empty orbit for –COOH and –NH2 of the N,S-CDs, which makes Cu(II) separate from the surface of the N,S-CDs, and leads to the fluorescence recovery.35,363.9. Biological assay
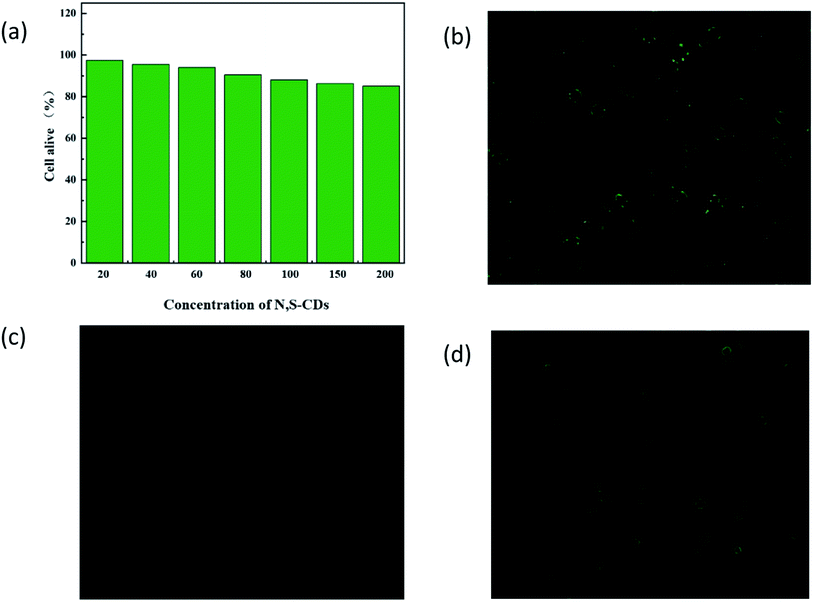
It is necessary to investigate the biocompatibility of N,S-CDs before cell imaging. Therefore, the cytotoxicity of N,S-CD was studied using human DU145 cells in the MTT assay. The results are shown in Fig. 7a. Evidently, after 24 h of incubation with 200 mg mL−1 N,S-CDs, the cell viability still exceeded 85%. Therefore, the as-synthesized N,S-CDs were reliable for cell imaging in vitro. According to Fig. 7b, DU145 cells were incubated in the N,S-CD solution (20.0 mg mL−1), and the green excitation image clearly showed a strong green fluorescence, indicating that a large number of N,S-CDs penetrated into the cell membrane, and no photoluminescence was observed in the nucleus. Subsequently, a 50.0 mM Cu(II) solution was added to DU145 cells treated with N,S-CDs, and the intracellular fluorescence decreased significantly (Fig. 7c). When the cells incubated with N,S-CDs/Cu(II) were further treated with an increased concentration of AA, the gradually restored fluorescence is observed in the cells, as shown in the Fig. 7d. These observations support a highly selective and switchable fluorescence process in living cells. Therefore, the probe has a potential application value in prostate cancer cell imaging.4. Conclusion
This study attempted to develop an on–off–on probe based on a simple, economical and eco-friendly hydrothermal synthesis of N,S-CDs using grape seeds and thiourea as the starting materials. The results provided that the method can be used for the determination of Cu(II) and AA in real samples, and had broad application prospects in water quality monitoring, food quality supervision, biological imaging and other fields.Conflicts of interest
There are no conflicts to declare.Acknowledgements
The authors acknowledge the financial support from the National Natural Science Foundation of China (21375117) and from a project funded by the Priority Academic Program Development of Jiangsu Higher Education Institutions and Postgraduate research/practice innovation program of Jiangsu province.References
- S. N. Ali Shah and J. M. Lin, Recent advances in chemiluminescence based on carbonaceous dots, Adv. Colloid Interface Sci., 2017, 241, 24–36 CrossRef PubMed
.
- L. L. Zhu, D. K. Shen, C. F. Wu and S. Gu, State-of-the-Art on the Preparation, Modification, and Application of Biomass-Derived Carbon Quantum Dots, Ind. Eng. Chem. Res., 2020, 59, 22017–22039 CrossRef CAS
.
- S. Zoughi, F. Faridbod, A. Amiri and M. R. Ganjaliab, Detection of tartrazine in fake saffron containing products by a sensitive optical nanosensor, Food Chem., 2020, 350, 129197 CrossRef PubMed
.
- K. Sifa, D. Ilyas, O. Yunus and E. Ramazan, Graphene quantum dots prepared from dried lemon leaves and microcrystalline mosaic structure, Luminescence, Luminescence, 2021, 23, 1365–1376 Search PubMed
.
- S. S. Fometu, G. H. Wu, L. Ma and J. S. Davids, A review on the biological effects of nanomaterials on silkworm (Bombyx mori), Beilstein J. Nanotechnol., 2021, 12, 190–202 CrossRef CAS PubMed
.
- N. Architha, M. Ragupathi, C. Shobana and T. Selvankumar, Microwave-assisted green synthesis of uorescent carbon quantum dots from Mexican Mint extract for Fe3+ detection and bio-imaging applications, Anal. Methods, 2021, 13, 789–795 RSC
.
- C. Xu, M. Nasrollahzadeh and M. Selva, Waste-to-wealth: biowaste valorization into valuable bio(nano)materials, Chem. Soc. Rev., 2019, 18, 4791–4822 RSC
.
- W. X. Meng, X. Bai and B. Y. Wang, Biomass-Derived Carbon Dots and Their Applications, Energy Environ. Mater., 2019, 2, 172–192 CrossRef CAS
.
- R. Su, D. Wang, M. Liu, J. Yan, J. Wang, Q. Xin, Q. Zhan, Y. Pu, N. R. Foster and J.-F. Chen, Subgram-Scale Synthesis of Biomass Waste-Derived Fluorescent Carbon Dots in Subcritical Water for Bioimaging, Sensing, and Solid-State Patterning, ACS Omega, 2018, 3, 13211–13218 CrossRef CAS PubMed
.
- Y. Park, J. Yoo, B. Lim, W. Kwon and S. W. Rhee, One-step green synthesized fluorescent carbon nanodots from bamboo leaves for copper(II) ion detection, Sens. Actuators, B, 2014, 196, 647–652 CrossRef
.
- X. Wang, G. Sun, P. Routh, D. H. Kim, W. Huang and P. Chen, Heteroatom-doped graphene materials: syntheses, properties and applications, Chem. Soc. Rev., 2014, 43, 7067–7098 RSC
.
- H. Qi, M. Teng, M. Liu, S. Liu, J. Li and H. Yu, iomass-derived Nitrogen-doped Carbon Quantum Dots: Highly Selective Fluorescent Probe for Detecting Fe3+ Ions and Tetracyclines, Sens. Actuators, B, 2019, 539, 332–341 CAS
.
- D. G. Babar, S. K. Sonkar, K. M. Tripathi and S. Sarkar, P2O5 Assisted Green Synthesis of Multicolor Fluorescent Water-Soluble Carbon Dots, J. Nanosci. Nanotechnol., 2014, 14, 2334–2342 CrossRef CAS PubMed
.
- M. K. Barman, B. Jana, S. Bhattacharyya and A. Patra, Photophysical Properties of Doped Carbon Dots (N, P, and B) and Their Influence on Electron/Hole Transfer in Carbon Dots-Nickel (II) Phthalocyanine Conjugates, Carbon, 2014, 118, 20034–20041 CAS
.
- F. Nemati, M. Hosseini, R. Zare-Dorabei, F. Salehnia and M. R. Ganjali, Fluorescent turn on sensing of Caffeine in food sample based on sulfur-doped carbon quantum dots and optimization of process parameters through response surface methodology, Sens. Actuators, B, 2018, 273, 25–34 CrossRef CAS
.
- H. Liu, J. Ding, K. Zhang and L. Ding, Redox cycling of iron by carbon dot enhanced chemiluminescence: mechanism of electron–hole induction in carbon dot, Phys. Chem. Chem. Phys., 2017, 19, 21604 RSC
.
- Y. Zheng, D. K. Zhang, S. N. A. Shah and J. M. Lin, Ultra-weak chemiluminescence enhanced by facilely synthesized nitrogen-rich quantum dots through chemiluminescence resonance energy transfer and electron hole injection, Chem. Commun., 2017, 53, 5657 RSC
.
- S. Ahmadian-Fard-Fini, M. Salavati-Niasari and D. Ghanbari, Hydrothermal green synthesis of magnetic Fe3O4-carbon dots by lemon and grape fruit extracts and as a photoluminescence sensor for detecting of E. coli bacteria, Spectrochim. Acta A Mol. Biomol., 2018, 203, 481–493 CrossRef CAS PubMed
.
- P. Zhang, S. S. Zhao, J. J. Wang and X. R. Liu, Nitrogen-doped carbon dots from Hutai-8 grape skin and their application in Hg2+ detection, Curr. Nanosci., 2021, 17, 338–347 CrossRef CAS
.
- F. Nemati, M. Hosseini, R. Zare-Dorabei, F. Salehnia and M. R. Ganjali, Fluorescent turn on sensing of Caffeine in food sample based on sulfur-doped carbon quantum dots and optimization of process parameters through response surface methodology, Sens. Actuators, B, 2018, 273, 25–34 CrossRef CAS
.
- S. Zhu, J. Zhang, S. Tang, C. Qiao, L. Wang, H. Wang, X. Liu, B. Li, Y. Li, W. Yu, X. Wang, H. Sun and B. Yang, Surface chemistry routes to modulate the photo luminescence of graphene quantum dots: from fluorescence mechanism to up conversion bioimaging applications, Adv. Funct. Mater., 2012, 22, 4732–4740 CrossRef CAS
.
- C. Xia, S. Zhu, T. Feng, M. Yang and B. Yang, Evolution and Synthesis of Carbon Dots: From Carbon Dots to Carbonized Polymer Dots, Adv. Sci., 2019, 6(23), 1901316 CrossRef CAS PubMed
.
- Y. H. Chen, M. T. Zheng, Y. Xiao, H. W. Dong, H. R. Zhang, J. L. Zhuang, H. Hu, B. F. Lei and Y. L. Liu, A Self-Quenching-Resistant Carbon-Dot Powder with Tunable Solid-State Fluorescence and Construction of Dual-Fluorescence Morphologies for White Light-Emission, Adv. Mater., 2016, 28, 312–318 CrossRef CAS PubMed
.
- Y. Liang, L. Xu, K. Tang, Y. Guan, T. Wang, H. Wang and W. W. Yu, Nitrogen-doped carbon dots used as an “on-off-on” fluorescent sensor for Fe3+ and glutathione detection, Dyes Pigm., 2020, 178, 108358 CrossRef CAS
.
- S. Dutta Choudhury, J. M. Chethodil, P. M. Gharat, P. K. Praseetha and H. Pal, PH-Elicited Luminescence Functionalities of Carbon Dots: Mechanistic Insights, J. Phys. Chem. Lett., 2017, 8, 1389–1395 CrossRef CAS PubMed
.
- X. Luo, W. Zhang, Y. Han, X. Chen, L. Zhu, W. Tang, J. Wang, T. Yue and Z. Li, N,S co-doped carbon dots based fluorescent “on-off-on” sensor for determination of ascorbic acid in common fruits, Food Chem., 2018, 258, 214–221 CrossRef CAS PubMed
.
- M. J. Molaei, Principles, mechanisms, and application of carbon quantum dots in sensors: a review, Anal. Methods, 2020, 12, 1266–1287 RSC
.
- F. L. Zu, F. Y. Yan, Z. J. Bai, J. X. Xu, Y. Y. Wang, Y. C. Huang and X. G. Zhou, The quenching of the fluorescence of carbon dots: A review on mechanisms and applications, Microchim. Acta, 2017, 184, 1899–1914 CrossRef CAS
.
- B. Hemmateenejad, M. Shamsipur, F. Samari and H. R. Rajabi, Study of the interaction between human serum albumin and Mn-doped ZnS quantum dots, J. Iran. Chem. Soc., 2015, 12, 1729–1738 CrossRef CAS
.
- T. D. Gauthier, E. C. Shane, W. F. Guerin, W. R. Seitz and C. L. Grant, Fluorescence quenching method for determining equilibrium constants for polycyclic aromatic hydrocarbons binding to dissolved humic materials, Environ. Technol., 1986, 20, 1162–1166 CAS
.
- R. Rahnemaie, T. Hiemstra and W. H. van Riemsdijk, Geometry, charge distribution, and surface speciation of phosphate on goethite, Langmuir, 2007, 23, 3680–3689 CrossRef CAS PubMed
.
- G. Hu, L. Ge, Y. Li and M. Mukhtar, Carbon dots derived from flax straw for highly sensitive and selective detections of cobalt, chromium, and ascorbic acid, J. Colloid Interface Sci., 2020, 579, 96–108 CrossRef CAS PubMed
.
- Y. Zhao, S. Jing and X. Peng, Synthesizing green carbon dots with exceptionally high yield from biomass hydrothermal carbon, Cellulose, 2020, 27(1), 415–428 CrossRef CAS
.
- Y. S. Liu and Y. Y. Zhang, One-step green synthesized fluorescent carbon nanodots from bamboo leaves for copper(II) ion detection, Sens. Actuators, B, 2014, 196, 647–652 CrossRef CAS
.
- S. N. AliShaha, X. Dou, M. Khan, K. Uchiyama and J. M. Lin, N-doped carbon dots/H2O2 chemiluminescence system for selective detection of Fe2+ ion in environmental samples, Talanta, 2019, 196, 370–375 CrossRef PubMed
.
- S. N. AliShaha, H. F. Lia and J. M. Lin, Enhancement of periodate-hydrogen peroxide chemiluminescence by nitrogen doped carbon dots and its application for the determination of pyrogallol and gallic acid, Talanta, 2016, 153, 23–30 CrossRef PubMed
.
Footnote |
| † Electronic supplementary information (ESI) available. See DOI: 10.1039/d1ra05656e |
| This journal is © The Royal Society of Chemistry 2021 |

