 Open Access Article
Selective and sensitive electrochemical sensors based on an ion imprinting polymer and graphene oxide for the detection of ultra-trace Cd(II) in biological samples†
A. B. Abdallah *a,
Mohamed R. El-kholany
 a,
A. F. S. Molouka,
Tamer Awad Alib,
A. A. El-Shafeia and
Magdi E. Khalifaa
aDepartment of Chemistry, Faculty of Science, Mansoura University, El-Gomhoria Street, Mansoura-35516, Egypt. E-mail: ahmed.bahgat@mans.edu.com; Tel: +20 1090433273
bEgyptian Petroleum Research Institute, 12622, Egypt
First published on 15th September 2021
Abstract
New selective and sensitive electrochemical sensors were designed based on the deposition of a promising ion imprinted polymer (IIP) on the surface of glassy carbon electrode (GCE) for the detection and monitoring of Cd(II) in different real samples. Herein, a highly selective Cd-imprinted polymer was successfully synthesized using a novel heterocyclic compound based on the benzo[f]chromene scaffold that acted as a complexing agent and a functional monomer in the presence of azobisisobutyronitrile (initiator) and ethylene glycol dimethacrylate (cross-linker). The characterization of the synthesized chelating agent and IIP was performed using FT-IR, SEM, 1H-NMR, EIMS, and EDX analyses. After that, the voltammetric sensor was manufactured by introducing graphene oxide (GO) on the surface of GCE; then, the IIP was grown by a drop coating technique. The electrochemical characterization of the voltammetric sensor (IIP/GO@GCE) was performed by CV and EIS. For comparison, the potentiometric sensor was also prepared by embedding IIP in plasticized polyvinyl chloride and depositing it as one layer on the GCE surface. Anodic stripping voltammetry was used to construct the calibration graph; the IIP/GO@GCE exhibited a wider detection range (4.2 × 10⁻¹²–5.6 × 10⁻³ mol L−1) and extremely low detection limit (7 × 10⁻¹⁴ mol L−1) for Cd(II). Meanwhile, the potentiometric sensor showed a linear calibration curve for Cd(II) over a concentration range from 7.3 × 10⁻⁸ mol L−1 to 2.4 × 10⁻³ mol L−1 with a detection limit of 6.3 × 10⁻¹⁰ mol L−1. Furthermore, both sensors offered outstanding selectivity for Cd(II) over a wide assortment of other common ions, high reproducibility, and excellent stability.
1. Introduction
Cadmium (Cd) is one of the most utilized metals in agriculture and industry, with application such as pigments, electric batteries, nuclear reactors, and electronic components, in addition to various biological interests.1–3 Despite the widespread use of cadmium, it is considered one of the most detrimental heavy metals for human health. According to the World Health Organization (WHO), the maximum permissible limits of Cd for the human body have been established at 3.0 to 5.0 μg L−1.4 Therefore, most exposure of humans to Cd from various sources becomes highly toxic for a relatively long time. An excess cadmium induces hepatotoxicity due to increasing liver-related proteins such as nuclear factor erythroid 2-related factor 2 (Nrf2) and Kelch-like ECH-associated protein 1 (Keap1), which are carried to the kidneys and finally lead to kidney failure.5–7 Furthermore, bioaccumulation of Cd in the human body leads to blood cancer, heart disease, and a series of organ dysfunctions.6 Therefore, the recognition and determination of cadmium concentration via sensitive, selective, and simple analytical methods is essential for health and pollution control. Atomic absorption spectrophotometry, capillary electrophoresis, plasma atomic emission spectrometry, and flame atomic fluorescence spectrometry are the most popular methods for cadmium determination.8–11 Unfortunately, many of these analytical techniques are not convenient for popular usage due to their long time consumption, and they often require professional operators and costly instruments.12 Currently, electrochemical techniques (voltammetry, potentiometry, coulometry, etc.) are receiving wide attention for the analysis of trace pollutants.12–14Potentiometric methods are classic analytical techniques that measure the electromotive force (EMF) of the cell when no significant current flows between the working and reference electrodes. By comparing with other electro-analytical techniques, this method provides information about the activity of ions or molecules in the electrochemical solution. Moreover, this technique extends to the highly sensitive and selective quantitative determination of different analytes in real samples. Aglan et al. and Mashhadizadeh et al. modified carbon paste electrode (CPE) with lanthanum tungstate ion exchanger and mercapto-gold nanoparticles, respectively, for the determination of cadmium ions in different real samples using a potentiometric technique.15,16 The modified sensors exhibited high stability and short response times for cadmium detection. However, the lack of selectivity of the sensors was the major problem faced by authors during the electrochemical determination.
On the other hand, voltammetry belongs to the main category of electro-analytical techniques in which the current is directly or inversely proportional to the concentration of the target analyte based on the variation of the potential.12 Due to the high sensitivity and excellent selectivity of the voltammetric method, it has been widely used for the determination of organic and/or inorganic species.17,18 Cyclic voltammetry (CV), differential pulse voltammetry (DPV), square wave voltammetry (SWV) and anodic stripping voltammetry (ASV) are additional voltammetric techniques for the determination of different target analytes. The ASV method is one of the most popular voltammetric techniques for recognition and detection of up to thirty different elements.15,17–20 Due to the capability of ASV to concentrate the metal analyte over the working electrode surface at a high negative potential before the electrochemical determination, it is used for quantification of low concentration levels of analytes. After the preconcentration step, dissolution of the deposited metals is achieved by sweeping the potential in the anodic direction. Despite the high sensitivity of this technique, it still suffers from the deficiency of selectivity. Therefore, an ion imprinting polymer (IIP) is used to enhance the selectivity of the working electrode.12 The ion imprinting technique is a versatile approach for synthesizing a polymer matrix with a high affinity for a template ion that is chosen depending on the polymerization process.17,18 The IIP is usually fabricated by the polymerization of monomers with a cross-linker in the presence of an initiator and the template ion. Then, after leaching of target ions, imprinted cavities are formed in the polymeric matrices.21–23 Despite the great attention that has been paid to imprinted sensors, there are intrinsic difficulties in their practical application due to the sluggish direct electron transfer. Therefore, to improve the responses of these sensors, researchers have utilized different electrocatalytic nanomaterials (graphene oxide, gold nanoparticles, multi-walled carbon nanotubes, etc.).22,23 Graphene oxide (GO) is a fascinating scientific material due to its unique surface nature, which enhances its mechanical and thermal stability, electrical conductivity, and molecular barrier abilities.12
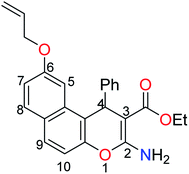
A literature survey has reported various modified working electrodes (e.g. glassy carbon electrode (GCE), carbon paste electrode (CPE), and gold electrode) for the detection of Cd(II) based on different IIPs and some nanomaterials. However, most of these electrodes are not suitable for in situ analysis due to some issues, such as storage stability and problems associated with the interference of cadmium ion analogues (Table S1, ESI†). In this respect, many researchers worldwide are paying growing attention to the design and development of stable and selective electrodes for cadmium detection in real samples by voltammetric and potentiometric techniques. In this work, ethyl 6-(allyloxy)-2-amino-4-phenyl-4H-benzo[f]chromene-3-carboxylate (EAAP) (2) is a new complexing agent and a functional monomer that was used for the preparation of a Cd(II)-imprinted polymer in the presence of azobisisobutyronitrile (AIBN, initiator) and ethylene glycol dimethacrylate (EGDMA, cross-linker). Full characterization of the ligand and the prepared IIP was performed using proton nuclear magnetic resonance (1H NMR) spectroscopy, Fourier-transform infrared (FT-IR) spectroscopy, scanning electron microscopy (SEM), electron impact mass spectroscopy (EIMS) and energy-dispersive X-ray (EDX) spectroscopy. For the electrochemical application, the GCE (electrochemical transducer) was modified with the prepared IIP in the presence of graphene oxide (GO) for voltammetric measurements. In contrast, the IIP was deposited on the surface of the GCE after embedding it in a plasticized polyvinyl chloride (PVC) membrane to form the potentiometric sensor. The effects of different factors on the proposed sensors' responses was elaborated to optimize the conditions of the electrochemical experiment. Also, the voltammetric and potentiometric sensors were successfully used to detect trace Cd(II) concentrations in different real samples.
2. Experimental section
2.1 Chemicals and reagents
All the chemicals and reagents in this work were used without further purification, and their solutions were prepared using double distilled water. Natural graphite powder (1–2 μm), dimethylformamide (DMF, 99.8%), ethanol (EtOH), cadmium chloride, glacial acetic acid, sodium acetate, 2,7-dihydroxynaphthalene, allyl bromide and EGDMA were obtained from Sigma-Aldrich. High molecular weight polyvinyl chloride (PVC) powder, nitric acid (70%), potassium ferrocyanide, potassium ferricyanide, dioctyl phthalate (DOP, 99%), dioctyl sebacate (DOS), AIBN, potassium chloride, ethylenediaminetetraacetic acid (EDTA), sodium hydroxide, calcium chloride, sodium chloride, aluminum chloride, magnesium sulphate, cobalt chloride, nickel chloride, mercuric chloride, lead nitrate, copper sulphate, potassium carbonate and zinc chloride were purchased from Merck.2.2 Instruments
The structure characterization of the EAAP ligand was performed via the 1H NMR spectra (δ, ppm) which were measured on a Bruker Avance III 400 MHz (Faculty of Pharmacy, Mansoura University) using tetramethylsilane (TMS) as an internal reference and using DMSO-d6 as a solvent. The exchangeable protons were detected through D2O testing. The multiplicities of the signals were reported as follows: s = singlet, d = doublet, dd = doublet of doublets, t = triplet, and m = multiplet. The electron impact mass spectra (EIMS) were determined on a ThermoFisher Scientific DSQ II GC/MS with focus GC (70 eV) (Faculty of Science, Mansoura University). Elemental analyses (C, H and N) were executed at the microanalytical lab at Cairo University. The synthesis of the EAAP chelating ligand was monitored using thin layer chromatography (TLC) on aluminum sheets pre-coated with Al2O3 with fluorescent indicator F254 (Merck, Darmstadt, Germany). The spots were detected by exposure to a UV lamp at λ = 254 nm. Moreover, the FT-IR spectra (IR) (ν, cm−1) of the synthesized EAAP ligand and the formed polymers were obtained in the range of 400–4000 cm−1 using the pressed KBr pellet method on a Mattson 5000 FT-IR spectrophotometer (Faculty of Pharmacy, Mansoura University) and Thermo Fisher Nicolet IS10, USA (Spectral Analytical Unit, Faculty of Science, Mansoura University). In addition, the morphological surfaces and elemental analyses of the polymers were investigated by scanning electron microscopy (QUANTA FEI 450, Netherlands) and energy-dispersive X-ray spectroscopy (X-Max), respectively. For the potentiometric measurements, the modified GCE (working electrode, 3 mm diameter) was connected on a digital pH/mV meter (4120300 JP Selecta, Spain/EU) with a standard calomel electrode (reference electrode) at ambient temperature to form the following cell (calomel electrode | solution | modified GCE). Moreover, the hydrogen ion concentration of the prepared solutions was adjusted by the same pH/mV meter. On the other hand, the Ag/AgCl electrode (reference electrode) was dipped in different solutions with the modified GCE (working electrode) and platinum electrode (auxiliary electrode) to determine the different electrochemical measurements (e.g., electrochemical impedance spectrophotometry (EIS), (CV), (ASV),…etc.) by a digital potentiostat (Gamary, Interface 5000E/potentiostat/galvanostat/ZRA).2.3 Preparation of the EAAP chelating ligand
![[double bond, length as m-dash]](https://www.rsc.org/images/entities/char_e001.gif) O), 1625 (C
O), 1625 (C![[double bond, length as m-dash]](https://www.rsc.org/images/entities/char_e001.gif) C), 1213 (C–O) (Fig. S1, ESI†); 1H-NMR (400.20 MHz, DMSO-d6): δ (ppm) = 1.27 (t, 3H, J = 8 Hz, –CH2CH3), 4.09 (m, 2H, –CH2CH3), 5.29 (s, 1H, H-4), 7.62 (br, 2H, NH2), 6.95–7.77 (m, 10H, ArH), 9.88 (s, 1H, OH) (Fig. S2, ESI†); (EIMS) m/z (%): 361.1 [M+] (11.8), 313.1 (1.9), 288.0 (13.8), 285.2 (19.3), 284.0 [M+–Ph] (100.0), 256.0 (11.6), 238.0 (42.7) (Fig. S3, ESI†); anal. calcd for C22H19NO4 (361.13): C, 73.12; H, 5.30; N, 3.88%. Found: C, 73.29; H, 5.42; N, 3.95%.
C), 1213 (C–O) (Fig. S1, ESI†); 1H-NMR (400.20 MHz, DMSO-d6): δ (ppm) = 1.27 (t, 3H, J = 8 Hz, –CH2CH3), 4.09 (m, 2H, –CH2CH3), 5.29 (s, 1H, H-4), 7.62 (br, 2H, NH2), 6.95–7.77 (m, 10H, ArH), 9.88 (s, 1H, OH) (Fig. S2, ESI†); (EIMS) m/z (%): 361.1 [M+] (11.8), 313.1 (1.9), 288.0 (13.8), 285.2 (19.3), 284.0 [M+–Ph] (100.0), 256.0 (11.6), 238.0 (42.7) (Fig. S3, ESI†); anal. calcd for C22H19NO4 (361.13): C, 73.12; H, 5.30; N, 3.88%. Found: C, 73.29; H, 5.42; N, 3.95%.![[double bond, length as m-dash]](https://www.rsc.org/images/entities/char_e001.gif) O), 1628 (C
O), 1628 (C![[double bond, length as m-dash]](https://www.rsc.org/images/entities/char_e001.gif) C) (Fig. S4, ESI†); 1H-NMR (400.20 MHz, DMSO-d6): δ (ppm) = 1.25 (t, 3H, J = 8 Hz, –CH2C
C) (Fig. S4, ESI†); 1H-NMR (400.20 MHz, DMSO-d6): δ (ppm) = 1.25 (t, 3H, J = 8 Hz, –CH2C![[H with combining low line]](https://www.rsc.org/images/entities/char_0048_0332.gif) 3), 4.10 (m, 2H, –C
3), 4.10 (m, 2H, –C![[H with combining low line]](https://www.rsc.org/images/entities/char_0048_0332.gif) 2CH3), 4.55 (dd, 1H, J = 4, 12 Hz, CH2
2CH3), 4.55 (dd, 1H, J = 4, 12 Hz, CH2![[double bond, length as m-dash]](https://www.rsc.org/images/entities/char_e001.gif) CHC
CHC![[H with combining low line]](https://www.rsc.org/images/entities/char_0048_0332.gif) 2a–), 4.73 (dd, 1H, J = 4, 12 Hz, CH2
2a–), 4.73 (dd, 1H, J = 4, 12 Hz, CH2![[double bond, length as m-dash]](https://www.rsc.org/images/entities/char_e001.gif) CHC
CHC![[H with combining low line]](https://www.rsc.org/images/entities/char_0048_0332.gif) 2b–), 5.30 (d, 1H, J = 8 Hz, C
2b–), 5.30 (d, 1H, J = 8 Hz, C![[H with combining low line]](https://www.rsc.org/images/entities/char_0048_0332.gif) 2a
2a![[double bond, length as m-dash]](https://www.rsc.org/images/entities/char_e001.gif) CHCH2–), 5.38 (s, 1H, H-4), 5.44 (d, 1H, J = 16 Hz, C
CHCH2–), 5.38 (s, 1H, H-4), 5.44 (d, 1H, J = 16 Hz, C![[H with combining low line]](https://www.rsc.org/images/entities/char_0048_0332.gif) 2b
2b![[double bond, length as m-dash]](https://www.rsc.org/images/entities/char_e001.gif) CHCH2–), 6.08 (m, 1H, CH2
CHCH2–), 6.08 (m, 1H, CH2![[double bond, length as m-dash]](https://www.rsc.org/images/entities/char_e001.gif) C
C![[H with combining low line]](https://www.rsc.org/images/entities/char_0048_0332.gif) CH2–), 7.05–7.84 (m, 10H, ArH), 7.65 (s, 2H, NH2) (Fig. S5, ESI†); anal. calcd for C25H23NO4 (401.16): C, 74.80; H, 5.77; N, 3.49%. Found: C, 74.91; H, 5.87; N, 3.60%.
CH2–), 7.05–7.84 (m, 10H, ArH), 7.65 (s, 2H, NH2) (Fig. S5, ESI†); anal. calcd for C25H23NO4 (401.16): C, 74.80; H, 5.77; N, 3.49%. Found: C, 74.91; H, 5.87; N, 3.60%.2.4 Preparation of host-tailored polymer
IIP for Cd(II) was fabricated by the thermal polymerization technique. Typically, 2 mmol of EAAP was dissolved in 25 mL aqueous ethanol (50%), then mixed with 1 mmol of Cd(II). The stirring was continued for 30 min at room temperature to induce the formation of a complex between the synthesized ligand and Cd(II). Thereafter, 3 mmol of EGDMA and 0.1 g of AIBN were added to achieve polymerization at room temperature with continuous stirring until homogenized. The mixture was deoxygenated by purging with nitrogen gas for the appropriate time and then polymerized in a water bath at 60 °C for 24 h. After the polymerization step, the cadmium ions were removed from the polymeric matrices using nitric acid (0.1 mol L−1). The complete removal of template ions was checked by UV-Vis analysis at the cadmium absorption peak, λmax = 510 nm. The imprinted polymer was washed with deionized water and left to dry at ambient temperature. In the same way, the corresponding non-imprinted polymer (NIP) was obtained by using the same protocol in the absence of the template ions. Finally, the polymeric membrane was deposited on the surface of GCE for the examination of the potentiometric and voltammetric measurements.2.5 Sensor construction and electrochemical measurements
The voltammetric sensor was prepared by depositing graphene oxide on GCE after polishing the surface with alumina slurry (0.05 μm) followed by washing with EtOH and distilled water. Then, the IIP was dropped on GO@GCE and the modified electrode was maintained for 3 h at room temperature. Thereafter, the prepared sensor (IIP/GO@GCE) was characterized by CV and EIS. Under optimized conditions, the IIP/GO@GCE was immersed in a mixture containing 0.1 mol L−1 acetate buffer and 5 × 10⁻⁵ mol L−1 Cd(II) solution for CV investigation (the potential window is from −1.5 V to 1 V, scanning rate: 100 mV s−1). Meanwhile, the EIS analysis was accomplished in the frequency range from 0.1 Hz to 100 kHz in 0.1 mol L−1 KCl solution containing 5 × 10⁻³ mol L−1 Fe(CN)63−/4− as the redox active probe. The electrochemical detection of Cd(II) was already performed by ASV under optimized conditions (scanning voltage: −1.5–0.1 V, deposition potential: −1.5 V; scan rate: 100 mV s−1; pulse amplitude: 50 mV; pulse width: 50 ms).On the other hand, the sensing membrane of the potentiometric sensor was synthesized by inserting the prepared polymer in plasticizer and embedding it in the PVC matrix. Briefly, PVC powder (30 mg) was slowly dispersed in 2.5 mL of DMF, followed by addition of IIP (ionophore, 0.01 g) and DOP plasticizer (0.5 mL) with continuous stirring until homogeneity. After polishing the surface of GCE as previously mentioned, it was inserted in the plasticized sensing mixture until it was completely covered with a thin layer, and it was then left to evaporate under air. The modified sensor (IIP/PVC@GCE, working electrode) was connected to a saturated calomel electrode (SCE, reference electrode) at the digital pH/mV meter to form the following electrochemical cell: the developed sensor | sample solution | SCE. For comparison, the non-imprinted sensor (NIP/PVC@GCE) was prepared by the same way using NIP instead of MIP. The electromotive force (EMF) of the proposed sensor was measured for different Cd(II) concentrations after potential stabilization at ±2 mV. The EMF readings were plotted versus the logarithm concentration of Cd(II) to acquire the calibration curve. It is worth mentioning that the proposed electrode was stored and conditioned in 1.0 × 10⁻³ mol L−1 Cd(II) solution at pH 4.5 before the electrochemical measurements.
2.6 Sample preparation
3. Results and discussion
3.1 Preparation and characterization of the EAAP chelating ligand
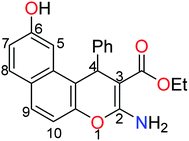
The treatment of 2,7-dihydroxynapthalene with ethyl benzylidenecyanoacetate in an equimolar ratio under basic conditions afforded the benzo[f]chromene 1 in excellent yield (88%) via a convenient and high-yielding protocol (Scheme 1).24 The enaminoester chelation side was characterized using its IR spectrum, which showed the amino group absorption bands at 3410 and 3304 cm−1 and the ester C![[double bond, length as m-dash]](https://www.rsc.org/images/entities/char_e001.gif) O stretching band at 1661 cm−1. Moreover, the 1H-NMR spectrum showed a broad singlet at δ 7.62 ppm, which is attributable to the NH2 group, while the signals at δ 1.27 and 4.09 ppm are assignable to the ester methyl and methylene groups, respectively.
O stretching band at 1661 cm−1. Moreover, the 1H-NMR spectrum showed a broad singlet at δ 7.62 ppm, which is attributable to the NH2 group, while the signals at δ 1.27 and 4.09 ppm are assignable to the ester methyl and methylene groups, respectively.
The next step involved the insertion of the allyl arm as the root of the polymerization process. The allylation step of the 6-hydroxy-4H-benzo[f]chromene 1 was accomplished via its reaction with allyl bromide in the presence of anhydrous K2CO3 to afford the EAAP ligand 1 in good yield (68%).25
3.2 DFT study of EAAP
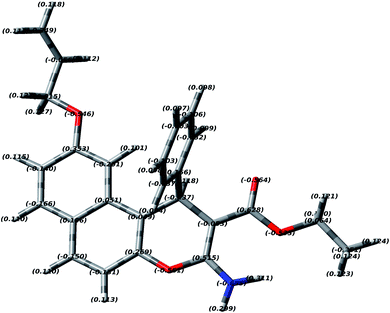
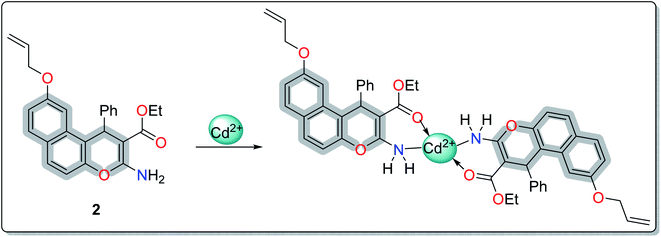
In order to study the most preferred chelation position of the EAAP ligand, the charge densities on the atoms were computationally calculated using the Gaussian 09 software package. The electron densities were measured on the most optimized structure at the DFT level via B3LYP as the energy function, 6-31G (d,p) as a basis set and ethanol as a solvent (Fig. 1).26,27It was found that the electron densities of the nitrogen atom (−0.655 e Å−3) and the ester sp2 oxygen (−0.564 e Å−3) were the highest compared with the other nucleophilic centers present in the ligand. According to this, the chelation direction (A) was excluded because the ester SP3 oxygen has lower electron density compared with the SP2 oxygen (Fig. S6, ESI†). Therefore, the chelation direction (B) is predominant, and the cadmium ions will occupy their specific holes according to Scheme 2.
3.3 Characterization of the prepared imprinted polymer
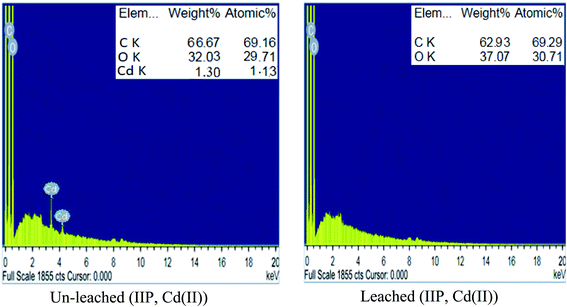
![[double bond, length as m-dash]](https://www.rsc.org/images/entities/char_e001.gif) O stretching and bending, respectively.28,29 These bands demonstrated the successful insertion of EAAP chelating ligand on the polymeric matrix during the polymerization process. Moreover, the spectrum of leached IIP was approximately analogous to that of NIP, revealing the similarity of their backbone constructions and the complete removal of Cd(II) without affecting the main structure of the polymer.
O stretching and bending, respectively.28,29 These bands demonstrated the successful insertion of EAAP chelating ligand on the polymeric matrix during the polymerization process. Moreover, the spectrum of leached IIP was approximately analogous to that of NIP, revealing the similarity of their backbone constructions and the complete removal of Cd(II) without affecting the main structure of the polymer.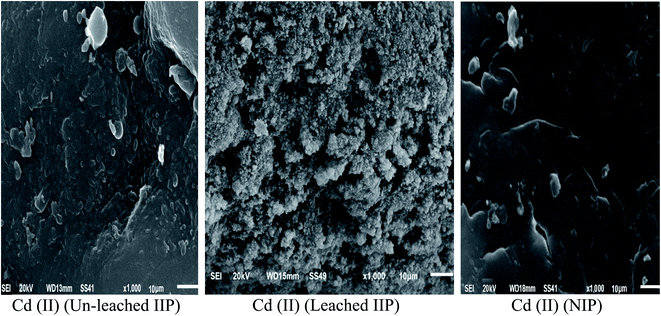 | ||
| Fig. 2 SEM images of the synthesized un-leached and leached cadmium imprinted polymer and non-imprinted polymer. | ||
3.4 Electrochemical characterization
Moreover, the reproducibility was examined by recording six measurements for Cd(II) solutions, and the relative standard deviation (RSD) was found to be 2.6%. These results indicate that the proposed sensor has excellent reproducibility. In addition, to determine the stability of this modified electrode, the potentiometric signals were recorded repeatedly for two months and compared with the primary data. There was no observable change in the potentiometric signals after eight weeks.
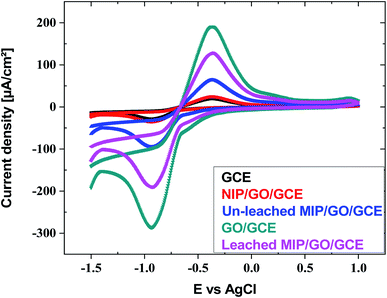 | ||
| Fig. 4 Cyclic voltammograms of GCE, GO@GCE, NIP/GO@GCE, un-leached IIP/GO@GCE and leached IIP/GO@GCE in Cd(II) solution buffered with acetate. | ||
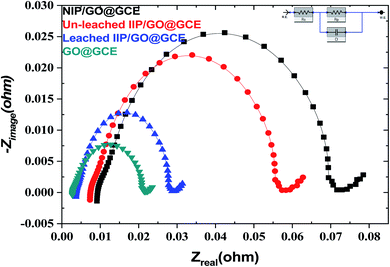
EIS is also a powerful technique, and it was used for investigation of the resistance change using the electrochemical probe (K3[Fe(CN)6]) at the modified sensor interface. The data presented in Fig. 5 show the variation in the polarization resistance (Rp) for the proposed sensors based upon the variance of the semicircle diameter. Compared with the GO@GCE, the un-leached IIP/GO@GCE and NIP/GO@GCE displayed larger circular radii, which confirmed that the proposed polymers were non-conductive materials. Meanwhile, the Rp dramatically decreased when the un-leached IIP was replaced with leached IIP; this was attributed to the formation of some channels and cavities on the IIP film, which facilitated the penetration of the probe.
3.5 Optimization of the work conditions
On the other hand, for a potentiometric sensor, a great effect on the potential responses was observed when the pH of the solution was varied (Fig. S10, ESI†). As expected, the potential was elevated regularly and reached its maximum at pH 4.5. Thus, pH 4.5 was selected as the optimum value.
![[thin space (1/6-em)]](https://www.rsc.org/images/entities/char_2009.gif) ν (Fig. S14, ESI†) and the linear regression equations can be expressed as follows:
ν (Fig. S14, ESI†) and the linear regression equations can be expressed as follows:Ep,a(mV) = 0.18 log![[thin space (1/6-em)]](https://www.rsc.org/images/entities/char_2009.gif) ν + 1.14 (R2 = 0.99) ν + 1.14 (R2 = 0.99) |
In addition, the value of the electron transfer for an oxidation–reduction reaction can be calculated using the Tafel equation, and it was equal to 2.32
On the other hand, by using the fixed interference method (FIM), the selectivity of the potentiometric sensor was checked. The selectivity coefficients (the ratio of the activity between Cd(II) (primary ion) and the interfering ion powered by their charges) were estimated by using 1.0 × 10⁻² mol L−1 of the interfering ions. The selectivity coefficients of the synthesized sensor over various, relevant ions, such as Ni(II), Co(II), Pb(II), Cu(II), Mg(II), Hg(II), Ca(II), and Zn(II), are summarized in Table 1. It is worth mentioning that the existence of a 100–150 fold excess of different inorganic cations did not interfere in the performance of IIP/PVC@GCE.
| Interferent | Cd(II) | Ni(II) | Co(II) | Pb(II) | Cu(II) | Mg(II) | Hg(II) | Ca(II) | Zn(II) |
|---|---|---|---|---|---|---|---|---|---|
log![[thin space (1/6-em)]](https://www.rsc.org/images/entities/char_2009.gif) KCd(II),i IIP/PVC@GCE KCd(II),i IIP/PVC@GCE |
— | −2.6 | −1.9 | −0.9 | −1.8 | −2.9 | −1.3 | −2.8 | −1.7 |
Furthermore, in the comparison with NIP/PVC@GCE, the proposed imprinted sensor showed excellent selectivity toward Cd(II) compared to the interfering ions (Table S2, ESI†). These results can be attributed to the selective attraction of Cd(II) ion to its specific holes in the surface of the imprinted polymer.
It is worth mentioning that at more negative potential, the reduction of hydrogen becomes a significant issue due to formation of hydrogen bubbles at the modified GCE surface. According to the aforementioned, the reduced stripping signals may affect the selectivity of the proposed electrode. Moreover, in order to enhance the sensitivity of modified GCE, the deposition time was tested in the range from 20 to 100 s (Fig. S17, ESI†). It was observed that increasing the deposition time enabled more cadmium atoms to be deposited at the modified GCE surface. However, the current signals became almost constant after 60 s, which can be attributed to saturation of GCE surface by the cadmium metal.
Furthermore, for comparison, ASV was investigated for Cd(II) by using bare GCE, GO@GCO, NIP/GO@GCE, and leached and un-leached IIP/GO/GCE. As exhibited in Fig. S18 (ESI†), the peak current intensity of GO@GCE is higher than that of the other corresponding sensors due to the high conductivity and the large surface area of the GO. In contrast, the non-imprinted sensor (NIP/GO/GCE) and the un-leached IIP/GO@GCE sensor displayed lower responses toward cadmium ions. Meanwhile, in leached IIP/GO@GCE, the current intensity elevated rapidly; this contributed to the formation of some channels on the imprinted film, which facilitated the penetration of the cadmium template from the bulk to the GCE surface.
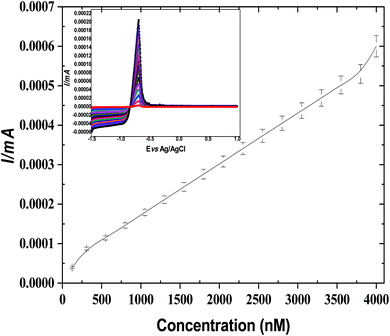
| I = 0.6C (mol L−1) + 2.4 × 10⁻³ (R2 = 0.99) |
Based on the calculation results, the limit of detection and limit of quantification of the voltammetric sensor can reach 7 × 10⁻¹⁴ mol L−1 and 2.33 × 10⁻¹³ mol L−1, respectively. In contrast, the electrochemical signals of the potentiometric sensor were directly proportional to the Cd(II) concentration in the range from 7.3 × 10⁻⁸ mol L−1 to 2.4 × 10⁻³ mol L−1, with a lower detection limit of 6.3 × 10⁻¹⁰ mol L−1.
The stability and reproducibility are also crucial parameters for the assessment of the proposed sensors. To evaluate the reproducibility, the voltammetric electrode at different concentrations of Cd(II) ions was examined by the ASV technique in the presence of acetate buffer (pH 4.5). Well-shaped voltammograms were acquired for the experiments: the relative standard deviation (RSD) for the slopes was 2.4%. Moreover, the peak signal of the cadmium voltammetric sensor was reduced to 89% of the original value after 30 days. Moreover, the performance criteria of the fabricated sensor (IIP/GO@GCE) were compared with those of other electrochemical methods for cadmium determination by voltammetric techniques, and the corresponding results are summarized in Table S1 (ESI†). Compared with the potentiometric sensor, a high linear concentration range, excellent stability and a low detection limit were noted for IIP/GO@GCE; all of these characteristics make it a great promising sensor in the electro-analysis of Cd(II).
| Sample | Cd(II) added (μM) | Cd(II) founded by voltammetric sensora (μg) | Recovery% | Cd(II) founded by potentiometrica (μg) | Recovery% | F-test | t-test |
|---|---|---|---|---|---|---|---|
| a Mean values with RSD. | |||||||
| Person 1 | 0 | 1.7 ± 0.11 | — | 1.76 ± 0.13 | — | 1.39 | 1.2 |
| 5 | 6.6 ± 0.09 | 98.5 | 6.58 ± 0.12 | 99.6 | 1.77 | 1.6 | |
| 10 | 11.72 ± 0.2 | 100.1 | 11.69 ± 0.22 | 99.4 | 1.21 | 1.54 | |
| Person 2 | 0 | 1.53 ± 0.13 | — | 1.52 ± 0.1 | — | 1.69 | 0.8 |
| 5 | 6.5 ± 0.16 | 99.5 | 6.43 ± 0.2 | 98.6 | 1.56 | 1.2 | |
| 10 | 11.55 ± 0.18 | 100.17 | 11.5 ± 0.23 | 99.8 | 1.6 | 1.3 | |
| Person 3 | 0 | 1.5 ± 0.05 | — | 1.6 ± 0.07 | — | 1.96 | 0.7 |
| 5 | 6.45 ± 0.11 | 99.2 | 6.49 ± 0.14 | 98.3 | 1.6 | 1.4 | |
| 10 | 11.48 ± 0.2 | 99.8 | 11.45 ± 0.25 | 98.7 | 1.56 | 1.5 | |
| Person 4 | 0 | 1.81 ± 0.06 | — | 1.79 ± 0.09 | — | 2.25 | — |
| 5 | 6.8 ± 0.1 | 99.8 | 6.9 ± 0.11 | 101 | 1.21 | 1.3 | |
| 10 | 11.79 ± 0.17 | 99.8 | 11.8 ± 0.23 | 100 | 1.8 | 1.2 | |
| Person 5 | 0 | 1.4 ± 0.1 | — | 1.46 ± 0.1 | — | 1 | 0.9 |
| 5 | 6.4 ± 0.12 | 100 | 6.42 ± 0.15 | 99.3 | 1.56 | 1.2 | |
| 10 | 11.35 ± 0.16 | 99.5 | 11.39 ± 0.19 | 99.4 | 1.4 | 1.4 | |
| Human hair 1 | 0 | 2.6 ± 0.18 | — | 2.71 ± 0.2 | — | 1.23 | 1.8 |
| 5 | 7.5 ± 0.15 | 98.6 | 7.6 ± 0.18 | 98.5 | 1.44 | 1.1 | |
| 10 | 12.62 ± 0.2 | 100.15 | 12.65 ± 0.21 | 99.5 | 1.1 | 1.6 | |
| Human hair 2 | 0 | 2.59 ± 0.13 | — | 2.61 ± 0.1 | — | 1.69 | 1.8 |
| 5 | 7.6 ± 0.18 | 100.13 | 7.6 ± 0.14 | 99.8 | 1.65 | 1.5 | |
| 10 | 12.55 ± 0.3 | 99.6 | 12.57 ± 0.23 | 99.7 | 1.7 | 1.9 | |
| Human hair 3 | 0 | 2.9 ± 0.1 | — | 3.1 ± 0.14 | — | 1.96 | 0.7 |
| 5 | 7.86 ± 0.24 | 99.4 | 8 ± 0.19 | 98.7 | 1.59 | 1.5 | |
| 10 | 13 ± 0.19 | 100.7 | 12.9 ± 0.26 | 98.4 | 1.87 | 1.6 | |
| Human hair 4 | 0 | 3.4 ± 0.16 | — | 3.51 ± 0.12 | — | 1.77 | 0.9 |
| 5 | 8.41 ± 0.22 | 100.1 | 8.48 ± 0.21 | 99.6 | 1.09 | 1.1 | |
| 10 | 13.38 ± 0.19 | 99.8 | 13.46 ± 0.23 | 99.6 | 1.46 | 1.6 | |
| Human hair 5 | 0 | 3.2 ± 0.07 | — | 3.1 ± 0.1 | — | 2.04 | 1.3 |
| 5 | 8.1 ± 0.13 | 98.7 | 7.9 ± 0.16 | 97.5 | 1.5 | 0.8 | |
| 10 | 13.3 ± 0.23 | 100.7 | 13 ± 0.24 | 99.2 | 1.08 | 1.1 | |
4. Conclusions
In summary, highly selective and sensitive electrochemical sensors were used for the recognition of cadmium ions in different biological samples based on a promising enaminoester ligand. The voltammetric sensor was fabricated based on modification of GCE with GO and IIP. In contrast, polyvinyl chloride and the prepared polymer were utilized to perform the potentiometric sensing. Compared with IIP/PVC@GCE, a high linear concentration range (4.2 × 10⁻¹²–5.6 × 10⁻³ mol L−1), low detection limit (7 × 10⁻¹⁴ mol L−1), good reproducibility (2.4%), and excellent stability (30 days) were observed for IIP/GO@GCE. In addition, the proposed sensors displayed good recognition capacity for cadmium ions over other structurally similar ions. Furthermore, both sensors were successfully applied for trace Cd(II) detection in real samples with acceptable recoveries (98.3–101%). Due to the abovementioned merits, our developed sensors are expected to be promising for electrochemical applications.Ethical statement
All experiments were performed in accordance with the ethical rules approved by the ethics committee at the Faculty of Science, Mansoura University. The institution approval code is SCI-Ch-P-2021-126. In addition, informed consent was obtained from the human participants of this study.Conflicts of interest
There are no conflicts to declare.Acknowledgements
The authors are grateful for the Mansoura University Sustainable Energy Research lab (MSER) which supported by the Science, Technology & Innovation Funding Authority (STDF).References
- Y. Li, Y.-s. Huang, B. He, R. Liu, G. Qu, Y. Yin, J. Shi, L. Hu and G. Jiang, Ecotoxicol. Environ. Saf., 2020, 188, 109896 CrossRef CAS PubMed
.
- S. M. Prabu, K. Shagirtha and J. Renugadevi, J. Food Sci., 2010, 75, T132–T140 CrossRef CAS PubMed
.
- S. Satarug, J. R. Baker, S. Urbenjapol, M. Haswell-Elkins, P. E. Reilly, D. J. Williams and M. R. Moore, Toxicol. Lett., 2003, 137, 65–83 CrossRef CAS PubMed
.
- C. A. Rusinek, A. Bange, I. Papautsky and W. R. Heineman, Anal. Chem., 2015, 87, 6133–6140 CrossRef CAS PubMed
.
- M. Ebrahimi, N. Khalili, S. Razi, M. Keshavarz-Fathi, N. Khalili and N. Rezaei, J. Environ. Health Sci. Eng., 2020, 18, 335–343 CrossRef CAS PubMed
.
- G. Genchi, M. S. Sinicropi, G. Lauria, A. Carocci and A. Catalano, Int. J. Environ. Res. Public Health, 2020, 17, 3782 CrossRef CAS PubMed
.
- C. Liu, Y. Zhu, Z. Lu, W. Guo, B. Tumen, Y. He, C. Chen, S. Hu, K. Xu and Y. Wang, Int. J. Environ. Res. Public Health, 2020, 17, 138 CrossRef CAS PubMed
.
- V. Zarezade, M. Behbahani, F. Omidi, H. S. Abandansari and G. Hesam, RSC Adv., 2016, 6, 103499–103507 RSC
.
- S. Himeno, E. Kitano and K. Morishita, Anal. Sci., 2007, 23, 959–962 CrossRef CAS PubMed
.
- J. Jiang, Z. Li, Y. Wang, X. Zhang, K. Yu, H. Zhang, J. Zhang, J. Gao, X. Liu and H. Zhang, Food Chem., 2020, 310, 125824 CrossRef CAS PubMed
.
- R. Sun, G. Ma, X. Duan and J. Sun, Spectrochim. Acta, Part B, 2018, 141, 22–27 CrossRef CAS
.
- M. E. Khalifa and A. Abdallah, Biosens. Bioelectron.: X, 2019, 2, 100027 CAS
.
- T. Alizadeh, F. Atashi and M. R. Ganjali, Talanta, 2019, 194, 415–421 CrossRef CAS PubMed
.
- A. Abdallah, A. El-Shafei and M. E. Khalifa, Arabian J. Sci. Eng., 2021, 1–11 Search PubMed
.
- R. F. Aglan, M. M. Hamed and H. M. Saleh, J. Anal. Sci. Technol., 2019, 10, 1–11 CrossRef
.
- M. H. Mashhadizadeh, K. Eskandari, A. Foroumadi and A. Shafiee, Electroanalysis, 2008, 20, 1891–1896 CrossRef CAS
.
- T. Alizadeh, M. R. Ganjali, P. Nourozi, M. Zare and M. Hoseini, J. Electroanal. Chem., 2011, 657, 98–106 CrossRef CAS
.
- J. Wang, J. Hu, S. Hu, G. Gao and Y. Song, Sensors, 2020, 20, 1004 CrossRef CAS PubMed
.
- S. Hu, G. Gao, Y. Liu, J. Hu, Y. Song and X. Zou, Int. J. Electrochem. Sci., 2019, 14, 11714–11730 CrossRef CAS
.
- S. D. Masi, A. Pennetta and C. Malitesta, Proceedings, 2020, 60, 39 CrossRef
.
- S. Rais, A. Islam, I. Ahmad, S. Kumar, A. Chauhan and H. Javed, Food Chem., 2021, 334, 127563 CrossRef CAS PubMed
.
- T. K. Biswas, M. M. Yusoff, M. S. Sarjadi, S. E. Arshad, B. Musta and M. L. Rahman, Sep. Sci. Technol., 2021, 56, 671–680 CrossRef CAS
.
- M. Shamsipur, L. Samandari, L. Farzin and A. Besharati-Seidani, Microchem. J., 2021, 160, 105714 CrossRef CAS
.
- H. Radwan, H. El-Mawgoud, F. El-Mariah, A. El-Agrody, A. Amr, M. Al-Omar and H. Ghabbour, Russ. J. Gen. Chem., 2020, 90, 299–304 CrossRef CAS
.
- M. A. Abozeid, M. R. El-Kholany, A.-R. H. Abdel-Rahman and E.-S. I. El-Desoky, Int. J. Mod. Org. Chem., 2018, 5, 1–11 CAS
.
- M. Frisch, G. Trucks, H. Schlegel, G. Scuseria, M. Robb, J. Cheeseman, G. Scalmani, V. Barone, B. Mennucci and G. Petersson, Gaussian 09, Revision D.01, Gaussian, Inc., Wallingford, CT, 2009 Search PubMed
.
- N. Godbout, D. R. Salahub, J. Andzelm and E. Wimmer, Can. J. Chem., 1992, 70, 560–571 CrossRef CAS
.
- Y. Wang, E. Wang, Z. Wu, H. Li, Z. Zhu, X. Zhu and Y. Dong, Carbohydr. Polym., 2014, 101, 517–523 CrossRef CAS PubMed
.
- E. Pretsch, P. Bühlmann, C. Affolter, E. Pretsch, P. Bhuhlmann and C. Affolter, Structure determination of organic compounds, Springer, 2000 Search PubMed
.
- M. E. Khalifa, I. M. Kenawy, Y. Abou El-Reash and A. Abdallah, J. Environ. Chem. Eng., 2017, 5, 3447–3454 CrossRef CAS
.
- H. da Silva, J. G. Pacheco, J. M. Magalhães, S. Viswanathan and C. Delerue-Matos, Biosens. Bioelectron., 2014, 52, 56–61 CrossRef CAS PubMed
.
- Y. Wang, L. Wang, H. Chen, X. Hu and S. Ma, ACS Appl. Mater. Interfaces, 2016, 8, 18173–18181 CrossRef CAS PubMed
.
- B. Deiminiat, G. H. Rounaghi and M. H. Arbab-Zavar, Sens. Actuators, B, 2017, 238, 651–659 CrossRef CAS
.
Footnote |
| † Electronic supplementary information (ESI) available. See DOI: 10.1039/d1ra05489a |
| This journal is © The Royal Society of Chemistry 2021 |

