 Open Access Article
Creative Commons Attribution 3.0 Unported Licence
Oxidative coupling of bio-alcohols mixture over hierarchically porous perovskite catalysts for sustainable acrolein production
Al-Shaimaa M. Essehaity a,
Dalia R. Abd ElHafiza,
Delvin Aman
 *ab,
Sara Mikhaila and
Yasser K. Abdel-Monem
 c
c
aCatalysis Laboratory, Refining Department, Egyptian Petroleum Research Institute (EPRI), Nasr City, 11727, Cairo, Egypt. E-mail: delvin.aman@epri.sci
bEPRI-Nanotechnology Center, Egyptian Petroleum Research Institute (EPRI), Nasr City, 11727, Cairo, Egypt
cDepartment of Chemistry, Faculty of Science, Menoufia University, 32511, Shebin El-Kom, Menoufia, Egypt
First published on 31st August 2021
Abstract
The acrolein production from bio-alcohols methanol and ethanol mixtures using AMnO3 (since A = Ba and/or Sr) perovskite catalysts was studied. All the prepared samples were characterized by XRD, XPS, N2 sorption, FTIR, Raman spectroscopy, TEM, SEM, TGA, and NH3–CO2-TPD. The catalytic oxidation reaction to produce acrolein has occurred via two steps, the alcohols are firstly oxidized to corresponding aldehydes, and then the aldol is coupled with the produced aldehydes. The prepared perovskite samples were modified by doping A (Sr) position with (Ba) to improve the aldol condensation. The most catalytic performance was achieved using the BaSrMnO3 sample in which the acrolein selectivity reached 62% (T = 300 °C, MetOH/EtOH = 1, LHSV = 10 h−1). The increase in acrolein production may be related to the high tendency of BaSrMnO3 toward C–C coupling formation. The C–C tendency attributes to that modification have occurred in acid/base sites because of metal substitution.
1. Introduction
Acrolein (CH2![[double bond, length as m-dash]](https://www.rsc.org/images/entities/char_e001.gif) CHCHO) is a significant chemical intermediate with high reactivity due to a combination of vinyl and carbonyl groups.1 Acrolein is used in many syntheses for high-value industrial products, including acrylic resins, super absorbing polymers, detergents, as well as for feed applications such as methionine and biocides, and so forth.2 The first commercial method for acrolein production was an aldol condensation of acetaldehyde and formaldehyde. In the 1940s, Shell developed this method using copper oxide loaded on silicon carbide as a catalyst. The industrial synthesis of acrolein is primarily carried out through propylene oxidation over bismuth, iron, molybdate, Ni and/or Co and K, including many additives Sb, B, W, or P as multi-metals mixture catalysts to improve the activity and selectivity of the prepared catalysts. Using these catalysts to achieve ca. 99% propylene conversion and high selectivity toward the desired product, acrolein reaches up to 80–90%.3 So an efficient process for the production of acrolein from renewable resources is most necessary. Accordingly, an alternative to acrolein production using a methanol/ethanol mixture as a feedstock reactant has been investigated via oxidative alcoholic coupling.4 These feedstocks can be obtained from renewable resources at low prices. Ethanol is already being fermented using three primary sources: agriculture, forestry, and industrial byproducts, while methanol from waste gasification via syngas conversion.5
CHCHO) is a significant chemical intermediate with high reactivity due to a combination of vinyl and carbonyl groups.1 Acrolein is used in many syntheses for high-value industrial products, including acrylic resins, super absorbing polymers, detergents, as well as for feed applications such as methionine and biocides, and so forth.2 The first commercial method for acrolein production was an aldol condensation of acetaldehyde and formaldehyde. In the 1940s, Shell developed this method using copper oxide loaded on silicon carbide as a catalyst. The industrial synthesis of acrolein is primarily carried out through propylene oxidation over bismuth, iron, molybdate, Ni and/or Co and K, including many additives Sb, B, W, or P as multi-metals mixture catalysts to improve the activity and selectivity of the prepared catalysts. Using these catalysts to achieve ca. 99% propylene conversion and high selectivity toward the desired product, acrolein reaches up to 80–90%.3 So an efficient process for the production of acrolein from renewable resources is most necessary. Accordingly, an alternative to acrolein production using a methanol/ethanol mixture as a feedstock reactant has been investigated via oxidative alcoholic coupling.4 These feedstocks can be obtained from renewable resources at low prices. Ethanol is already being fermented using three primary sources: agriculture, forestry, and industrial byproducts, while methanol from waste gasification via syngas conversion.5
In the oxidative alcoholic coupling, the reaction can be carried out in two steps as defined (eqn (1) and (2)), including partially alcohol oxidation followed by aldol condensation to acrolein.1,6 The reactions preferably occur in one reactor (allowing energy saving) in which all reactions occur simultaneously.
| CH3OH + C2H5OH + O2 → HCHO + CH3CHO + 2H2O | (1) |
HCHO + CH3CHO → CH2![[double bond, length as m-dash]](https://www.rsc.org/images/entities/char_e001.gif) CHCHO + H2O CHCHO + H2O
| (2) |
Numerous catalysts have been reviewed for the gas-phase aldolization of acetaldehyde and formaldehyde in an O2-free environment: mixed oxides,4 hydrotalcite,7 zeolites,8 clays,9 silica, and alumina.10 The aldolization reaction is favored by cooperation between the acidic and basic sites (amphoteric catalysts). Therefore, it is essential that balance acidic and basic properties. Lilić et al.1 deliberated the influence of acid/base properties of numerous catalysts on the cross-aldolization of acetaldehyde and formaldehyde from a mixture of methanol and ethanol. The authors proposed that the coexistence of basic and acidic sites appears to be the optimal surface configuration for maximizing acrolein production.
Perovskites are complex mixed metallic oxides with the general formula of ABO3, which have exceptional diversity of physical and chemical properties. These perovskite compounds are ceramic materials with a hexagonal structure and have a space group of P63/mmc with a shared oxygen polyhedron at room temperature. Their structures can expose to tilting of the oxygen octahedrons, which causes a slight distortion of cubic perovskite structures.11 The defects or even spatial distortion in perovskite structure will be established when A and B elements are doped or substituted with others to form the flexible various structure oxides with the formula of  (ref. 12) with often oxygen vacancy (γ). The oxygen vacancy formed and improved electronic conductivity because the doping in the A site, while the doping occurs at the B site, can promote catalytic activity.13 However, a great potential proposed that the oxygen vacancies in the perovskite oxide structures play a prominent role in catalytic reactions since oxygen vacancies are preferential sites for O2 adsorption.
From this point of view, perovskites showed significant air pollution abatement via the pollutant catalytic oxidation reaction. Recently, a hexagonal structure SrMnO3 and SrMnBO3 (B–Co, Cu) nano perovskite as a catalyst exhibiting high catalytic activity towards soot oxidation, which explained from XPS results (O 1s peak), SrMnCoO3, the highest active catalyst up to ∼ 64% because of having the highest mobility of adsorbed oxygen species.14
To the best of our knowledge, the only two publications exhibit applications of perovskite as a catalyst for aldol reactions were reported by Torres-Martínez et al.,15 who using alkali tantalates (ATaO3, with A = Li, Na, and K) for catalytic aldol condensation of acetone at the gas phase by, and Kleineberg et al.16 who exhibit the material series A = Ca, Sr and Ba, and B = Ti, Zr, and Ce as a catalyst towards aldol addition of isobutyraldehyde to formaldehyde.
Herein, we present the potential of perovskite as a catalyst towards acrolein production through the simultaneously oxidative coupling of renewable alcohols (ethanol & methanol) followed by aldol condensation of pre-formed aldehydes. The examined perovskites are AMnO3, where A = Ba or/and Sr are prepared hydrothermally. The prepared perovskite samples were physically and chemically characterized. Their catalytic activity was tested in a fixed bed reactor in the gas phase.
2. Experimental
2.1. Materials used
The materials used are manganese(II) nitrate tetrahydrate (Mn(NO3)2·4H2O, 99.99%, Sigma Aldrich), barium(II) chloride dihydrate (BaCl2·2H2O, 99%, Loba Chemie), potassium permanganate (KMnO4, 99%, Sigma Aldrich), strontium(II) nitrate (Sr(NO3)2, 99.99%, Sigma Aldrich) and potassium hydroxide (KOH, 85%, Loba Chemie).2.2. Catalyst preparation
The BaMnO3 (BMO), SrMnO3 (SMO), and BaSrMnO3 (BSMO) nanoparticles perovskites were prepared by hydrothermal synthesis. Mn(NO3)2·4H2O and BaCl2·2H2O and Sr(NO3)2 were used as precursor materials; KMnO4 was used as an oxidizer, while KOH served as a mineralizer. Those precursor materials were dissolved in deionized water, and KOH was added while stirring to adjust the alkalinity of the solution.The initial molar ratios of the input species were 0.05 KMnO4: 0.05 Mn(NO3)2: 0.1 (BaCl2 or Sr(NO3)2): 0.035 KOH for preparing BaMnO3 (BMO) or SrMnO3(SMO). While for Ba0.5Sr0.5MnO3 (BSMO), the initial molar ratios of the input species were 0.05 KMnO4: 0.05 Mn(NO3)2: (0.05 BaCl2 and 0.05 Sr(NO3)2): 0.035 KOH. The preparation reaction was done mainly in a Teflon vessel. The Teflon vessel was filled to 80% of its volume, and then this vessel was placed in the stainless-steel container (autoclave). The crystallization reaction occurred at 270 °C for 30 hours; after the preparation, the autoclave was cooled in air and depressurized. The solid products were washed with deionized water and dried in an oven at 100 °C overnight. A nano perovskite powder was finally obtained.
2.3. Catalyst characterization
The crystallographic structure and chemical composition of the prepared perovskites were investigated using X-ray powder diffraction (XRD) carried out on Shimadzu XD-1 diffractometer in 2θ range between 20 and 80° with Cu Kα radiation (λ = 1.54056 Å). By employing the well-known Scherrer relation (eqn (3)), the average crystallite size of perovskite samples can be calculated.
 | (3) |
The morphology of the samples was characterized by high-resolution transmission electron microscopy (HR-TEM) spectroscopy. The TEM images were obtained on a JEOL 2100F operating at 200 kV. The prepared samples were suspended in ethanol for about 30 min under ultrasonic treatment, then depositing on carbon-film-coated copper grids. N2 adsorption–desorption isotherms and pore size distribution were derived from the low-temperature nitrogen (−196 °C) on a gas sorption analyzer Quantachrome NOVA2000, USA. The samples were evacuated at 350 °C for 24 h before nitrogen adsorption. The coke content of the used catalysts was determined using thermal gravimetric analysis (TGA) on SDTQ-600 (TA-USA) Thermo Balance instrument. The infrared absorption spectra are presented (at 25 °C) for characterizing the functional groups in the frequency range from 400–4000 cm−1 with a resolution of 4 cm−1 on the (Bruker Tensor-27, Germany). SEM analysis was performed on Carl Zeiss (Germany) to understand the surface morphological properties of the samples, and also, atomic elemental compositions (%) were estimated from EDS analysis. X-ray photoelectron spectroscopy (XPS) analysis was undertaken by Al-Kα micro-focused monochromator XPS spectrometer.
The structure of the prepared perovskite samples can be tuned in numerous substitutes by other cations. However, perovskites stability is determined by the Goldschmidt tolerance factor17 (eqn (4)).
 | (4) |
2.4. Catalytic activity
The catalytic activity of the prepared perovskite samples was carried out in a continuous flow system comprising a quartz tubular reactor operating under atmospheric pressure on using 0.2 g of the prepared sample, which was diluted with 0.2 g of silicon carbide. A methanol/ethanol mixture (1![[thin space (1/6-em)]](https://www.rsc.org/images/entities/char_2009.gif) :
:![[thin space (1/6-em)]](https://www.rsc.org/images/entities/char_2009.gif) 1) was fed into the reactor by a dosing pump with a flow rate of 2 ml per hour using nitrogen as carrier gas (45 cm3(NTP) per min). The reaction temperature was varied between 150 and 300 °C. The products such as acrolein, formaldehyde, acetaldehyde were analyzed using off-line flame ionization detection (FID) gas chromatography.
1) was fed into the reactor by a dosing pump with a flow rate of 2 ml per hour using nitrogen as carrier gas (45 cm3(NTP) per min). The reaction temperature was varied between 150 and 300 °C. The products such as acrolein, formaldehyde, acetaldehyde were analyzed using off-line flame ionization detection (FID) gas chromatography.
3. Results and discussion
3.1. Structural analysis
The XRD pattern for the prepared samples BaMnO3, SrMnO3, and Ba0.5Sr0.5MnO3 (Fig. 1) shows represent well-determine sharp peaks, which means that the prepared samples are crystalline in agreement with JCPDS standard data file no. 0260168,18 while SrMnO3 and Ba0.5Sr0.5MnO3 structure indexed to JCPDS standard data file no. 010841612.19 The diffraction patterns of Ba0.5Sr0.5MnO3 displays the light enlargement of the prominent peaks, and the main peak position 2θ (∼32.8°) progressively shift to lower 2θ values (∼32.4°), which confirmed the replacement of Sr2+ with Ba2+.19 The intensity peaks in the Ba0.5Sr0.5MnO3 sample illustrate mixed phases, i.e., not totally in the hexagonal structure. Other distorted forms (orthorhombic, octahedral, tetragonal) may be possible in this case. Such structural variations are expected since the greater Ba2+ ion (1.47 Å) in the perovskite structure replaces the smaller Sr2+ ion (1.13 Å), which results in increased cell volumes and decreased crystallinity, which also confirms the substitution of ions.20 The crystal size quantified by Scherrer's equation is 25 nm for BaMnO3 and 39 nm for SrMnO3, which decreases to 21 nm for Ba0.5Sr0.5MnO3 catalyst (Table 1).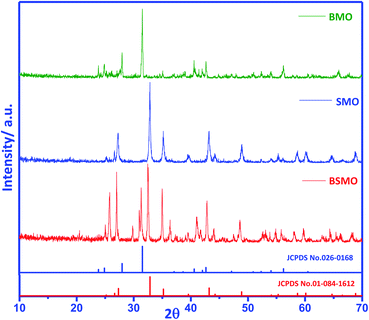 | ||
| Fig. 1 XRD patterns of BMO, SMO, and BSMO. Magnification of the XRD patterns to identify the shift of the main peaks. | ||
| Catalyst | Dxrda | SSAb, m2 g−1 | Vpb, cm3 g−1 | Atomic concentrationc (%) | Binding energiesc (ev) | Active oxygenc (%) | Mn4+/Mn3+ | OL/Ba + Sr + Mn | ||
|---|---|---|---|---|---|---|---|---|---|---|
Ba![[thin space (1/6-em)]](https://www.rsc.org/images/entities/char_2009.gif) : :![[thin space (1/6-em)]](https://www.rsc.org/images/entities/char_2009.gif) Sr Sr![[thin space (1/6-em)]](https://www.rsc.org/images/entities/char_2009.gif) : :![[thin space (1/6-em)]](https://www.rsc.org/images/entities/char_2009.gif) Mn Mn |
OL | Oads | Ohyd | |||||||
| a From Scherrer relationship.b From BET theory.c Surface elemental composition of the perovskite catalysts calculated from the peak area from XPS, N.B: areas under the peaks were exhibited between parenthesis. | ||||||||||
| BMO | 25 | 15 | 0.03 | 40![[thin space (1/6-em)]](https://www.rsc.org/images/entities/char_2009.gif) : :![[thin space (1/6-em)]](https://www.rsc.org/images/entities/char_2009.gif) 00 00![[thin space (1/6-em)]](https://www.rsc.org/images/entities/char_2009.gif) : :![[thin space (1/6-em)]](https://www.rsc.org/images/entities/char_2009.gif) 56 56 |
528.81 (6265) | 530.58 (6559) | 51% | 0.13 | 2.4 | |
| SMO | 39 | 18 | 0.02 | 0![[thin space (1/6-em)]](https://www.rsc.org/images/entities/char_2009.gif) : :![[thin space (1/6-em)]](https://www.rsc.org/images/entities/char_2009.gif) 59 59![[thin space (1/6-em)]](https://www.rsc.org/images/entities/char_2009.gif) : :![[thin space (1/6-em)]](https://www.rsc.org/images/entities/char_2009.gif) 49 49 |
528.14 (8656) | 530.05 (7357) | 531.68 (2100) | 40% | 0.29 | 1.7 |
| BSMO | 21 | 20 | 0.14 | 43![[thin space (1/6-em)]](https://www.rsc.org/images/entities/char_2009.gif) : :![[thin space (1/6-em)]](https://www.rsc.org/images/entities/char_2009.gif) 24 24![[thin space (1/6-em)]](https://www.rsc.org/images/entities/char_2009.gif) : :![[thin space (1/6-em)]](https://www.rsc.org/images/entities/char_2009.gif) 47 47 |
528.63 (5857) | 530.9 (6610) | 532.63 (1270) | 53% | 0.34 | 1.6 |
Based on the tolerance factor (t) of BaMnO3, SrMnO3, and Ba0.5Sr0.5MnO3, which equals 1.097, 1.033, and 0.942, respectively, these structures can be explained as follows: if (t) is equal to one, the geometry of the composition is ideal cubic perovskite. Nevertheless, if (t) is minor larger than unity, as in BMO and SMO, hexagonal perovskite structures are formed. Cations in the A site are enlarged because there is an increasing amount of face-shared links between octahedrons of MnO6. The bond angle between Mn–O–Mn face-shared linkages is detected to be 90° in these structures. In case t was slightly decreasing from unity as in BSMO, as a consequence of twisting and sloping alterations of MnO6 octahedron, Mn–O–Mn bond angle decreases 180° to recompense small A-site cations.21,22
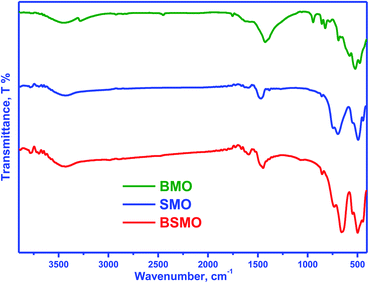
Fig. 2 displays the infrared spectra of the synthesized perovskites. The peak seen in the wavenumber range 450–492 cm−1 corresponds to the bending mode, which is sensitive to change in the Mn–O–Mn bond angles. The peak assigned in the range 505–786 cm−1 is attributed to the stretching vibration of metal oxide (M–O) bonds in BMO. The peak at 1590 cm−1 can be related to the H–O–H bending vibration. The main absorption band around 600 cm−1 corresponds to the stretching of the metal–oxygen bond in the perovskite, which involves the internal motion of a change in Mn–O–Mn bond length in MnO6 octahedral, which certified the formation of metal oxide framework in the perovskites. The three peaks at 760, 696, and 510 cm−1 are ascribed to the stretching vibration of metal–oxide (M–O) bonds in SMO, matching well with the published literature. The peak centered at 1639–1649 cm−1 is due to the bending vibration of aerially adsorbed water. The weak broadband visible around 3447–3498 cm−1 indicates the stretching vibration of hydroxyl groups (OH or H2O) with an intramolecular hydrogen bond. The FTIR spectra for BSMO perovskite show a similar SMO pattern, with an increase in the intensity of the vibration frequency at 1628 cm−1 which is characteristic of Ba–O stretching mode, and the band at 850 cm−1 attributed to the stretching vibration of metal oxide (M–O) bonds in BSMO sample. Also, the broadening and increasing intensity of the peaks in the range of (400–600 cm−1) the position of the stretching vibration of metal oxide (M–O). That is confirming the doping of SMO by Ba ion.23
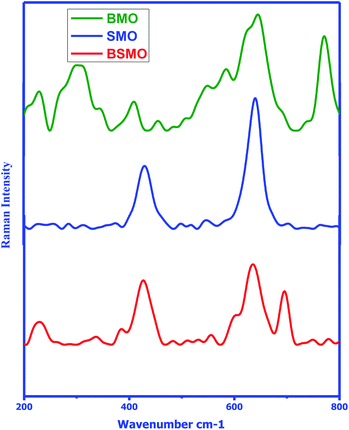
The structure of the prepared samples was also confirmed via Raman spectroscopy in the wavenumber range of 200–800 cm−1 (Fig. 3) clarified the behavior of the Raman intensity in the spectral ranges of 370–445 cm−1 and 610–770 cm−1 which are characteristic for bonds of Mn–O–Mn. In BSMO, 695 cm−1 indicating Ba–O–Ba bonds. These data are matching well with previously reported papers.24 Thus, the FTIR and Raman investigations are agreed well with the results of XRD.
X-ray photoelectron spectroscopy (XPS) is a valuable tool to identify the composition and oxidation state of the ions in the perovskite structures. XPS patterns of BMO & SMO samples (Fig. 4 and 5) display the essentials two peaks. For BMO sample binding energies (B.E) at 778.7 & 794.2 eV attribute to Ba 3d5/2 due to Ba2+ in the perovskite lattice and Ba 3d3/2 related to the surface oxide/hydroxide, respectively. The two peaks at 131.61 & 133.38 eV for the SMO sample identified the binding energies for Sr 3d5/2 and Sr3d3/2. These values established the presence of Sr2+ species in the lattice and the SrO/Sr(OH)2 structure on the surface, respectively. This means that Ba and Sr in the samples display +2 valence on the catalyst surface.25,26 On the other hand, the binding energy position for the BMSO sample is slightly shifted may be related to the partial substitution of the lower electronegative element (Sr: 0.95) with a higher one (Ba: 0.89). At the same time, the Ba 3d lines are not affected, which emphasized that substitution occurs in SMO, not in BMO lattice, in good agreements with XRD data.
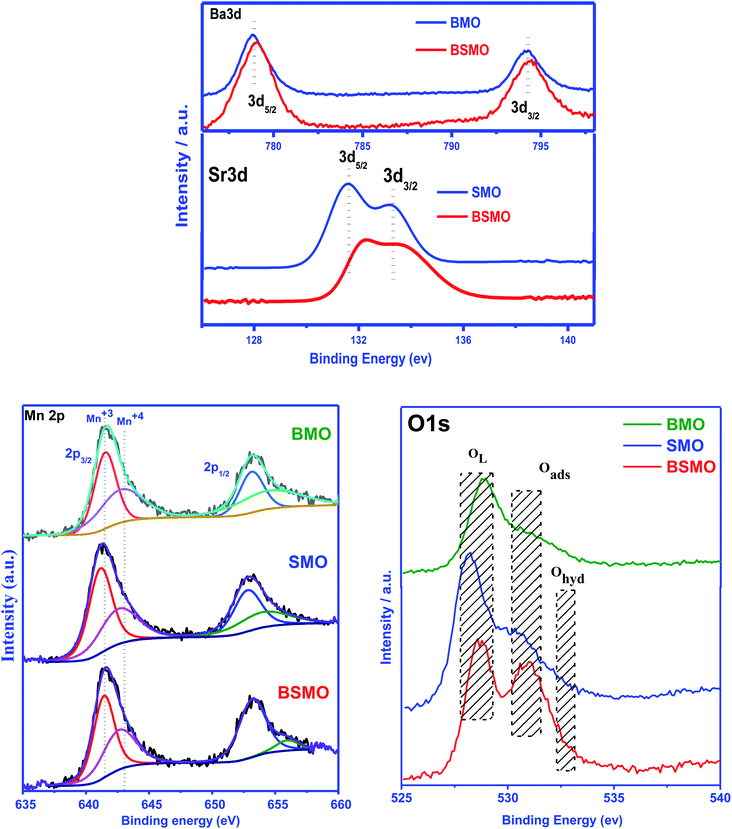 | ||
| Fig. 5 Ba 3d, Sr 3d, Mn 2p, and O 1s photoemission spectra of the BMO, SMO, and BSMO took in normal emission using non-monochromatic Al Kα X-ray source. | ||
From the literature, the assignment of the manganese oxidation states by XPS is a difficult task.27 In Fig. 5, the peak maximum of the Mn 2p3/2 transition suggests the occurrence of Mn3+ and Mn4+ in all the prepared samples. The Mn 2p3/2 band has been deconvoluted, and peaks at around 641.3 eV and 643.1 eV are ascribed to Mn3+ and Mn4+, respectively. It affirms the presence of +3 and +4 valence states of Mn on the surface of all samples. From the area of the corresponding peaks, the ratio Mn4+/Mn3+ was calculated and be lower than 1 for all the samples indicate that Mn3+ is the main oxidation state, the Mn4+/Mn3+ ratio for BMSO is the lowest value, which refers to the substitution of Ba with Sr promotes an increase of Mn3+ amount. Based on the BaMnO3 & SrMnO3 stoichiometric formula, Mn4+ has to be the predominant manganese oxidation state in the samples. Consequently, an increase of the Mn4+ amount would be expected to compensate for the additional defect of the positive charge (due to Sr substitution). However, XPS results reveal the opposite effect as the Mn3+ amount increase. Thus, electroneutrality must be achieved by generating oxygen vacancies by forming a non-stoichiometric (oxygen-deficient) perovskite ABO3−α. Furthermore, the highest amount of oxygen vacancies must be generated in the BSMO sample as it signified the lowest Mn4+/Mn3+ ratio.
Fig. 5 depicts the O 1s spectra of the prepared samples BMO, SMO, and BSMO. The O 1s spectra (SMO sample) with its signals at 528.1, 530.1, and 532.26 eV are ascribed to lattice oxygen (O2−), surface adsorbed oxygen (O2, O−), and surface carbonates and/or hydroxyl groups (Ohyd), respectively.28 The release from oxygen lattice (O2−) is usually caused by the redox binding of metal ions on the catalyst's surface. Indeed, the catalyst oxygen vacancy density sites are attributed to the release of adsorbed oxygen (O2, O−) species.29 We can also be observed that the release of oxygen species is attributable to variations in electron negativity between metal and oxygen which means that the metal and oxygen interactions are bindings.30 For alcohol partial oxidation reactions to corresponding aldehydes, higher content of (O2, O−) species is needed for that low-temperature reactions. As shown in Table 1, the percentages quantity of active oxygen of the samples, BMO, SMO, and BSMO, are found to be 51%, 40%, and 53%, respectively. It is clarified that the calculated amount of active oxygen species was higher for doped samples than the undoped ones. La1−xKxCo1−yCuyO3 catalysts with A and B cations substitution were tested, resulting in a rise in the surface oxygen groups correlated with oxygen vacancy generation.31
Furthermore, Zhan and the team found that when lanthanum substitutes for LaMn0.5Cu0.5O3 perovskite, an increase in the Oads/OL ratio suggests a greater amount of oxygen defects catalysts.32 Similarly, the lower amount value of the OL/(Ba + Sr + Mn) ratio increases the oxygen vacancies in prepared perovskites. In addition, BSMO catalyst is the perovskite with the highest number of structural defects, as is expected based on the analysis of the Mn 2p3/2 spectra. Thus, the sample BSMO might be an excellent catalytic activity because of its excellent redox properties and higher surface-chemisorbed oxygen species.
The textural parameters of the prepared nanostructured materials are listed in (Table 1 and Fig. 6) represented that all samples exhibited that a classical type IV isotherm, which was the characteristic of the mesoporous structure. The presence of H2 type hysteresis loops in the isotherms suggested the appearance of ink-bottle pores with narrow entrances and large cavities. The mean diameter and total volume of the nanostructures (Table 1) in the range of 1–10 nm by using the BJH analysis indicating the porous mesoporous structure.
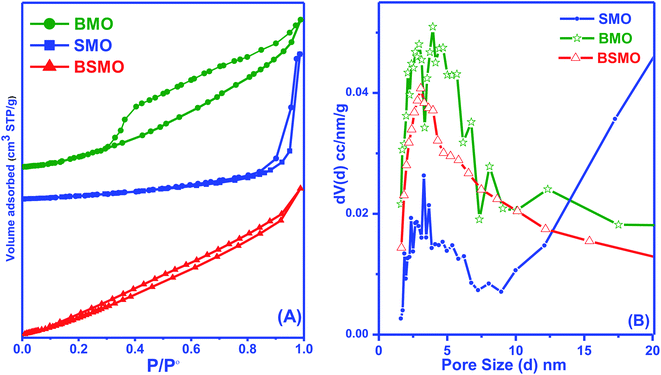 | ||
| Fig. 6 BET surface area (A) and pore size distribution analysis (B) of BMO, SMO, and BSMO catalysts. | ||
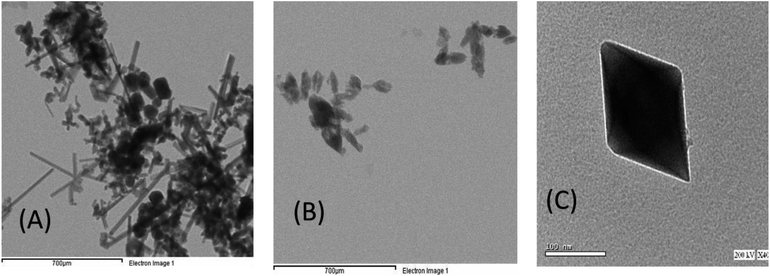
The morphology and microstructure of the sample were more explored by TEM (Fig. 7). Fig. 7A and B represent TEM images of the hierarchically nanostructured (BMO and SMO) perovskite samples, in which one can observe an individual nanorod with a smooth surface. In contrast, Fig. 7C (BSMO) shows the edges of the nanosheets built up by nanorods. That is similar to,33 who observed the same behavior on preparing hierarchically porous LaFeO3 via the hydrothermal method.
The number, strength, and strength distribution of acid/base sites were analyzed by TPD of NH3 and CO2 probe molecules, respectively. It is important to note that ammonia is suitable to quantify Brønsted acid sites (transfer of a proton from surface hydroxyls) and Lewis sites (coordination with an electron-deficient atom such as a metal cation).
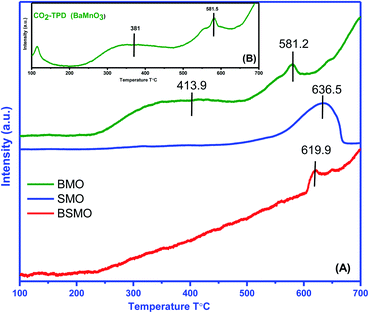
According to previous reports,34 the NH3 molecules coordinated to the Lewis acid sites exhibit higher thermal stability than the NH4+ ions bound to the Brønsted acid sites; herein, the mid-strong acid sites could mainly be the Lewis acid sites. For BMO, two desorption peaks were detected and attributed to the mid-strong acid sites (200–500 °C). Similarly, the number of CO2 desorption peaks (Fig. 8) was observed to be the same as the number of NH3 desorption peaks on BaMnO3. The total amount of acidity and basicity are 71 and 79 μmol g−1, respectively. So, catalysts displayed both acidic and basic characters. For the SMO and BSMO, the ammonia desorption peaks position 636.5 and 619.9, and the total acidity is 41 and 32 μmol g−1, respectively. By comparing the amount of NH3 desorption, it was concluded that the introduction of Ba played a positive effect on providing mid-strong acid sites. It is worth noting that BSMO has the least amount of strong acidic sites of all the prepared samples. Indeed, as displayed in Fig. 9, the O 1s binding energy (from XPS) decreases with an increasing number of acidic sites per surface area square meters. However, lower O 1s binding energy indicates an electron-rich element, which means more basic sites agree with Védrine et al.,35 proposal. All these results approve the amphoteric character of all samples.
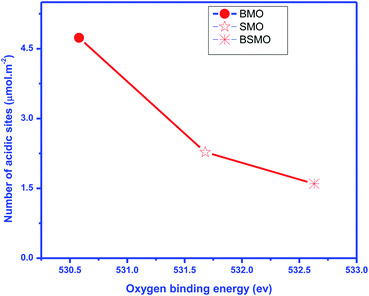 | ||
| Fig. 9 Oxygen binding energy obtained by XPS vs. a number of total surface acidic sites (expressed in μmol m−2). | ||
3.2. Catalytic activity
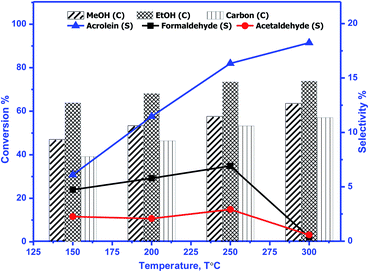
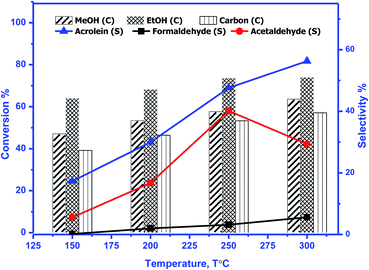
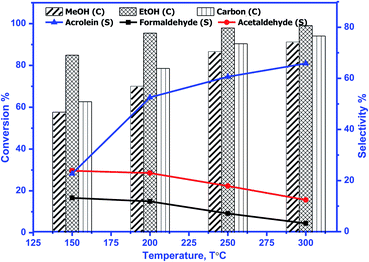
The catalytic activity of prepared perovskite samples was evaluated using a mixture of bio-alcohols methanol and ethanol in the presence of carrier (N2) with conditions LHSV = 10 h−1, temperature range = 150–300 °C, MeOH/EtOH = 1 molar ratio. The effect of temperature on mixed alcohol conversion, product distribution, and selectivity for prepared samples is graphically illustrated in Fig. 10–12.In our study, reaction conditions, a wide range of different reaction products of methanol and ethanol conversion can be classified as follows: (a) C–C coupling (e.g., C3+ alcohols; C3+ aldehydes; C3+ esters); (b) non-C–C coupling (e.g., formaldehyde, acetaldehyde, ethyl acetate). From the data in the figures, we can see that an increase in temperature from 150 to 300 °C affects pointedly on methanol and ethanol conversions. Methanol conversion was reached 64, 63.2, 90.2%, while ethanol conversion was reached 74, 73.4, 98.4% using BMO, SMO, and BSMO samples, respectively. As clarified, a good correlation between the conversion of alcohols and metal composition on the perovskite surfaces. The most essential obtained products are acrolein, acetaldehyde, and formaldehyde. In addition to traces of other tiny products. The low carbon balance (in the 57–93%) results from coke deposition on the catalyst surface.1 The absence of crotonaldehyde, acetaldehyde via self-aldolization (2CH3–CHO → CH3–CH–CHO), may be explained as follows: from thermodynamic view at a temperature range between 150 and 400. Acrolein is the more favored product formed than crotonaldehyde. Due to alcohol oxidation to aldehydes, the partial pressure of water vapor is even higher, inhibiting the self-aldolization reaction, and a pronounced product acrolein was formed.1 In other words, in the absence of oxygen, as in our study, both acetaldehyde and formaldehyde were adsorbed (creating two carbocations) and further reacted to form acrolein.
There is a positive correlation between catalytic activity and Mn4+/Mn3+ ratio on the surface (obtained from XPS). Mn4+ acts as stronger Lewis acids than Mn3+ and weak Lewis acid sites are required for this reaction. Therefore, BSMO with a low Mn4+/Mn3+ ratio exhibits high activity while BMO low catalytic activity. The loss of an electron (Mn3+) results in a significant migration of the unstable interstitial oxygen, which escapes from the lattice and transforms into active oxygen (O−). Similarly, doping of Sr2+ in a LaMnO3 perovskite has been described to present a mixture Mn3+ and Mn4+ states, where Mn3+–O bonds have different ionic strength than Mn4+–O bonds and consequently formed oxygen vacancies.36 Recent studies demonstrate that basic sites are required for catalyzing cross-condensation because they can activate acetaldehyde by abstracting a hydrogen atom from the α-position of carbonyl.6 In addition, weakly acidic sites can activate formaldehyde by increasing the C atom's electronegativity.9 Another report used molybdenum dopped copper ferrite for oxidative coupling of primary alcohols, demonstrate that the aldehyde formation by dehydrogenation or by oxidation needs the presence of moderately basic sites (M2+–O2−).37
For selectivity, acidic sites exhibit a strong influence on selectivity; the cross-selectivity seems to be controlled by acidity rather than basicity. On the other hand, using amphoteric catalysts as in our work, acrolein production is improved, and carbon oxides production is reduced, consequently allowing the catalyst to work at higher temperatures.8
As mentioned in TPD analysis, the prepared perovskites have acidic and basic sites and are considered amphoteric catalysts. BSMO exhibits a high basic character which explains its high catalytic activity rather than BMO and SMO. BSMO displays moderate acidic and basicity character among the others, which elucidate high acrolein selectivity at relatively low temperature (200 and 250 °C), which reached ∼52 and 60%, respectively.
The formation of acrolein via cross condensation between formaldehyde and acetaldehyde can be summarized via the following equations (eqn (5)–(8)):
O−(Surf) + O![[double bond, length as m-dash]](https://www.rsc.org/images/entities/char_e001.gif) CHCH3 → (Surf)–O–CHO−–CH3 CHCH3 → (Surf)–O–CHO−–CH3
| (5) |
(Surf)–O–CHO−–CH3 + O![[double bond, length as m-dash]](https://www.rsc.org/images/entities/char_e001.gif) CH2 → (Surf)–O–OHC–CH2O−–CH3 CH2 → (Surf)–O–OHC–CH2O−–CH3
| (6) |
| (Surf)–O–OHC–CH2O−–CH3 ↔ (Surf)–O–O−–C–CH2OH–CH3 | (7) |
 | (8) |
The methyl ethyl ether selectivity is higher at low temperatures. The catalyst order BMO > BSMO > SMO decreases with increasing temperature, in which dehydration reactions occur faster than other reactions. One alcohol molecule is adsorbed on the weak Lewis acid sites via the oxygen of the OH group. The second alcohol molecule is adsorbed on the strong Lewis basic site via the H of the OH group, resulting in forming an alkoxide on the surface, which reacts to form corresponding ether.38 On the contrary, methyl acetate formation increases with increasing temperature. Indeed, the BSMO has a higher selectivity for methyl acetate, reaching 18% at 300 °C. The selectivity is explained by the formed acetaldehyde with the newly formed methanol molecule via oxidative esterification (non-C–C coupling) to form methyl acetate.
For all samples, methyl acetate reached the plateau or slowly increased in selectivity with increasing temperature due to complete conversion of methanol as in BSMO or methanol decomposition favored at high temperatures. The increase in the selectivity of propanol and butanol alcohols is consistent with their involvement in esterification reactions, as evidenced by the concurrent increase in the selectivity of ester. Moreover, the presence of aldehyde accelerates the ester formation and, at the same time, prevents the oxidation of the secondary aldehyde to acid.
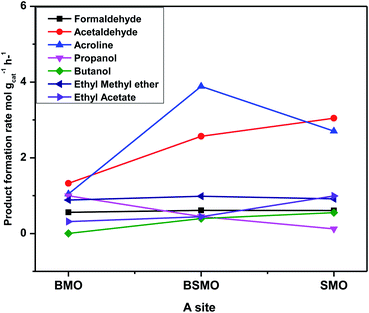
Fig. 13 illustrates that the doping of SMO with Ba2+ in BSMO attained the highest rate of C–C coupling products relative to non-C–C coupling at 250 °C. In conclusion, the observed results suggested that the prepared BMO, SMO, and BSMO samples are more favorable for C–C coupling products with low production of non-C–C coupling and negligible COx byproducts.
4. Characterization of used catalysts
The types of carbon species formed on the used BMO, SMO, and BSMO catalysts were examined using a thermogravimetric analyzer (TGA). Their TGA profiles and derivatives are shown in (Fig. 14). The initial loss below 300 °C in all catalysts is due to removing moisture, and CO2 adsorbed, followed by the loss of easily oxidized carbonaceous species.39 The used BSMO catalysts profile exhibits an exothermic peak at around 415 °C, attributed to physisorbed carbonaceous products (softcore). In comparison, BMO and SMO profile exhibits the peaks at higher temperature 540 and 590 °C respectively. This associated with filamentous hard coke followed a major decrease in the sample's weight (∼1.5 and 2%), showed the gasification of the bulky carbonaceous species or hard coke, generating CO and CO2 (COx).40 In addition, the peak at the high-temperature range of 600–700 °C is attributing to graphitic carbon species. This graphitic carbon is a non-reactive coke that infrequently reacts with oxygen.41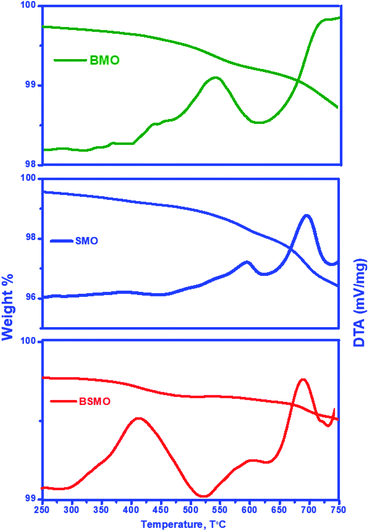 | ||
| Fig. 14 TGA and their derivative spectra of used BMO, SMO, and BSMO catalysts after oxidative coupling reaction of methanol and ethanol. | ||
Fig. 15 shows the FT-IR spectra of fresh and used after oxidative coupling reaction of methanol and ethanol. There is no noticeable difference in the spectra for the fresh and used catalysts. The intensities of all bands decreased, probably due to coke deposition on the perovskite surface. This behavior is not found to a great extent in the case of a BSMO catalyst. The coke formation could further verify this, as shown in the TG curves.
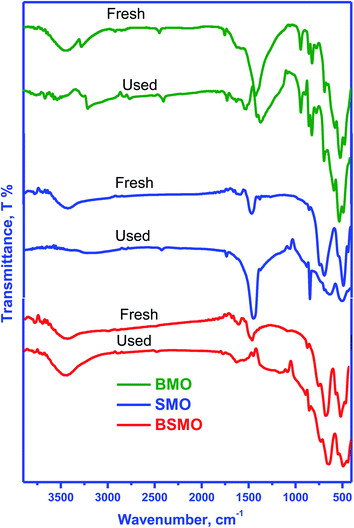 | ||
| Fig. 15 FT-IR spectra of fresh and used BMO, SMO, and BSMO catalysts after oxidative coupling reaction of methanol and ethanol. | ||
SEM images obtained at 4000 magnification are shown in (Fig. 16A), revealing the effect of the change in A element in ABO3 perovskite on uniformity, homogeneity, and surface morphology of the perovskite samples. All samples show good homogeneity having almost uniform shapes. The grain boundaries are sharp, with most of the grains have nanorods with a diameter in the nanometer range and a length of 2 μm. The average grain diameter for the BSMO is the least one of the fresh catalysts showing that grain size is highly doping dependent. Most grain's plane and sharp faces also show the crystallographic texture and well-oriented growth samples.22 The images also show the walls of macropores, which were assembled by a large number of nanoparticles with the formation of nanovoids, and it was apparent confirm that perovskite samples possessed hierarchically pore structure; this would make reactants more diffuse and increase the contact effectiveness between reactants and catalysts so that improved catalytic performance could be achieved.33
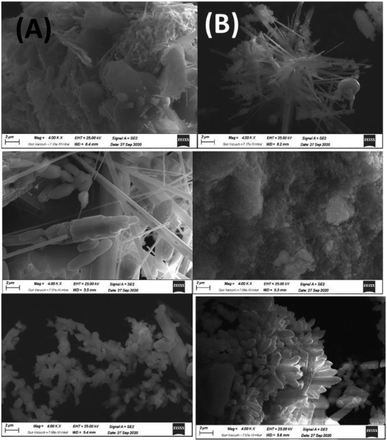 | ||
| Fig. 16 FESEM images of BMO, SMO and BSMO perovskite catalysts fresh (A) and after (B) oxidative coupling of mixed alcohol reaction. | ||
All surfaces have been rearranged to take on more regular forms after the reaction as shown in (Fig. 16B). In contrast, SMO has modified all surface morphologies to reflect further particle deformation and agglomeration, mainly because of the problematic reaction conditions during the process, so that it generated no aggregates of regular shapes or structures.
EDX is a technique used to identify the elemental composition of the typical product. The EDX spectra established in all the samples have no impurity element present in the samples (Fig. 17A and B). The elements present in the respective spectra are correct stoichiometric ratios, precisely following empirical formulas of the corresponding composition. The EDX results prove that only three types of elements, Ba or Sr, Mn, and O, in the BMO and SMO samples. And four elements Ba, Sr, Mn, and O in the BSMO sample. There are some minor peaks related to C (in fresh catalyst) because of the sticking tape used to hold the samples in place. It related the carbon peaks that appear in the EDX spectra to coke deposition,43 as confirmed in TGA and FTIR analysis for used catalysts.
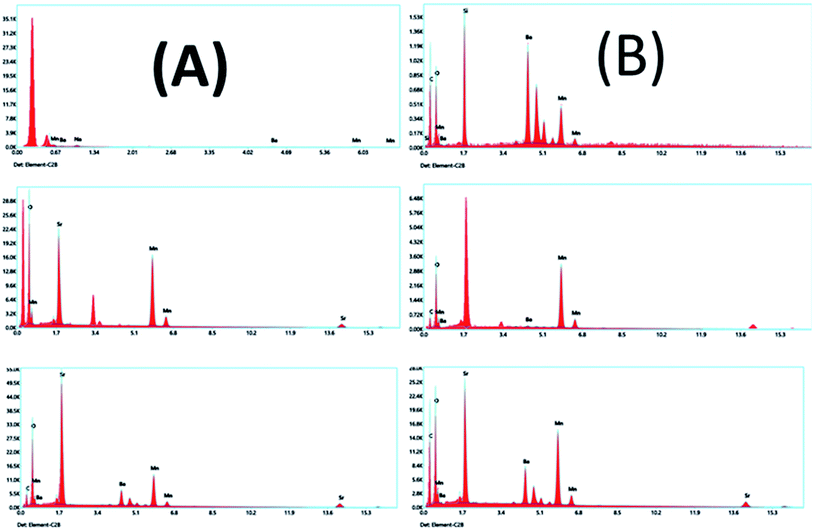 | ||
| Fig. 17 EDX analyses of BMO, SMO, and BSMO perovskite catalysts fresh (A) and after (B) oxidative coupling of mixed alcohol reaction. | ||
Table 2 shows the comparison of different catalysts towards acrolein selectivity via oxidative coupling of bio-alcohols mixture.
5. Conclusion
The physico-chemical properties of hierarchically porous perovskite catalysts were determined by XRD, FTIR, Raman spectroscopy, XPS, N2 sorption, TEM, SEM, TGA, and NH3–CO2-TPD. Also, the role of A (Ba or/and Sr) position variation in AMnO3 perovskite catalysts has been studied in the oxidative coupling of primary alcohols performed at atmospheric pressure using a methanol/ethanol equal 1. These characteristics were associated with catalytic activities for the aldolization reaction (to form acrolein), promoted by coordination between the acids and basic sites. The balance of acidic and basic properties of the catalysts is critical in the production of acrolein. Of the catalysts studied, BaSrMnO3 demonstrated the highest performance, followed by SrMnO3 and BaMnO3. The high activity was attributed to the significantly faster formation of C–C bonds in BaSrMnO3 than in other materials. Acrolein, acetaldehyde, methanol, ethanol were the main products found with each catalytic test. Crotonaldehyde was not formed during the reaction, indicating more resistance to self-condensation kinetics than the cross-condensation reaction under current reaction conditions. In general conclusion, these catalysts propose promising yields of acrolein, making it a superb choice to be effective in a viable process.Conflicts of interest
There are no conflicts to declare.References
- A. Lilić, T. Wei, S. Bennici, J. F. Devaux, J. L. Dubois and A. Auroux, ChemSusChem, 2017, 10, 3459–3472 CrossRef.
- L. Liu, X. P. Ye and J. J. Bozell, ChemSusChem, 2012, 5, 1162–1180 CrossRef CAS.
- W. G. Etzkorn, Kirk-Othmer Encycl. Chem. Technol., 2009, 1–29 Search PubMed.
- V. Folliard, G. Postole, J. F. Devaux, J. L. Dubois, L. Marra and A. Auroux, Appl. Catal., B, 2020, 268, 118421 CrossRef CAS.
- N. S. Shamsul, S. K. Kamarudin, N. A. Rahman and N. T. Kofli, Renewable Sustainable Energy Rev., 2014, 33, 578–588 CrossRef CAS.
- A. Borowiec, J. F. Devaux, J. L. Dubois, L. Jouenne, M. Bigan, P. Simon, M. Trentesaux, J. Faye, M. Capron and F. Dumeignil, Green Chem., 2017, 19, 2666–2674 RSC.
- E. Dumitriu, V. Hulea, C. Chelaru, C. Catrinescu, D. Tichit and R. Durand, Appl. Catal., A, 1999, 178, 145–157 CrossRef CAS.
- C. Cobzaru, S. Oprea, E. Dumitriu and V. Hulea, Appl. Catal., A, 2008, 351, 253–258 CrossRef CAS.
- A. Azzouz, D. Messad, D. Nistor, C. Catrinescu, A. Zvolinschi and S. Asaftei, Appl. Catal., A, 2003, 241, 1–13 CrossRef CAS.
- W. J. Palion and S. Malinowski, React. Kinet. Catal. Lett., 1974, 1, 461–465 CrossRef CAS.
- C. Paper, G. Panchal, H. Berlin and D. M. Phase, AIP Conf. Proc., 2018, 1953, 100035 CrossRef.
- E. Grabowska, Appl. Catal., B, 2016, 186, 97–126 CrossRef CAS.
- F. Wang, Y. Q. Zhang, Y. Bai, W. Liu, H. R. Zhang, W. Y. Wang, S. K. Li, S. Ma, X. G. Zhao and J. R. Sun, Appl. Phys. Lett., 2016, 109, 52403 CrossRef.
- H. Prasad, J. Sai, S. Pradhan, S. Kumar, N. K. Labhsetwar and H. Dasari, Mol. Catal., 2019, 110665 Search PubMed.
- L. M. Torres-Martínez, M. E. Meza-de la Rosa, L. L. Garza-Tovar, I. Juárez-Ramírez, F. Tzompantzi, G. Del Angel, J. M. Padilla and R. Gómez, Adv. Mater. Res., 2010, 132, 61–67 Search PubMed.
- H. Kleineberg, M. Eisenacher, H. Lange, H. Strutz and R. Palkovits, Catal. Sci. Technol., 2016, 6, 6057–6065 RSC.
- A. S. B. Ruyan and G. Rustum, Mater. Res. Innovations, 2000, 4, 3–26 CrossRef.
- M. Zare and H. Mahmoudi, Appl. Phys. A, 2018, 124, 1–8 CrossRef CAS.
- G. George, S. L. Jackson, C. Q. Luo, D. Fang, D. Luo and D. Hu, Ceram. Int., 2018, 44, 21982–21992 CrossRef CAS.
- N. Rezlescu, E. Rezlescu, P. D. Popa, C. Doroftei and M. Ignat, Mater. Chem. Phys., 2016, 182, 332–337 CrossRef CAS.
- J. J. Adkin and M. A. Hayward, Chem. Mater., 2007, 19, 755–762 CrossRef CAS.
- S. K. Abbas, M. A. Aslam, M. Amir and S. Atiq, J. Alloys Compd., 2017, 712, 720–731 CrossRef CAS.
- F. Gao, R. A. Lewis, X. L. Wang and S. X. Dou, J. Alloys Compd., 2002, 347, 314–318 CrossRef CAS.
- A. N. Ulyanov, A. V. Sidorov, N. E. Pismenova, E. A. Goodilin and S. V. Savilov, Solid State Sci., 2019, 94, 41–44 CrossRef CAS.
- C. J. Eom, D.-Y. Kuo, C. Adamo, E. J. Moon, S. J. May, E. J. Crumlin, D. G. Schlom and J. Suntivich, Nat. Commun., 2018, 9, 4034 CrossRef PubMed.
- V. Celorrio, L. Calvillo, G. Granozzi, A. E. Russell and D. J. Fermin, Top. Catal., 2018, 61(3), 154–161 CrossRef CAS.
- V. Torregrosa-Rivero, V. Albaladejo-Fuentes, M.-S. Sánchez-Adsuar and M.-J. Illán-Gómez, RSC Adv., 2017, 7, 35228–35238 RSC.
- D. Mukherjee, B. G. Rao and B. M. Reddy, Appl. Catal., B, 2016, 197, 105–115 CrossRef CAS.
- Y. Wu, L. Li, B. Chu, Y. Yi, Z. Qin, M. Fan, Q. Qin, H. He, L. Zhang, L. Dong, B. Li and L. Dong, Appl. Catal., A, 2018, 568, 43–53 CrossRef CAS.
- S. Wagloehner, M. Nitzer-noski and S. Kureti, Chem. Eng. J., 2015, 259, 492–504 CrossRef CAS.
- Z. Li, M. Meng, Y. Zha, F. Dai, T. Hu, Y. Xie and J. Zhang, Appl. Catal., B, 2012, 121–122, 65–74 CrossRef CAS.
- H. Zhan, F. Li, P. Gao, N. Zhao, F. Xiao, W. Wei and Y. Sun, RSC Adv., 2014, 4, 48888–48896 RSC.
- S. Zhao, L. Wang, Y. Wang and X. Li, J. Phys. Chem. Solids, 2018, 116, 43–49 CrossRef CAS.
- D. Yu, X. Zhong, D. Liu and Y. Liang, RSC Adv., 2019, 9, 32232–32239 RSC.
- J. C. Védrine, Res. Chem. Intermed., 2015, 41, 9387–9423 CrossRef.
- A. E. Ramos, D. Maiti, Y. A. Daza, J. N. Kuhn and V. R. Bhethanabotla, Catal. Today, 2019, 338, 52–59 CrossRef CAS.
- G. Mitran, S. Chen and D. Seo, Materials, 2019, 12, 1871 CrossRef CAS.
- J. I. Di Cosimo, C. R. Apesteguía, M. J. L. Ginés and E. Iglesia, J. Catal., 2000, 190, 261–275 CrossRef CAS.
- B. Djebarri, V. M. Gonzalez-Delacruz, D. Halliche, K. Bachari, A. Saadi, A. Caballero, J. P. Holgado and O. Cherifi, React. Kinet., Mech. Catal., 2014, 111, 259–275 CrossRef CAS.
- D. Aman, D. Radwan, M. Ebaid, S. Mikhail and E. van Steen, Mol. Catal., 2018, 452, 60–67 CrossRef CAS.
- H. Zhang, S. Shao, R. Xiao, D. Shen and J. Zeng, Energy Fuels, 2014, 28, 52–57 CrossRef CAS.
- A. Lilic, S. Bennici, J.-F. Devaux, J.-L. Dubois and A. Auroux, ChemSusChem, 2017, 10, 1916–1930 CrossRef CAS PubMed.
- V. Folliard, G. Postole, L. Marra, J.-L. Duboisc and A. Auroux, Catal. Sci. Technol., 2020, 10, 1889–1901 RSC.
- A. Borowiec, A. Lili, J. Morin, J. Devaux, J.-L. Dubois, S. Bennicie, A. Auroux, M. Capron and F. Dumeignil, Appl. Catal., B, 2018, 237, 149–157 CrossRef CAS.
| This journal is © The Royal Society of Chemistry 2021 |

