 Open Access Article
Micro-area investigation on electrochemical performance improvement with Co and Mn doping in PbO2 electrode materials†
Ze Lv,
Zhen Chen *,
Qiang Yu,
Wei Zhu,
Hongjun You,
Bangyao Chen,
Zhaoyi Zheng,
Yuanyuan Liu and
Qi Hu
Faculty of Science, Kunming University of Science and Technology, Kunming 650093, China. E-mail: chenzhen@kust.edu.cn
First published on 31st August 2021
Abstract
PbO2–Co3O4–MnO2 electrodes, used in the electrowinning industry and in the degradation of organic pollutants, have demonstrated an elevated performance through macroscopic electrochemical measurements. However, few reports have investigated localized electrochemical performance, which plays an indispensable role in determining the essential reasons for the improvement of the modified material. In this study, the causes of the increase in electrochemical reactivity are unveiled from a micro perspective through scanning electrochemical microscopy (SECM), X-ray diffraction (XRD), Raman microscopy (Raman), and X-ray photoelectronic energy spectroscopy (XPS). The results show that the increase of electrochemical reactivity of the modified electrodes results from two factors: transformation of the microstructure and change in the intrinsic physicochemical properties. Constant-height scanning maps indicate that the electrochemical reactivity of the modified electrodes is higher than that of the PbO2 electrode on the whole and high-reactivity areas are orderly distributed, coinciding with the observations from SEM and XRD. Thus, one of the reasons for the improvement of the modified electrode performance is the refinement of the microscopic morphology. The other reason is the surge of the oxygen vacancy concentration on the surface of the coating, which is supported by XRD, Raman and XPS. This finding is detected by the probe approach curve (PAC), which can quantitatively characterize the electrochemical reactivity of a substrate. Heterogeneous charge transfer rate constants of the modified electrode are 4–5 times higher than that of the traditional PbO2 electrode. This research offers some insight into the electrochemical reactivity of modified PbO2 electrodes from a micro perspective.
1. Introduction
As a kind of ceramic electrode material, PbO2 has excellent corrosion resistance and a strong oxidation ability, and it can withstand large currents. Despite the virtues mentioned above, there is huge room for improvement in terms of the electrochemical reactivity of the PbO2 electrode. Researchers have modified and refined PbO2 electrodes by inserting ions,1,2 doping with active and inert particles,3,4 and changing the structure of PbO2.5–7 As a result, the electrochemical reactivity of the PbO2 electrode is enhanced and the application range of the PbO2 electrode is expanded. In the electrocatalytic reaction, element doping can produce more oxygen defects, increase active sites, and improve the redox ability of electrode materials. In general, to verify the enhancement of new electrodes, the voltammetry charge (qt), charge transfer resistance (Rct) and exchange current density extracted from cyclic voltammetry (CV), AC impedance (EIS) and linear sweep voltammetry (LSV), respectively, are persuasive evidence. However, these electrochemical analysis parameters obtained from macroscopic electrochemical measurements only reflect the average performance of the entire electrode area. They cannot illustrate the connection between the microscopic morphology, the difference of element composition and the macroscopic properties, which should not be ignored. This limitation has significantly hampered research on the mechanism of strengthening performance. The electrode reaction is a heterogeneous catalytic reaction. The catalytic reaction occurs at the interface between the electrode and electrolyte. The surface of the material provides a place for the liquid phase reactant molecules to participate in a reaction. Therefore, the microscopic morphology plays an important role in the reactivity and selectivity of electrocatalytic materials. Actually, some researchers have stated that the most important factor determining the catalytic performance is the surface morphology of the electrode material.8–11 It is a misconception that all tiny regions on an electrode share the same electrochemical reactivity. To solve this problem, a research method with high spatial resolution is needed to analyze the electrochemical reactivity variation on different micro-regions and further to establish the relationship between electrode performance and microscopic morphology. SECM is a microscopic method that can better understand complicated electrochemical systems. SECM explores the reactivity changes at the micrometer-level and provides a brand new way to look into the reaction mechanism and kinetics of the electrode interface. At the same time, electrochemical imaging technology can collect the spatial analysis information of the substrate surface related to the surface topography structure and composition, creating a powerful approach to discover the relationship between the microtopography structure and the reactivity.SECM can carry out electrochemical measurements on the micrometer scale. The ultramicro probe moves above an area close to the substrate and the Faraday current generated by the electrochemical reactions around the probe are recorded to study the electrochemical process and morphology of the substrate. SECM has evolved many valuable functions including the feedback mode,12,13 substrate generation – probe collection mode,14 redox competitive mode,15 and surface inquiry mode.16 For one thing, SECM breaks through the limitations of traditional electrochemical methods with high-resolution, on-site, and three-dimensional observations,17–19 which are closer to the actual situation of the substrate. For another thing, SECM can obtain the dependence of the electron transfer rate on the substrate potential and can also obtain quantitative information about the uneven distribution of the substrate. Wang20 successfully characterized the relationship between electrochemical reactivity and crystallographic orientation on the surface of a polycrystalline platinum electrode with the help of SECM and electron backscatter diffraction (EBSD), they determined the structure–reactivity relationship of the electrocatalytic effect of the polycrystalline platinum electrode surface on the HOR in the sulfuric acid solution. The relationship shows that the catalytic activity of the hydrogen oxidation reaction (HOR) increases in the order of Pt(100) < Pt(110) < Pt(111) near the standard potential of hydrogen. Huai21 employed electron transfer rate constants to simulate and re-evaluate the vulcanization reaction on malachite, combined with X-ray photoelectron spectroscopy (cryo-XPS) to characterize the corresponding surface morphology and confirmed the vulcanizing agent at two different concentrations, providing corresponding guidance for malachite flotation. Yao22 disclosed detailed information on the kinetics and reaction mechanism of Cu(II)/Cu(I) redox reactions determined SECM in systems with excess chloride. This work provides valuable insights for analyzing the electrode kinetics of unstable metal complexes in aqueous solutions. Zheng23 used SECM and EIS to study the localized electrochemical reactivity and heterogeneous charge transfer rate constant of the β-PbO2 electrode. The results illustrated that the β-PbO2 electrode is significantly different in terms of electrochemical reactivity. When the substrate potential is maintained at 0.5 V, the [Fe(CN)6]4−oxidation reaction rate on the localized β-PbO2 electrode is the largest, achieving the best constant-height image resolution; besides, the EIS also demonstrated that the charge transfer process of [Fe(CN)6]4− is the easiest when the substrate is 0.5 V.
In this project, SECM is employed to reveal the essential reasons for the enhancement of the performance of the PbO2–Co3O4–MnO2 composite electrode in the [Fe(CN)6]3−/[Fe(CN)6]4− system. At first, electrochemical information on the substrate is collected by moving the probe in a constant-height scanning method, thousands of current space coordinates are collected and a three-dimensional map is drawn, through which localized electrochemical reactivity in different micro areas is presented clearly. Then, the distribution regularity of the high-reactivity area is expected to compare with the microscopic image showing morphology. So the relationship between modified morphology and electrochemical reactivity will be concluded. Secondly, the nonlinear fitting of the PAC at different substrate potentials is carried out to quantitatively study the electrochemical reaction reactivity difference of the micro-area and to explore the relationship between the characteristics of the modified electrode and its electrochemistry reactivity. Finally, XRD, Raman, XPS, and other characterization methods are combined to study the physicochemical properties of the electrode. SECM is an effective method to detect the electrochemical reactivity distribution on the surface of composite electrode, providing a new way to study modified PbO2 electrodes and the relationship between electrochemical reactivity and microscopic structure and intrinsic physicochemical properties.
2. Experiments and methods
Materials and preparation of the PbO2 electrode and PbO2–Co3O4–MnO2 electrode
Lead nitrate and sodium fluoride (XILONG SCIENTIFIC CO., LTD), copper nitrate, cobalt nitrate, and 50% manganese nitrate water solution (Tianjin Fengchuan Chemical Reagent Technology Co., Ltd), and potassium ferricyanide and potassium chloride (shanghai Aladdin Biochemical Technology CO., LTD) were obtained.The PbO2 electrode was prepared by anode oxidation in a plating solution composed of 190 g L−1 Pb(NO3)2, 0.5 g L−1 NaF, and 15 g L−1 Cu(NO3)2. The anode was a stainless steel sheet (10 mm × 50 mm × 1 mm), the cathode was a stainless steel cylinder. The electrodeposition was conducted under a constant-current power source of 5 mA cm−2 for 45 minutes, the temperature was 45 °C.
The β-PbO2 intermediate layer was prepared via anodic oxidation at a current density of 5 mA cm−2 for 15 minutes through using a constant-current power source. Stainless steel sheets were employed as the anode. A stainless steel cylinder served as the cathode. The composition of the electrodeposition solution was 190 g L−1 Pb(NO3)2, 0.5 g L−1 NaF, 0.5 g L−1 AEO-7, and 15 g L−1 Cu(NO3)2, the pH was 3, and the bath temperature was 40 °C.
The PbO2–Co3O4–MnO2 electrode was prepared by anode oxidation in a plating solution composed of 190 g L−1 Pb(NO3)2, 15 g L−1 Cu(NO3)2, 4 g L−1 Mn(NO3)2, 40 g L−1 Co(NO3)2, 0.5 g L−1 NaF, and 10 g L−1 citric acid. The anode was a β-PbO2 intermediate layer, the cathode was a stainless steel cylinder. The electrodeposition was conducted under a constant-current power source of 5 mA cm−2 for 45 minutes, the temperature was 45 °C.24
Scanning electrochemical microscopy
A diagram of the SECM instrument is shown in Fig. S1 (ESI†). It is mainly composed of three parts: the electrochemical part (double potentiostat, probe, electrolytic cell, substrate, and various electrodes), the piezoelectric controller (to accurately control the position of the probe and base), and a computer (including an interface).Scanning electrochemical microscopic imaging
The “feedback mode” and “substrate generation – probe collection mode” were used to characterize the substrate surface in the constant-height scanning maps. A SECM image is obtained by scanning the tip in the x–y plane and monitoring the UME tip current, iT, as a function of the UME tip location, the so-called constant height mode. The feedback mode is based on a given probe potential and substrate potential, collecting the probe current with the distance d between the probe and the substrate to obtain a local electrochemical reactivity distribution map. In the experiment, the UME tip has a quiet time of 60 s and the step distance is 1 μm, all experiments are in 10 mmol L−1 K3[Fe(CN)6] and 0.1 mol L−1 KCl solution.Probe approach curves analysis
The PACs measurement adopts the feedback mode, and a PbO2–Co3O4–MnO2 electrode of about 10 mm × 50 mm × 1 mm was installed at the bottom of the electrolytic cell as the first working electrode, with an exposed area of 14.51 mm2 (the area of the small holes in the electrolytic cell). The Pt ultramicrodisk electrode (Shanghai Chenhua company) with an effective radius a = 5 μm and shielding coefficient RG = 1.5 (for related calculations, refer to ESI†) was used as the second working electrode. Ag/AgCl/3 mol L−1 KCl serves as the reference electrode; Pt wire serves as an auxiliary electrode. 10 mmol L−1 K3[Fe(CN)6] solution was used as the redox medium, 0.1 mol L−1 KCl solution was used as the supporting electrolyte, and the probe voltage was 0.05 V vs. Ag/AgCl to control the probe tip reaction, as shown in reaction 1 to reduce K3[Fe(CN)6]. The probe stabilization status during the experiment is detailed in the ESI.†| [Fe(CN)6]3− + e− → [Fe(CN)6]4− | (1) |
As Fig. 1a illustrates, the probe was moved to the position 100 μm above the PbO2–Co3O4–MnO2 electrode keeping an open circuit potential. This location is theoretically far enough from the substrate thus the current detected in the tip is ruled by the flux of [Fe(CN)6]3− from the bulk solution to the tip. This situation refers to “hemispherical diffusion” and a correlative detail mathematical formula is presented in the ESI.† First, the UME tip was parallel to the substrate until the UME tip was close to the surface of the substrate, and then the probe was returned to a certain distance and next an approximation was performed to obtain the corresponding probe approach curve. When the UME tip is close to the substrate, the PbO2–Co3O4–MnO2 electrode will interfere with the probe current in a positive feedback manner, the diffusion current will increase. As shown in Fig. 1b, this is due to the fact that the [Fe(CN)6]4− generated on the UME tip can be oxidized on the surface of the PbO2–Co3O4–MnO2 electrode, the current collected by the probe eventually increases. This process is called positive feedback diffusion. The corresponding oxidation reaction is represented by reaction (2). Fig. 1c shows the probe approach curves in the corresponding positive feedback mode. Under the positive feedback conditions, the electron transfer is enhanced, leading to a significant increase in the electron transfer rate constant k. This was to infer the essential reason for the improved performance of the modified electrode.
| [Fe(CN)6]4− − e− → [Fe(CN)6]3− | (2) |
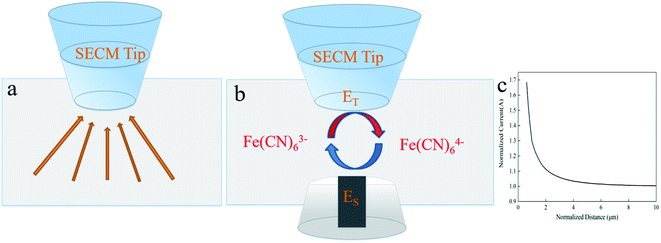 | ||
| Fig. 1 (a) Hemispherical diffusion, (b) positive feedback diffusion, and (c) positive feedback curve. | ||
The nonlinear fitting of probe approach curves on a substrate
In this study, the nonlinear fitting method of PACs was used to quantitatively distinguish the electrochemical reactivity changes of the two electrodes by plotting the Y-axis as IT (IT = iT/iT,∞, the tip current normalized by the current is far from the substrate) and the X-axis as the L (L = d/a, the tip-substrate separation normalized by the tip radius) curve. Both X and Y are given in dimensionless form. Since this plot involves only dimensionless variables, it does not depend upon the concentration or diffusion coefficient of O. Through the nonlinear fitting of the following equations, the kinetic information of the charge transfer process in the substrate can be described and the charge transfer rate constant k of the reaction can be determined. The equation details of the tip approach curves can be found in the ESI.†Physical characterization analysis
The microscopic surface morphology of the PbO2–Co3O4–MnO2 electrode was obtained by SEM (Phenom ProX). XRD was used to analyze the phase composition and crystal structure. The chemical composition and elemental states on the PbO2–Co3O4–MnO2 electrode surface were analyzed through X-ray energy spectroscopy (EDS, EDAX-PHOENIX, EDAX, USA) and X-ray photoelectron spectroscopy (XPS, PHI5000 Versa ProbeII, Ulvac-PHI, Japan). Raman imaging on the surface of the substrate used a confocal Raman microscope (Raman, Renishaw) to analyze the Raman intensity at different positions of the substrate and the origin was used to map and analyze the Raman surface scan imaging data.3. Results and discussion
Micromorphology and elemental composition of two electrodes
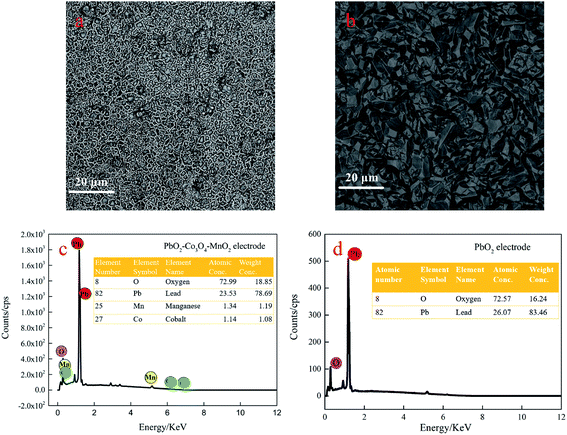
Fig. 2(a and b) shows the micromorphology of the PbO2–Co3O4–MnO2 electrode and PbO2 electrode. Compared with the pure PbO2 electrode, the microscopic morphology of the PbO2–Co3O4–MnO2 electrode has transformed into a spherical structure with a distinct boundary. After doping with Co3O4 and MnO2, the grain size of PbO2 is significantly refined, rendering the grain smaller, compact and uniform. On the other hand, the PbO2 prepared by the traditional way is pyramid-shaped, which is the typical structure and morphology of β-PbO2.The EDS analysis results of the PbO2–Co3O4–MnO2 electrode and PbO2 electrode are shown in Fig. 2c and d. The active layer of the PbO2–Co3O4–MnO2 electrode includes four elements: O, Pb, Co, and Mn. The SEM image and the corresponding element map are shown in Fig. S2 (ESI†). The content of the four elements is 72.99%. 23.53%, 1.34%, and 1.14%. The relative content of Co and Mn is low. During the electrodeposition process, the plausible explanation is that the process of incorporating Co and Mn into PbO2 involves at least two stages, the first stage is the chemical adsorption of Co2+ and Mn2+ on the growing PbO2 deposit; the second stage is the electro-oxidation of Co2+, Mn2+ to Co3+ and Mn4+ (Co3O4 and MnO2) are incorporated within PbO2.25 With the increase of lead oxide on the electrode surface; the occurrence rate of the oxygen evolution reaction on the electrode surface is accelerated26 and the oxygen evolution reaction forms competition with oxidation reaction,27 ultimately leading to a decrease in the deposition of Mn and Co.
The relationship between electrochemical reactivity and morphology and structure of microspheres
SECM is a high spatial resolution method for the micro-area on the electrode. It can directly obtain surface electrochemical reactivity information associated with localized morphology. Under the feedback mode of SECM, the probe is maintained at a constant height. In a solution of 10 mmol L−1 K3[Fe(CN)6] and 0.1 mol L−1 KCl, the constant-height surface scanning of the two electrodes is conducted when the probe is maintained at 0.05 V (vs. Ag/AgCl) and the substrate potential is open-circuit potential. Fig. 3 presents constant-height surface scanning of the two electrodes at the open-circuit potential on an 80 μm × 80 μm scale, the UME tip is 3 μm away from the substrate. All tip currents are normalized with iT,∞, the correspondence relationship between the normalized currents and colors of all graphics uses the scale on the right. As shown in Fig. 3, every point on the constant-height surface scanning shows positive feedback (which enhances the oxidation of [Fe(CN)6]4−). The probe current detected during the scanning is proportional to the oxidation capacity of the corresponding micro-area on the substrate. Therefore, the high-reactivity area with a higher current is the red area and the low-reactivity area with a lower current is blue. As the feedback current is a function of the probe-substrate distance, the higher position corresponds to the higher current (red area) and the lower position corresponds to the lower current (blue area).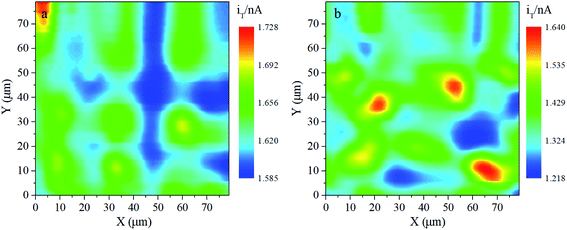 | ||
| Fig. 3 SECM map of the 80 μm × 80 μm constant-height surface at the open circuit potential of (a) the PbO2–Co3O4–MnO2 electrode and (b) the traditional PbO2 electrode, d = 3 μm. | ||
Fig. 3a shows that the active area of the PbO2–Co3O4–MnO2 electrode is spherical, highly coinciding with the sizes, shapes, and distribution of the PbO2–Co3O4–MnO2 morphology observed by SEM. What is striking about the constant-height scanning image of the PbO2–Co3O4–MnO2 electrode is that electrochemical reactivity on the spherical center is higher than on the edge around the circle, and the active area of the electrode as a whole is evenly distributed. In contrast, the active region of the traditional PbO2 electrode shown in Fig. 3b is not uniformly distributed. Also, judging from the normalized currents, the electrochemical reactivity of the modified electrode is higher than that of the traditional PbO2 electrode. Several factors are known to be responsible for this improvement. After the correction of the PbO2–Co3O4–MnO2 electrode due to the addition of two elements, the grain shape changes significantly, the grain size decreases, and the degree of tightness between the grains increases after the addition of two elements, thereby reducing the variation between the high and low active areas and distributing active points on the electrode surface in a uniform way.
Since the probe tip current is normalized, the currents in the two pictures are comparable. The probe current of the modified electrode is significantly higher than the traditional PbO2 electrode. SECM results demonstrate that the electrocatalytic reactivity of the PbO2–Co3O4–MnO2 electrode is elevated. Evidently, the transformation of the morphology contributes to this enhancement. Due to the doping of Co and Mn elements, the preferred growth orientation of the PbO2 changes, and the grains are refined into a spherical shape. With the specific surface area of the electrode increasing, more active area is fully exposed to the electrolyte for the electrochemical reaction, providing more positions for electron transfer. The presented evidence supports the idea that the catalytic performance of the PbO2–Co3O4–MnO2 electrode is closely related to the topography of the electrode surface.28,29
Probe current curves (red lines) produced by the tip scanning a certain distance over the surface of the two electrodes are displayed on the top half of Fig. 4. What stands out in this chart is the pattern of the curve. Due to the messy topography of the traditional PbO2 electrode, electrochemical reactivity of the traditional PbO2 electrode is unevenly distributed. Regarding the modified PbO2 electrode, the shape is transformed into a uniform spherical shape and thus the active area is evenly distributed and the gap of electrochemical reactivity among different points narrows. These results further support the hypothesis that the electrochemical reactivity of the PbO2–Co3O4–MnO2 electrode has a remarkable correlation with the morphology, and the electrochemical reactivity of the modified electrode is enhanced by the refinement of the microscopic structure.
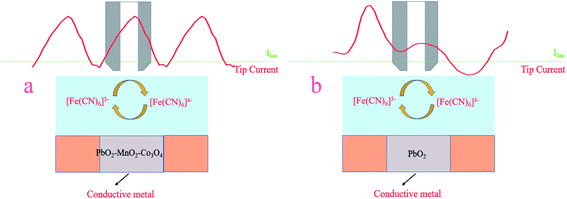 | ||
| Fig. 4 The positive feedback response curve of the probe current at open circuit potential for (a) the PbO2–Co3O4–MnO2 electrode and (b) traditional PbO2 electrode. | ||
The grain structural information of the samples was revealed by XRD. The XRD patterns of the traditional PbO2 electrode and PbO2–Co3O4–MnO2 electrode are shown in Fig. 5. In Fig. 5a, the peaks of two electrodes are strong at 25.4°, 31.9°, 36.2°, 49.4°, and 62.5°, which could be ascribed to β-PbO2(PDF#41-1492). The results illustrate that these two electrodes mainly consist of β-PbO2. Besides, it can be seen that the diffraction peak intensity and half-width of the peaks from the two electrodes are significantly different. The diffraction peak intensity of the modified electrode is weaker than that of the traditional PbO2 electrode, indicating that the preferred crystal orientation of the β-PbO2 was converted because of the ion-doped modification. In addition, the half-peak width of the modified electrode is larger than that of the traditional PbO2 electrode. According to the Debye–Scherrer formula,
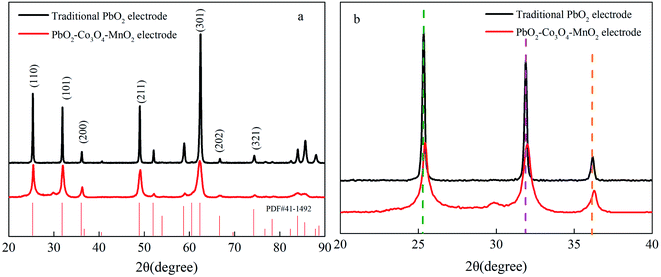 | ||
| Fig. 5 (a) XRD patterns of the PbO2 electrode (black) and PbO2–Co3O4–MnO2 electrode (red). (b) Local magnified XRD patterns of the 20°–40°. | ||
Fig. 5b is an amplified XRD image of 20°–40°. It shows that the (101), (110), and (200) crystal planes in the PbO2–Co3O4–MnO2 electrode shift into higher diffraction angles, this is because the Co and Mn element doped into the PbO2 unit cell have smaller radii than the Pb element, causing the diffraction peaks of the doped modified electrode to shift to a larger angle. The unit cell parameters and unit cell volume are correspondingly reduced (as shown in Table 1). The smaller size of the crystals after doping Co and Mn into the PbO2 lattice meant more point defects formed within the PbO2 lattice, which also shows that the concentration of surface oxygen vacancies is greater than that of traditional PbO2.30 Both Co and Mn oxides are rich in oxygen vacancies.31 Under the influence of the two elements, the diffraction peak intensity of the modified electrode is lower than that of the traditional PbO2 electrode and the growth of each crystal plane is inhibited, reshaping the preferred growth orientation of the grains.
| Electrode | A (Å) | B (Å) | C (Å) | V | Crystallite-size/nm |
|---|---|---|---|---|---|
| PbO2 | 4.958 | 4.958 | 3.394 | 83.450 | 15.68 |
| PbO2–Co3O4–MnO2 | 4.952 | 4.952 | 3.380 | 82.900 | 10.45 |
In summary, after the addition of more conductive particles into the PbO2 electrode, the added particles will not only undergo electrochemical oxidation but will also replace the preferential growth sites, causing the surface morphology of the electrode material to change. The addition of Co and Mn changes the micro-morphology of the original PbO2 electrode, which not only increases the specific surface area of the electrode material but also reduces the grain spacing on the surface of the electrode material. The greater the number of atoms exposed to the electrolyte, the more active sites there are on the electrode surface and the better the catalytic reactivity.32
The relationship between the electrochemical reactivity of the electrodes and the electrodes' physicochemical properties
The current response of the SECM constant-height surface scanning mainly depends on the micro-topography, conductivity, and electrochemical reactivity of the substrate. The advantage of PAC is that it can interpret localized electrochemical reactivity without any influence from the micro-topography of the substrate. Therefore, the positive feedback mode of SECM is adopted to study the variation in the electrochemical reactivity of the substrate under different potentials. The feedback current at the probe is determined by the localized intrinsic physicochemical properties of the substrate and can reflect the difference in the reactivity of the substrate surface. With a tiny distance between the probe and the substrate, mass transfer can take place in a rapid way. Being immune to the influence of concentration polarization is the theoretical basis for the SECM to quickly determine the electron transfer reaction. When the electron transfer step is treated as a speed control step, the change in substrate potential directly affects the speed of the electron transfer step on the substrate and the entire electrode reaction process. The obtained PAC is subjected to nonlinear fitting to compute a heterogeneous reaction rate constant. This rate constant can adequately mirror the conductivity and electrochemical reactivity of the substrate surface.33–35Basing on the theoretical model established by Lefrou,36 the nonlinear fitting eqn (5) (ESI†) is used to achieve the best fit between the theoretical PAC and the experimental PAC, and the normalized abscissa is used. The calculation of the theoretical calculation of the SECM tip approach curves can be found in the ESI.† Fig. 6 shows the probe approach curves fitting diagrams of points A and B on the two substrate electrodes with different potentials. The two points A and B are active sites on the two electrodes, respectively. The black curve in the figure is the initial experimental data and the red dotted line is the probe fitting. The theoretical approximation curve, in all cases, fits the experimental data very well. The heterogeneous charge transfer rate constant k of the regeneration process of the electrochemically active medium is obtained. It can be seen from Table 2 that with the substrate potential becoming more positive, the k value gradually increases, suggesting that the electron transfer on the surface becomes easier and the reactivity of active regions of the two electrodes increases. Accordingly, the rate of the Fe2+ oxidation reaction on the substrate speeds up and thus a large amount of Fe3+ diffuses to the UME surface. As the concentration of the redox medium rises, the reduction current detected by the probe increases.
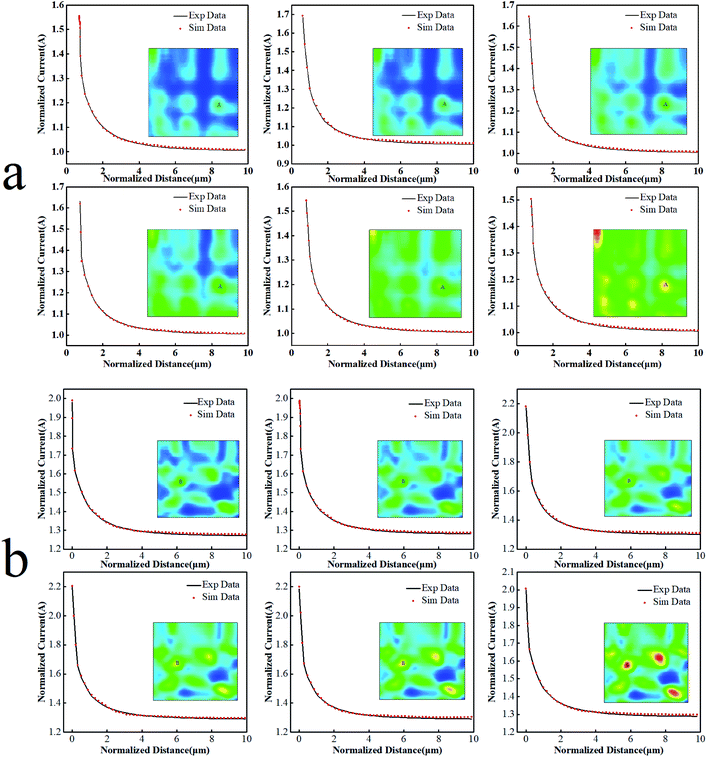 | ||
| Fig. 6 The UME probe approach curve with (a) the PbO2–Co3O4–MnO2 electrode and (b) the traditional PbO2 electrode, Et = 0.05 V, Es = 0.1–1.0 V, increment distance = 1 μm, quiet time = 60 s. | ||
| Electrode | 0.1 V | 0.3 V | 0.5 V | 0.7 V | 0.9 V | 1.0 V |
|---|---|---|---|---|---|---|
| PbO2–Co3O4–MnO2 | 8.387 | 8.658 | 8.701 | 9.099 | 9.757 | 10.364 |
| PbO2 | 2.574 | 2.608 | 2.657 | 3.077 | 3.115 | 3.135 |
Whether it is a traditional PbO2 electrode or a modified PbO2 electrode, the charge transfer rate constant of both increases with the increase in the potential, as does the reactivity of the active site. Under the same potential, the heterogeneous charge transfer rate constant of the modified electrode is about 3 times higher than that of the traditional electrode. It is indicated that the electrochemical reactivity of the modified electrode is enhanced due to the change of its physical and chemical properties.
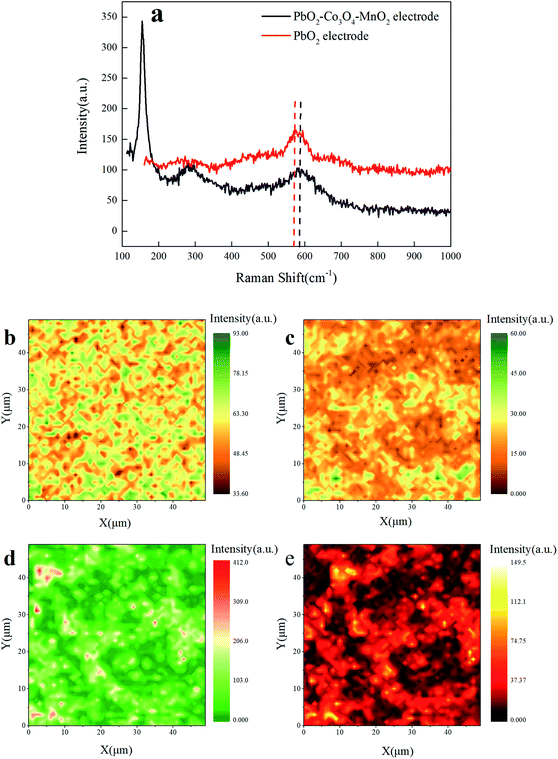
As discussed above, the alteration of physicochemical properties gives rise to the enhancement of electrochemical reactivity on the PbO2–Co3O4–MnO2 electrode unveiled by the PAC experiments. To further clarify the alteration of the physicochemical properties, Raman microscopy was utilized to identify the mechanism of doped elements by capturing their Raman intensity. Fig. 7a illustrates that the peak at 576 cm−1 is attributed to the Raman active vibrational mode of Pb–O in PbO2.37 After doping with Co and Mn elements, a new band emerges at 143 cm−1, which is attributed to the F2g mode of Co–O;38 the weak peak at 274 cm−1 is assigned to the band of Mn–O.39 It shows that Mn and Co were successfully deposited into the modified electrode. It also can be observed that the main band position at 591 cm−1 of the modified electrode is blue-shifted relative to the main peak position of the traditional PbO2 electrode and the intensity of the Raman spectrum is weakened and the width becomes wider, indicating that Co and Mn are successfully doped into the electrode and part of it enters the PbO2 lattice. Meanwhile, the number of oxygen vacancies on the surface of the modified electrode increases40 and the electrochemical reactivity is enhanced, which is consistent with the results of XRD.
Using the above spectrum as a reference, information about the distribution of the electrode component can be obtained. Fig. 7b is the Raman microscopy image of the main band position of the PbO2 electrode. In Fig. 7b, the shape of the green region with high Raman intensity is similar to the rutile structure of PbO2 and the Raman intensity distribution is consistent with the electrochemical reactivity distribution (Fig. 3b). Fig. 7c–e are the Raman mapping scanning images of the modified electrode conducted at 591 cm−1, 143 cm−1, and 274 cm−1, respectively. It can be seen from the figures that the addition of Co and Mn elements makes the Raman intensity and distribution of Pb in the modified electrode significantly different. Fig. 7d and e are the Raman mapping scanning images under the characteristic band of the Co and Mn elements. The Raman intensity is high in the middle and low on the edge, roughly coinciding with the electrochemical reactivity distribution of the PbO2–Co3O4–MnO2 electrode (Fig. 3a). These results confirm the association between the doping of Co and Mn elements and the transformation of the microscopic morphology which offers more active electrochemical reaction sites. This also accords with our earlier observations on SECM.
Coupled with the Raman spectra results, the second reason for the enhancement of electrochemical reactivity is increasing the number of surface oxygen vacancies which results from the entrance of Co and Mn elements into the PbO2 lattice. Namely, it adequately explains how the physicochemical properties change, making conclusions from PAC more insightful and comprehensive.
XPS is an analysis technique for the active components of electrode. It can study the relationship between the composition and performance of the active phase and infer the reaction mechanism. X-ray photoelectron spectroscopy (XPS) was carried out to study the compositions and redox behavior of two electrodes. The full spectrum of the two electrodes (Fig. S3 and S4†) can be found in the ESI.† Fig. 8a and b illustrates the Pb 4f and O 1s XPS spectra of traditional PbO2. As can be seen from Fig. 8a, the binding energy of Pb 4f is 136.96 eV, 137.91 eV, 141.79 eV, and 142.61 eV, respectively, a 4.7 eV and 4.83 eV energy variation between the Pb 4f7/2 and Pb 4f5/2 peaks is observed, evidencing the existence of PbO2 in the traditional electrode.41 The O 1s species in the high-resolution XPS spectra (Fig. 8b) revealed signals at 529.24 eV and 530.62 eV, corresponding to surface lattice oxygen (Olatt) and surface adsorption oxygen (Oads).42
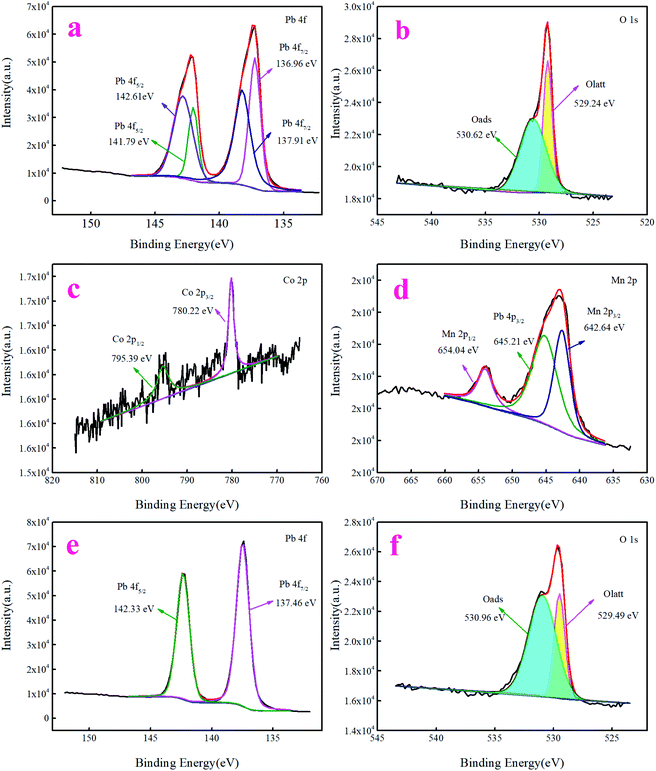 | ||
| Fig. 8 XPS spectrum and fitted data of (a) Pb 4f, (b) O 1s of the as-obtained PbO2 electrode and (c) Co 2p, (d) Mn 2p, (e) Pb 4f, and (f) O 1s of the as-obtained PbO2–Co3O4–MnO2 electrode. | ||
For the modified electrode, the Co 2p XPS spectra (Fig. 8c) show two major peaks at 780.22 eV and 795.39 eV, which are ascribed to the typical Co 2p3/2 and Co 2p1/2 orbitals, respectively. A 15 eV energy variation between the Co 2p3/2 and Co 2p1/2 peaks is observed, evidencing the existence of Co3O4 in the modified electrode.43,44 From Fig. 8d, one can observe the appearance of two signals at BE = 642.64 eV and 654.04 eV, assignable to Mn 2p3/2 and Mn 2p1/2, respectively, and the interval between the two peaks is 11.4 eV, which indicates that the oxidation state of Mn in the modified electrode is MnO2 (ref. 45) because the binding energy in the figure is 645.21 eV, which is Pb 4p. Since the binding energy of the stronger Pb 4p peak, Pb 4p3/2 is similar to that of the O 1s peak, the two peaks coincide and need to be fitted. The Pb 4f XPS spectra (Fig. 8e) for the modified electrode exhibited two well-defined, symmetric peaks centered at 137.46 eV and 142.33 eV, corresponding to 4f7/2 and 4f5/2, respectively, which are consistent with the spectral values for PbO2.41,46 As can be seen from the O 1s spectrum (Fig. 8f), two peaks centered at 529.49 eV and 530.96 eV arise from lattice oxygen (Olatt) and adsorbed oxygen (Oads).42,47
The changes in oxygen species surface coverage and binding strength cause the change of the electrochemical reactivity of the modified electrode. To determine the existence of oxygen on the electrode surface and quantitatively calculate the relationship between oxygen species on the surface and doping elements, the peak separation fitting results of the O 1s spectrum peaks of the two electrodes are listed in Table 3. The redox performance of the electrocatalytic materials mainly depends on the activation of molecular oxygen and the type of surface or lattice oxygen.48 For an oxygen-deficient material, the adsorbed oxygen species on the surface of the PbO2 electrode is considered to be more active and more important for the oxidation reaction. Typically, lattice oxygen species are involved in selective oxidation reactions, while adsorbent oxygen species such as O2−, O22−, and O− are given priority in the process of complete oxidation.49 Therefore, in the catalytic process, adsorbed oxygen is the most active oxygen species. Moreover, the concentration of adsorbed oxygen is closely related to the number of oxygen vacancies and the ratio of Oads/Olatt can be used to illustrate the relative abundance of oxygen vacancies on the electrode material surface. Therefore, compared to the undoped PbO2 electrode, it was found that the adsorbed oxygen content of the modified electrode is higher than that of the traditional PbO2 electrode and the Oads/Olatt value of the modified doped electrode is greater than that of the traditional PbO2 electrode, which means that there is more active oxygen on the surface of the doped modified electrode. The species and the number of oxygen vacancies also increased correspondingly, indicating that the doped modified electrode materials have better electrochemical reactivity. The results discussed above show that the role of the doping element is to change the surface properties of PbO2.
| Electrode | Crystallite-size/nm | Binding energy/eV | Oads/Olatt (atom%) | Oads (content%) | Olatt (content%) | |
|---|---|---|---|---|---|---|
| O 1s (Oads) | O 1s (Olatt) | |||||
| PbO2 | 15.68 | 530.62 | 529.25 | 1.06 | 51.46 | 48.54 |
| PbO2–Co3O4–MnO2 | 10.45 | 530.96 | 529.49 | 2.31 | 69.79 | 30.21 |
In addition, previous studies on doping WC particles50 and CNTs51 concluded that improvement of the electrodes is driven by their good electrical conductivity and fast electron transfer. These doping substances present on the electrodes in a way of physical combination and then enhance the electrochemical reactivity. Concerning the PbO2–Co3O4–MnO2 electrode, some Co and Mn ions have intruded into the PbO2 lattice. Hence, more oxygen vacancies are successfully introduced into the doped modified electrode. This conclusion has been verified through XRD, Raman, and XPS. In other words, the promotion of the PbO2–Co3O4–MnO2 electrode does not rely on the formation of Co and Mn oxides. The oxides do not directly participate in the electrocatalytic reaction. In a word, the transformation of the microscopic morphology and increasing of oxygen vacancies are important driving factors of enhancement of electrochemical reactivity on the PbO2–Co3O4–MnO2 electrode.
4. Conclusions
This paper proposes that the performance improvement of the doped modified electrode is due to the change of the microscopic morphology of the modified electrode and the increase of the oxygen vacancy concentration on the electrode surface.The feedback mode of SECM successfully observed the electrochemical reactivity distribution of the PbO2–Co3O4–MnO2 electrode and the traditional PbO2 electrode and concluded that the electrochemical reactivity of the modified electrode was higher than that of the traditional PbO2 electrode. Combined with SEM, the shape of the electrochemically active region is consistent with the micro-topography structure. Through XRD, the microscopic morphology and structure of the modified electrode are observed to have changed due to the doping of Co and Mn elements. In addition, comparing the SECM constant height surface scan with the Raman surface scan can conclude that the electrochemical reactivity distribution is related to the morphology of the substrate. The active area of the modified electrode is distributed in a circular shape, while the traditional PbO2 electrode presents a pyramid shape. In summary, the performance improvement of the modified electrode is partly due to the change of the micromorphology.
For another thing, the nonlinear fitting of the PACs quantitatively analyzes the localized reactivity of the two electrode surfaces. The heterogeneous reaction rate constant of the modified electrode is about 3 times higher than that of the traditional PbO2 electrode. Finally, combining the XPS and Raman results, the increase in the k of the modified electrode stems from the increase in the concentration of surface oxygen vacancies, it is these oxygen vacancies serving as active sites that give a boost to the electrochemical reactivity of the modified electrode. In contrast to the mechanism of doping WC particles and CNTs, the promotion of the PbO2–Co3O4–MnO2 electrode does not rely on the formation of Co and Mn oxides and they do not directly participate in the electrocatalytic reaction. It is believed that this investigation provides a new micro perspective on the causality toward electrochemical reactivity improvement of PbO2–Co3O4–MnO2 electrodes and provides a new platform for the study of the structure–reactivity relationship of the electrode surface, which can be readily extended to many electrochemical processes of other electrode materials.
Conflicts of interest
There are no conflicts to declare.Acknowledgements
This work was financially supported by the National Natural Science Foundation of China (No. 51464021).Notes and references
- Y. Zhou, Z. Li, C. Hao, Y. Zhang, S. Chai, G. Han, H. Xu, J. Lu, Y. Dang, X. Sun and Y. Fu, Electrochim. Acta, 2020, 333, 135535–135547 CrossRef CAS.
- Z. Souri, A. Ansari, D. Nematollahi and M. Mazloum-Ardakani, J. Electroanal. Chem., 2020, 862, 114037–114052 CrossRef CAS.
- X. Wang, R. Xu, S. Feng, B. Yu and B. Chen, RSC Adv., 2020, 10, 1351–1360 RSC.
- C. Chen, X. Wang, R. Xu, Y. Zhang, S. Feng, A. Ju and W. Jiang, RSC Adv., 2021, 11, 6146–6158 RSC.
- L. Gui, Z. Chen, B. Chen, Y. Song, Q. Yu, W. Zhu, Q. Hu, Y. Liu, Z. Zheng, L. Ze, H. You and F. Yeasmin, J. Hazard. Mater., 2020, 399, 123018–123033 CrossRef CAS PubMed.
- N. Comisso, S. Cattarin, P. Guerriero, L. Mattarozzi, M. Musiani and E. Verlato, Electrochim. Acta, 2016, 200, 259–267 CrossRef CAS.
- S. Abaci, U. Tamer, K. Pekmez and A. Yildiz, Appl. Surf. Sci., 2005, 240, 112–119 CrossRef CAS.
- S. Ghasemi, M. F. Mousavi, H. Karami, M. Shamsipur and S. H. Kazemi, Electrochim. Acta, 2006, 52, 1596–1602 CrossRef CAS.
- D. Pech, T. Brousse, D. Bélanger and D. Guay, Electrochim. Acta, 2009, 54, 7382–7388 CrossRef CAS.
- Z. Wang, Y. Liu and V. M. Linkov, J. Power Sources, 2006, 160, 326–333 CrossRef CAS.
- Z. Li, Y. Yang, A. Relefors, X. Kong, G. M. Siso, B. Wickman, Y. Kiros and I. L. Soroka, J. Colloid Interface Sci., 2021, 583, 71–79 CrossRef CAS PubMed.
- C. G. Zoski, B. Liu and A. J. Bard, Anal. Chem., 2004, 76, 3646–3654 CrossRef CAS PubMed.
- D. S. A. Yin Jing, S. Mehraeen, R. J. LeSuer and B. P. Chaplin, J. Mater. Chem. A, 2018, 6, 23828–23839 RSC.
- X. Zeng, D. Liu, S. Wang, S. Liu, X. Cai, L. Zhang, R. Zhao, B. Li and F. Kang, ACS Appl. Mater. Interfaces, 2020, 12, 37047–37053 CrossRef CAS PubMed.
- I. Morkvenaite-Vilkonciene, A. Ramanaviciene and A. Ramanavicius, RSC Adv., 2014, 4, 50064–50069 RSC.
- D. Zigah, J. Rodriguez-Lopez and A. J. Bard, Phys. Chem. Chem. Phys., 2012, 14, 12764–12772 RSC.
- L. Danis, S. M. Gateman, C. Kuss, S. B. Schougaard and J. Mauzeroll, ChemElectroChem, 2017, 4, 6–19 CrossRef CAS.
- A. J. Bard, F. R. Fan, D. T. Pierce, P. R. Unwin, D. O. Wipf and F. Zhou, Science, 1991, 254, 68–74 CrossRef CAS PubMed.
- H. Luo, C. Dong, S. Gao, C. Du, K. Xiao and X. Li, RSC Adv., 2014, 4, 56582–56595 RSC.
- Y. Wang and D. O. Wipf, J. Electrochem. Soc., 2020, 167, 146502–146511 CrossRef CAS.
- Y. Huai, Y. Qian and Y. Peng, Appl. Surf. Sci., 2020, 531, 147334–147342 CrossRef CAS.
- Y. Meng, J. Chen and K. Liang, Anal. Chem., 2020, 92, 10420–10424 CrossRef CAS PubMed.
- Z. Zheng, Q. Yu, Z. Chen, W. Zhu, Q. Hu, Y. Liu, L. Gui and Y. Song, J. Electroanal. Chem., 2020, 878, 114699–114707 CrossRef CAS.
- Y. Liu, W. Zhu, Z. Chen, Q. Yu, Q. Hu, Z. Zheng, L. Gui and Y. Song, Int. J. Hydrogen Energy, 2021, 46, 6380–6394 CrossRef CAS.
- A. B. Velichenko, R. Amadelli, E. A. Baranova, D. V. Girenko and F. I. Danilov, J. Electroanal. Chem., 2002, 527, 56–64 CrossRef CAS.
- Y. Yao, C. Huang, H. Dong, F. Wei and X. Chen, Russ. J. Electrochem., 2019, 55, 364–369 CrossRef CAS.
- A. B. Velichenko, E. A. Baranova, D. V. Girenko, R. Amadelli, S. V. Kovalev and F. I. Danilov, Russ. J. Electrochem., 2003, 39, 615–621 CrossRef CAS.
- J. González-Prior, R. López-Fonseca, J. I. Gutiérrez-Ortiz and B. de Rivas, Appl. Catal., B, 2016, 199, 384–393 CrossRef.
- Z. Chen, S. Wang, W. Liu, X. Gao, D. Gao, M. Wang and S. Wang, Appl. Catal., A, 2016, 525, 94–102 CrossRef CAS.
- Q. Ma, Z. Chen, S. Zhong, J. Meng, F. Lai, Z. Li, C. Cheng, L. Zhang and T. Liu, Nano Energy, 2021, 81, 105622–105633 CrossRef CAS.
- Z. Han, Y. Liu, J. Deng, S. Xie, X. Zhao, J. Yang, K. Zhang and H. Dai, Catal. Today, 2019, 327, 246–253 CrossRef CAS.
- W. J. Xue, Y. F. Wang, P. Li, Z.-T. Liu, Z. P. Hao and C. Y. Ma, Catal. Commun., 2011, 12, 1265–1268 CrossRef CAS.
- S. E. Pust, D. Scharnweber, C. Nunes Kirchner and G. Wittstock, Adv. Mater., 2007, 19, 878–882 CrossRef CAS.
- S. E. Pust, D. Scharnweber, S. Baunack and G. Wittstock, J. Electrochem. Soc., 2007, 154, C508–C514 CrossRef CAS.
- A. Maho, F. Kanoufi, C. Combellas, J. Delhalle and Z. Mekhalif, Electrochim. Acta, 2014, 116, 78–88 CrossRef CAS.
- C. Lefrou, J. Electroanal. Chem., 2006, 592, 103–112 CrossRef CAS.
- H.-W. Yeh, C.-J. Chang, G. G. Huang and P.-Y. Chen, J. Electroanal. Chem., 2019, 834, 64–70 CrossRef CAS.
- L. Ma, S. Chen, H. Li, Z. Ruan, Z. Tang, Z. Liu, Z. Wang, Y. Huang, Z. Pei, J. A. Zapien and C. Zhi, Energy Environ. Sci., 2018, 11, 2521–2530 RSC.
- T. Gao, M. Glerup, F. Krumeich, R. Nesper, H. Fjellvag and P. Norby, J. Phys. Chem. C, 2008, 112, 13134–13140 CrossRef CAS.
- Y. C. Huang, B. Long, M. N. Tang, Z. B. Rui, M. S. Balogun, Y. X. Tong and H. B. Ji, Appl. Catal., B, 2016, 181, 779–787 CrossRef CAS.
- J. Morales, G. Petkova, M. Cruz and A. Caballero, J. Power Sources, 2006, 158, 831–836 CrossRef CAS.
- Y. Xia, X. Bian, Y. Xia, W. Zhou, L. Wang, S. Fan, P. Xiong, T. Zhan, Q. Dai and J. Chen, Sep. Purif. Technol., 2020, 237, 116321–116328 CrossRef CAS.
- K. Xiang, Z. Xu, T. Qu, Z. Tian, Y. Zhang, Y. Wang, M. Xie, X. Guo, W. Ding and X. Guo, Chem. Commun., 2017, 53, 12410–12413 RSC.
- C. Mahala, M. D. Sharma and M. Basu, New J. Chem., 2019, 43, 15768–15776 RSC.
- E. Hastuti, A. Subhan, P. Amonpattaratkit, M. Zainuri and S. Suasmoro, RSC Adv., 2021, 11, 7808–7823 RSC.
- K. Kannan, G. Muthuraman and I. S. Moon, Mater. Lett., 2014, 123, 19–22 CrossRef CAS.
- S. H. Xie, Y. X. Liu, J. G. Deng, J. Yang, X. T. Zhao, Z. Han, K. F. Zhang and H. X. Dai, J. Catal., 2017, 352, 282–292 CrossRef CAS.
- Y. Li and W. Shen, Chem. Soc. Rev., 2014, 43, 1543–1574 RSC.
- A. Amri, X. Duan, C.-Y. Yin, Z.-T. Jiang, M. M. Rahman and T. Pryor, Appl. Surf. Sci., 2013, 275, 127–135 CrossRef CAS.
- Y.-Y. Ma, Z.-L. Lang, L.-K. Yan, Y.-H. Wang, H.-Q. Tan, K. Feng, Y.-J. Xia, J. Zhong, Y. Liu, Z.-H. Kang and Y.-G. Li, Energy Environ. Sci., 2018, 11, 2114–2123 RSC.
- Y. Xia, J. Feng, S. Fan, W. Zhou and Q. Dai, Chemosphere, 2021, 263, 128069–128078 CrossRef CAS.
Footnote |
| † Electronic supplementary information (ESI) available. See DOI: 10.1039/d1ra04006e |
| This journal is © The Royal Society of Chemistry 2021 |

