 Open Access Article
Rapid SERS identification of methicillin-susceptible and methicillin-resistant Staphylococcus aureus via aptamer recognition and deep learning†
Shu Wangab,
Hao Dongab,
Wanzhu Shend,
Yong Yangab,
Zhigang Lia,
Yong Liuab,
Chongwen Wang *d,
Bing Gu*c and
Long Zhang*ab
aHefei Institute of Physical Science, Chinese Academy of Sciences, Hefei 230036, P. R China. E-mail: zhanglong@aiofm.ac.cn
bUniversity of Science and Technology of China, Hefei 230036, P. R China
cLaboratory Medicine, Guangdong Provincial People's Hospital, Guangdong Academy of Medical Sciences, Guangzhou 510000, P. R China. E-mail: gb20031129@163.com
dAnhui Agricultural University, Hefei 230036, P. R China. E-mail: wangchongwen1987@126.com
First published on 25th October 2021
Abstract
Here, we report a label-free surface-enhanced Raman scattering (SERS) method for the rapid and accurate identification of methicillin-susceptible Staphylococcus aureus (MSSA) and methicillin-resistant Staphylococcus aureus (MRSA) based on aptamer-guided AgNP enhancement and convolutional neural network (CNN) classification. Sixty clinical isolates of Staphylococcus aureus (S. aureus), comprising 30 strains of MSSA and 30 strains of MRSA were used to build the CNN classification model. The developed method exhibited 100% identification accuracy for MSSA and MRSA, and is thus a promising tool for the rapid detection of drug-sensitive and drug-resistant bacterial strains.
Staphylococcus aureus (S. aureus) is one of the most important foodborne and iatrogenic bacteria and causes various dangerous diseases, such as sepsis, meningitis, pneumonia, and food poisoning.1–3 In addition, antibiotic-susceptible S. aureus can acquire an antibiotic resistance gene from the coagulase-negative S. aureus and is resistant to beta-lactam antibiotics (e.g., methicillin and penicillin).4 Methicillin-resistant S. aureus (MRSA) can generate four times higher mortality rates than methicillin-susceptible S. aureus (MSSA).5,6 The timely and accurate identification of MRSA and MSSA is important to guide the rational use of antibiotics, reduce the spread of infection, and improve survival rates. The currently used methods for the detection and antibiotic susceptibility test of S. aureus are traditional plate culturing, polymerase chain reaction (PCR), mass spectrometry, and DNA sequencing and have several drawbacks in terms of detecting speed and cost.7–9 For example, the plate culturing method for the identification of MRSA is relatively complex and requires 24–72 h for results. PCR is a powerful tool that allows the ultrasensitive testing of pathogens but suffers from laborious sample pretreatments, including cell lysis, DNA extraction, and predesigned primers. Mass spectrometry and DNA sequencing are accurate molecular diagnostic technologies but require tedious procedures, expensive equipment, and skilled personnel, thereby limiting their application in low resource situation. A rapid and simple method for the accurate identification of MRSA is highly demanded. In recent years, surface-enhanced Raman scattering (SERS) has attracted much attention for bacteria label-free detection via the “whole-organism fingerprinting” assessment.10–12 The active substrates of SERS (e.g., Ag and Au materials) can directly amplify the intrinsic vibrational fingerprint of bacteria when the bacterial cell is near the surface of these materials.13,14 Thus, the SERS-based bacterial analysis has many advantages, including rapid test, easy handling, nondestructive data acquisition, and fingerprint detection. In addition, the special SERS fingerprint signals for bacteria can be rapidly analyzed via many chemometrics methods, such as principal component analysis (PCA), linear discriminant analysis (LDA), support vector machine (SVM), and deep learning.15–17 In the last two years, the convolutional neural network (CNN) in deep learning has shown its superior performance for the spectral classification task with multispecies and high similarity and is successfully applied on the analysis of bacterial spectra. For example, Fu's group used CNN to classify 14 kinds of microorganisms from Raman spectra and achieved average accuracies exceeding 95%.18 Thus, the integration of label-free SERS detection and CNN has remarkable potential for the accurate and rapid identification of pathogens. A big obstacle remains in the practical application of bacterial label-free SERS detection because common active substrates of SERS lack selectivity and anti-interference ability and are difficult to apply to the sample with multiple bacteria.19–21 Eliminating the impurity signal of the actual sample (nontarget bacteria) and obtaining a high-quality SERS signal of target bacteria are keys to achieve the practical application of SERS label-free detection. In 2017, Xia's group reported a nucleic acid aptamer-based AgNP synthesis method for the label-free SERS detection of specific pathogens.22 Aptamer is a single-stranded DNA or RNA molecule that can bind to its target with high specificity and affinity.23 Bacterial aptamers are used as biorecognition molecules to bind target bacteria and as templates to guide the follow-up AgNP synthesis in situ. Thus, bacterial aptamers can acquire high-quality SERS spectra for target bacteria. However, the aptamer-based method lacks the capacity to distinguish drug-sensitive and drug-resistant bacterial strains accurately. In this work, we propose a rapid label-free SERS method for the accurate identification of MSSA and MRSA on the basis of the combination of aptamer-guided AgNP synthesis and CNN recognition. The specific and high-quality SERS spectra of MSSA and MRSA are enhanced with the formation of S. aureus–aptamer@Ag complexes. A shallow CNN model with two convolution layers and one fully connected layer are constructed and trained on the prepared SERS data set of MRSA and MSSA. Only S. aureus can generate the fingerprint SERS spectrum via this method, and the obtained SERS signals are input into the established high-performance binary classification model to determine MSSA and MRSA accurately.
Fig. 1 illustrates the operating principle of the rapid identification of MSSA/MRSA based on the combination of aptamer-guided SERS detection and CNN classification. First, a bacterial colony was obtained from blood plate, resuspended in 100 μL PBS buffer (0.1 mM, pH 7.4), and incubated with the aptamer for S. aureus (aptamerS). If the picked bacteria was S. aureus, many aptamers could rapidly and specifically bind to the surface of the target bacteria during the process. Bacterial cells were centrifuged at 4000 rpm for 4 min to remove the excess aptamer and then resuspended in 100 μL AgNO3 solution (10 mM). In this process, the surface-bound aptamers could adsorb Ag ions onto the phosphodiester groups of nucleotides efficiently. When NaBH4 solution was added, dense AgNPs quickly coated the S. aureus surface by the in situ reduction of Ag ions onto aptamers, and S. aureus–aptamer@Ag complexes could be collected by centrifugation. S. aureus–aptamer@Ag complexes were resuspended in 10 μL ethanol and dropped on a clean Si chip for SERS. The SERS spectra could only be acquired with the existence of aptamer-bound bacteria, thereby achieving label-free detection of S. aureus through this strategy. Finally, the obtained SERS spectra were analyzed using the CNN method to achieve the rapid and accurate identification of MSSA and MRSA. The detailed detection processes were shown in ESI S1.†
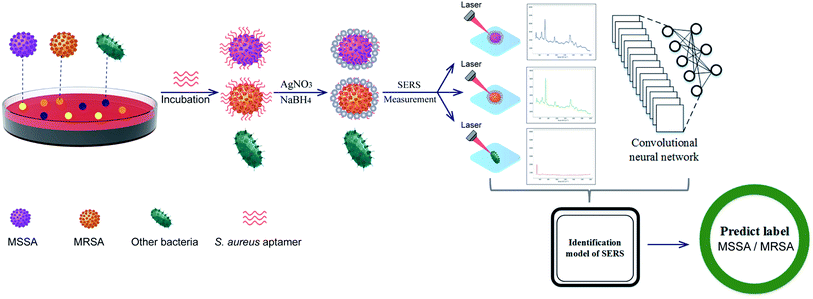 | ||
| Fig. 1 Schematic of the rapid label-free SERS detection of MSSA and MRSA based on aptamer-guided Ag NP formation and CNN classification. | ||
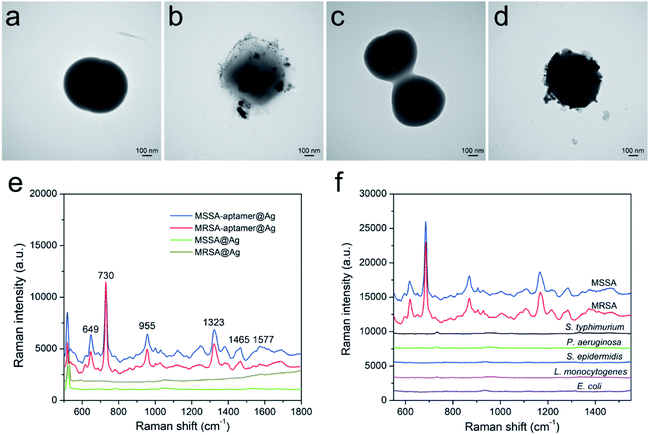
In this study, a widely used S. aureus aptamer was chosen because it could specifically bind to the whole S. aureus cell with high affinity.24,25 Theoretically, one bacterial cell can bind many aptamer molecules, and these negatively charged aptamers can easily adsorb Ag+ as nucleation sites for further AgNP synthesis. Although most bacteria (including S. aureus) are negatively charged in the aqueous solution over a wide pH range (pH 5–9), the in situ AgNP synthesis onto the bacterial surface is difficult. As revealed in the transmission electron microscopy (TEM) images in Fig. 2, no typical AgNP can be formed onto bare MSSA and MRSA cells without aptamer adding (Fig. 2a and c), whereas abundant AgNPs are synthesized around the surface of MSSA and MRSA with aptamer guidance (Fig. 2b and d). The UV-vis spectra in Fig. S1 (ESI†) display no evident absorbance peak from the aptamer-modified S. aureus. The MSSA–aptamer@Ag and MRSA–aptamer@Ag complexes exhibit a strong absorption peak at 390 nm, suggesting that many monodispersed AgNPs coat the bacteria. Compared with the UV-vis spectra peak (∼420 nm) of colloidal AgNPs, the maximum of the absorption band of S. aureus–aptamer@Ag complexes is blue-shift. This phenomenon can be explained by the plasmon hybridization with the increasing AgNP onto bacterial surface. TEM and UV-vis results clearly indicate that AgNPs easily grow in situ on the surface of MSSA and MRSA with aptamer guidance. Given the remarkable Raman enhancement from AgNPs directly attached to the S. aureus cell wall, the intrinsic SERS spectra of bacteria can be easily acquired via Raman spectrometry.
As shown in Fig. 2e, the high-quality SERS spectra of MSSA (blue line) and MRSA (red line) were obtained using the aptamer-guided AgNP growth method. The major vibrational modes of S. aureus at 647, 730, 955, 1323, 1465, and 1577 cm−1 can be clearly distinguished and match well with those in previously published studies (Table 1).21,22 No characteristic Raman peak of bacteria can be seen on MSSA and MRSA without aptamer binding (brown and green lines). This result indicates the strong SERS signals of S. aureus derived from the SERS effect of aptamer-guided AgNPs formed on the bacterial surface. The aptamer can provide good selectivity and specificity toward its target bacteria. The specificity of the proposed method is further investigated by detecting five other bacteria with aptamerS. As shown in Fig. 2f, when the AgNPs is synthesized in five nontarget bacteria, including S. typhimurium, pseudomonas aeruginosa (P. aeruginosa), (S. epidermidis), Listeria monocytogenes (L. monocytogenes), and Escherichia coli (E. coli O157:H7) (E. coli) along with the aptamerS, the SERS spectra of these interfering bacteria are extremely weak. The SERS signals of aptamerS bound to S. aureus (MSSA and MRSA) are rather stable. In addition, an E. coli aptamer (aptamerE) is used to test the effect of the nontarget aptamer for S. aureus detection. As displayed in Fig. S2,† no evident SERS signal of MSSA–aptamerE@Ag can be observed, indicating that the nontarget aptamer has no ability to enhance the SERS spectra of S. aureus. These results confirm that the aptamer can only enhance the SERS signal of target bacteria, thus indicating the superior specificity of the proposed method.
| S. aureus (cm−1) | Band assignments |
|---|---|
| 649 | Tyrosine, guanine (ring breathing modes of DNA bases) |
| 730 | Adenine, polyadenine, glycosidic ring mode, DNA |
| 781 | Cytosine, uracil |
| 955 | ν(C–O) and ν(C–N) of proteins |
| 1050 | Carbohydrates, mainly –C–C– (skeletal), C–O, def (C–O–H) |
| 1323 | ν(NH2) adenine, polyadenine, DNA |
| 1465 | δ(CH2), saturated lipids |
| 1577 | Adenine, guanine, tryptophan |
The concentrations of aptamer and AgNO3 in the reaction system are the key factors for the in situ synthesis of AgNPs on the bacterial surface, which should be carefully optimized. Different amounts of aptamers (0–300 nM) were added into concentration-determined MSSA samples (107 cells per mL) to assess the influence of the number of binding aptamers. Fig. S3a† shows the corresponding SERS spectra of the formed MSSA–aptamerS@AgNP complexes with different aptamer concentrations (0–300 nM). Evidently, the SERS signals of MSSA increased with aptamer concentration and peaks in the 200 nM aptamer. A high concentration of aptamer (300 nm) in the system influences the AgNP growth onto bacteria, which can be attributed to excess free aptamer that is difficult to remove completely by centrifugation. Next, the optimum concentration of Ag ions for the in situ synthesis of AgNPs was investigated. As reveals in Fig. S3b,† the main Raman peak at 730 cm−1 increases as the concentration of AgNO3 increases from 1 mM to 12.5 mM. Thus, a 200 nM aptamer and 12.5 mM AgNO3 were selected in this study to ensure high sensitivity and stability of the detection results. Good reproducibility of the rapid label-free system for S. aureus detection was achieved using the optimized conditions (Fig. S4a and b†). Relatively uniform SERS spectra of 10 different batches of MSSA and MRSA samples (∼107 cells per mL) were obtained, and the relative standard deviation values were less than 4.3%, indicating that our method is reproducible and reliable. Notably, the intensity and repeatability of SERS signals of 107 cells per mL tested bacteria (MSSA and MRSA) are much higher than those of 106 cells per mL samples (Fig. S4a–d†). Therefore, we used the spectra from 107 cells per mL of S. aureus to build CNN model. The high-quality SERS spectra of MSSA and MRSA generated by the aptamer-guided AgNP synthesis provide a solid foundation for subsequent CNN recognition.
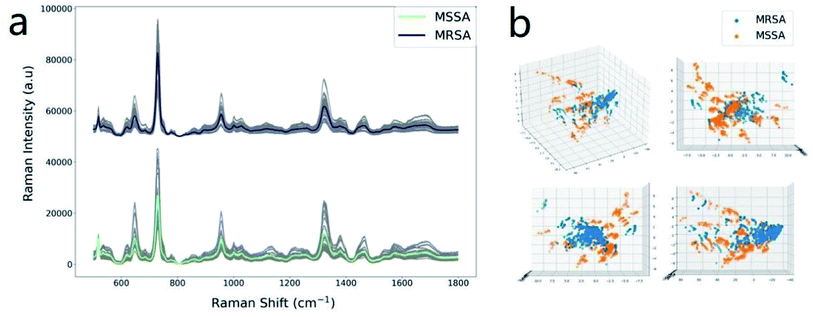
Sixty clinical isolates of S. aureus, including 30 strains of MSSA and 30 strains of MRSA were collected from the Affiliated Hospital of Xuzhou Medical University. The antibiotic susceptibility of bacteria was determined via the VITEK2 COMPACT automated microbial identification system (bioMérieux, La Balme-les-Grottes, France). Under the developed protocol, 1000 SERS spectra of MRSA and MSSA were obtained for the establishment of a rapid analytical method (25 in 30 strains of each species), and the five other strains of each species were used for the test. Fig. 3a displays the average SERS spectra of tested MSSA and MRSA. The positions of all vibrational peaks of MSSA and MRSA were rather similar because two pathogens belong to the same species and have almost the same cell wall components (e.g., peptidoglycans, amino acids, teichoic acid, and proteins). Previous studies reveal that the differences between drug-sensitive and drug-resistant bacteria that are reflected in their SERS spectra should be related to the membrane protein and lipopolysaccharide-resistant plasmids formed by resistant plasmid expression.26,27 For example, a slight difference in the Raman peak at 1156 cm−1 (ν[C–C] protein) can be observed between MSSA and MRSA. The use of the classifier OPLS-DA was attempted to differentiate drug-sensitive and drug-resistant S. aureus on the basis of the SERS spectra. Fig. 3b shows the 3D OPLS-DA score plot of bacteria SERS signal for MSSA and MRSA. The score is less than 0.76, indicating that the main components of MRSA and MSSA are not well distinguished.
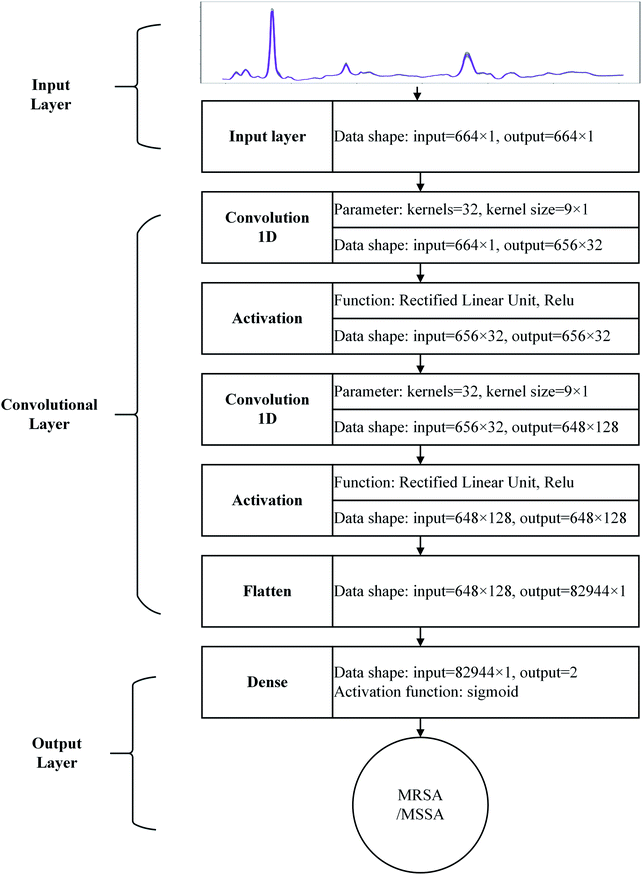
A CNN with shallow structure was constructed as binary classifier for MRSA and MSSA from their SERS spectra, as shown in Fig. 4. Given the lack of decomposability into intuitive and understandable components, CNN is hard to interpret and considered as “black box”.28 In this work, the shallow CNN is a special type of feed-forward CNN with three main sets: input, convolutional, and output layers. Once a 1D vector (spectra) is input to the network, a series of convolution operations with many 1D matrices (called kernels) in convolution layer occurs, and possible data features are abstracted as parallel feature maps layer by layer. Then, the data are flattened and combined into the 1D vector and can be transmitted to connect layers fully (dense layer in Fig. 4), and weight matrices, which connect every vector element with each prediction label, are constructed as mapping functions. Parameters in kernels (convolution layers) and mapping functions (fully connected layer) are random at the beginning. During model training, 1000 spectra from 25 strains of each species were used for model training. These data were split into training and validation data at a ratio of 9![[thin space (1/6-em)]](https://www.rsc.org/images/entities/char_2009.gif) :
:![[thin space (1/6-em)]](https://www.rsc.org/images/entities/char_2009.gif) 1, and the preset network iterated the training data in accordance with the above reference procedure and validates the validation data. The minimum error between predicted and true labels was obtained by the value auto adjust of the mentioned parameters in the process of model iteration. The error decreased to a stable level, and iteration stops and generated a binary classifier with current parameters. The model architecture and training details are described in Section 1.6. Fig. S5† displays the loss and accuracy of the test on the training and validation data by a temporary model during iterations. The model reaches complete convergence only by 20 iterations, and the loss and accuracy are close to 0 and 100%, respectively.
1, and the preset network iterated the training data in accordance with the above reference procedure and validates the validation data. The minimum error between predicted and true labels was obtained by the value auto adjust of the mentioned parameters in the process of model iteration. The error decreased to a stable level, and iteration stops and generated a binary classifier with current parameters. The model architecture and training details are described in Section 1.6. Fig. S5† displays the loss and accuracy of the test on the training and validation data by a temporary model during iterations. The model reaches complete convergence only by 20 iterations, and the loss and accuracy are close to 0 and 100%, respectively.
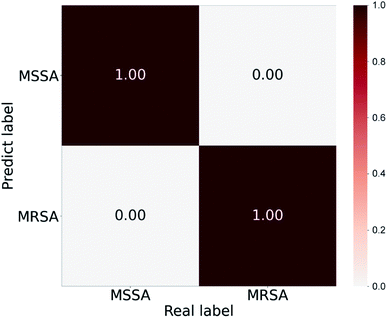
The established binary classifier was tested on five other strains of MSSA and MRSA, which the model had never seen before, to demonstrate that this approach can be extended to new clinical samples and investigate the generalization ability of the classifier. In the prediction process, for each new spectra input to the model, CNN can output a probability vector across the two classes. The maximum was taken as the predicted label, and the average predicted accuracies were calculated (Fig. 5). The pretrained CNN classifier identifies MRSA and MSSA from SERS spectra with average accuracies of 100% and 100%, respectively. In the isolate-level identification, the highest number of predict tags of 40 SERS spectra from each strain was taken as the final diagnosis result. On the basis of spectrum-level accuracies, 100% accuracies of 5 strains of MRSA and 5 strains of MSSA are obtained. Notably, the intensity of SERS spectra of S. aureus–aptamer@Ag complexes increased obviously with the bacterial concentration (104 to 107 cells per mL) (Fig. S6†). All these obtained SERS spectra were used for CNN prediction. As shown in Table S1,† the established CNN method has achieved 100% accuracies for MSSA and MRSA identification with the bacterial concentrations ranging from 107 to 105 cells per mL. When the S. aureus samples with the concentration of 104 cells per mL were detected, the accuracy rate was decreased to 96.5%. To ensure the accuracy and reliability of our method, the concentration of bacterial samples should be reach 105 cells per mL. Moreover, we found the Raman bands of 955–1040 cm−1 make the largest contribution for MSSA and MRSA classification. The detailed data was provided in Fig. S7.†
In summary, we reported a direct SERS method on the basis of the combined use of aptamer recognition and CNN classification for the rapid, specific, and accurate detection of MSSA and MRSA. The aptamerS was used to bind target bacteria (i.e., MSSA and MRSA) and as template to guide AgNP synthesis in situ on the surface of the bacterial cell. The CNN method was used to distinguish MSSA from MRSA accurately on the basis of their SERS fingerprint signals. Results revealed that the proposed system has 100% accuracy rates for MSSA and MRSA detection. To our knowledge, this study is the first to confirm that the combination of aptamer-guided SERS detection and CNN can effectively achieve the accurate detection of drug-resistant bacterial pathogens. We believe that this method has potential applications for rapidly detecting the drug-sensitive and drug-resistant strains of bacteria in the future.
Conflicts of interest
The authors declare no conflict of interest.Acknowledgements
This research was supported by the National Natural Science Foundation of China (81871734, 81471994), the Natural Science Foundation of Anhui Province (Grant no. 1908085QB85), the Postgraduate Research & Practice Innovation Program of Jiangsu Province (No. KYCX20_2472), and the Medical instrument supervise program of Hefei institute of physical science of CAS (YZJJ2021-J-YQ4). We thank Beijing Zhongkebaice Technology Service Co., for helping to conduct TEM analysis.References
- H. Kearns, R. Goodacre, L. E. Jamieson, D. Graham and K. Faulds, Anal. Chem., 2017, 89, 12666–12673 CrossRef CAS PubMed.
- F. Li, Q. Ye, M. Chen, B. Zhou, J. Zhang, R. Pang, L. Xue, J. Wang, H. Zeng, S. Wu, Y. Zhang, Y. Ding and Q. Wu, Biosens. Bioelectron., 2021, 179, 113073 CrossRef CAS PubMed.
- J. Shangguan, Y. Li, D. He, X. He, K. Wang, Z. Zou and H. Shi, Analyst, 2015, 140, 4489–4497 RSC.
- M. Schulz, S. Calabrese, F. Hausladen, H. Wurm, D. Drossart, K. Stock, A. M. Sobieraj, F. Eichenseher, M. J. Loessner, M. Schmelcher, A. Gerhardts, U. Goetz, M. Handel, A. Serr, G. Haecker, J. Li, M. Specht, P. Koch, M. Meyer, P. Tepper, R. Rother, M. Jehle, S. Wadle, R. Zengerle, F. von Stetten, N. Paust and N. Borst, Lab Chip, 2020, 20, 2549–2561 RSC.
- K. Guk, J. O. Keem, S. G. Hwang, H. Kim, T. Kang, E. K. Lim and J. Jung, Biosens. Bioelectron., 2017, 95, 67–71 CrossRef CAS PubMed.
- H. Boucher, L. G. Miller and R. R. Razonable, Clin. Infect. Dis., 2010, 51(Suppl 2), S183–S197 CrossRef CAS PubMed.
- J. Chen, S. M. Andler, J. M. Goddard, S. R. Nugen and V. M. Rotello, Chem. Soc. Rev., 2017, 46, 1272–1283 RSC.
- S. Zheng, X. Yang, B. Zhang, S. Cheng, H. Han, Q. Jin, C. Wang and R. Xiao, Food Chem., 2021, 363, 130400 CrossRef CAS PubMed.
- P. Liu, Y. Wang, L. Han, Y. Cai, H. Ren, T. Ma, X. Li, V. A. Petrenko and A. Liu, ACS Appl. Mater. Interfaces, 2020, 12, 9090–9097 CrossRef CAS PubMed.
- T. Y. Liu, K. T. Tsai, H. H. Wang, Y. Chen, Y. H. Chen, Y. C. Chao, H. H. Chang, C. H. Lin, J. K. Wang and Y. L. Wang, Nat. Commun., 2011, 2, 538 CrossRef PubMed.
- R. M. Jarvis and R. Goodacre, Chem. Soc. Rev., 2008, 37, 931–936 RSC.
- W. Wang, V. Hynninen, L. Qiu, A. Zhang, T. Lemma, N. Zhang, H. Ge, J. J. Toppari, V. P. Hytönen and J. Wang, Sens. Actuators, B, 2017, 239, 515–525 CrossRef CAS.
- C. Wang, J. Wang, M. Li, X. Qu, K. Zhang, Z. Rong, R. Xiao and S. Wang, Analyst, 2016, 141, 6226–6238 RSC.
- C. Wang, C. Wang, X. Wang, K. Wang, Y. Zhu, Z. Rong, W. Wang, R. Xiao and S. Wang, ACS Appl. Mater. Interfaces, 2019, 11, 19495–19505 CrossRef CAS PubMed.
- N. M. Ralbovsky and I. K. Lednev, Chem. Soc. Rev., 2020, 49, 7428–7453 RSC.
- C. S. Ho, N. Jean, C. A. Hogan, L. Blackmon, S. S. Jeffrey, M. Holodniy, N. Banaei, A. A. E. Saleh, S. Ermon and J. Dionne, Nat. Commun., 2019, 10, 4927 CrossRef PubMed.
- X. Wu, Y. W. Huang, B. Park, R. A. Tripp and Y. Zhao, Talanta, 2015, 139, 96–103 CrossRef CAS PubMed.
- W. Lu, X. Chen, L. Wang, H. Li and Y. V. Fu, Anal. Chem., 2020, 92, 6288–6296 CrossRef CAS PubMed.
- H. Wang, Y. Zhou, X. Jiang, B. Sun, Y. Zhu, H. Wang, Y. Su and Y. He, Angew. Chem., Int. Ed. Engl., 2015, 54, 5132–5136 CrossRef CAS PubMed.
- C. Wang, B. Gu, Q. Liu, Y. Pang, R. Xiao and S. Wang, Int. J. Nanomed., 2018, 13, 1159–1178 CrossRef CAS PubMed.
- Y. Liu, H. Zhou, Z. Hu, G. Yu, D. Yang and J. Zhao, Sens. Actuators, B, 2017, 94, 131–140 CAS.
- W. Gao, B. Li, R. Yao, Z. Li, X. Wang, X. Dong, H. Qu, Q. Li, N. Li, H. Chi, B. Zhou and Z. Xia, Anal. Chem., 2017, 89, 9836–9842 CrossRef CAS PubMed.
- M. Shahdordizadeh, S. M. Taghdisi, N. Ansari, F. Alebooye Langroodi, K. Abnous and M. Ramezani, Sens. Actuators, B, 2017, 241, 619–635 CrossRef CAS.
- X. Cao, S. Li, L. Chen, H. Ding, H. Xu, Y. Huang, J. Li, N. Liu, W. Cao, Y. Zhu, B. Shen and N. Shao, Nucleic Acids Res., 2009, 37, 4621–4628 CrossRef CAS PubMed.
- Z. Zhou, R. Xiao, S. Cheng, S. Wang, L. Shi, C. Wang, K. Qi and S. Wang, Anal. Chim. Acta, 2021, 1160, 338421 CrossRef CAS PubMed.
- J. Li, C. Wang, L. Shi, L. Shao, P. Fu, K. Wang, R. Xiao, S. Wang and B. Gu, Mikrochim. Acta, 2019, 186, 475 CrossRef PubMed.
- C.-C. Lin, C.-Y. Lin, C.-J. Kao and C.-H. Hung, Sens. Actuators, B, 2017, 241, 513–521 CrossRef CAS.
- Z. C. Lipton, Commun. ACM, 2018, 61, 36–43 CrossRef.
Footnote |
| † Electronic supplementary information (ESI) available. See DOI: 10.1039/d1ra05778b |
| This journal is © The Royal Society of Chemistry 2021 |

