 Open Access Article
Random laser oscillation from an organic fluorescent dye loaded inside a porous zirconia medium†
Yukari Sakurayamaa,
Tsunenobu Onodera *a,
Yasuyuki Arakia,
Takehiko Wadaa and
Hidetoshi Oikawaab
aInstitute of Multidisciplinary Research for Advanced Materials (IMRAM), Tohoku University, Katahira 2-1-1, Aoba-ku, Sendai 980-8755, Japan. E-mail: tsunenobu.onodera.a4@tohoku.ac.jp
bProfessor Emeritus, Tohoku University, Japan
First published on 28th September 2021
Abstract
Porous zirconia medium (PZrM) has been fabricated successfully using polystyrene microparticles (MPs) as templates. The emission spectra of rhodamine B (RhB) [optical amplifying medium] loaded inside PZrM [porous scatterers] were obtained at numerous excitation light intensities. The lasing thresholds (Ith) have been determined experimentally from the variations in the intensity of random laser oscillation peaks, which are suitably separated from the measured emission spectra. Ith is closely related to the pore sizes of PZrM and the added amount of PZrM powder, and it clearly provided the minimum against the pore size. This fact is explained reasonably by the simulation of scattering efficiency on the basis of the Mie scattering theory. Consequently, PZrM as a porous scatterer is superior to Zr MPs from the viewpoint of random laser oscillation.
1. Introduction
Conventional laser has some unique features,1 such as monochromaticity, coherence, and high directionality. On the one hand, cw- and pulsed-laser systems are essentially powerful tools for fundamental science (photo/optical science, bio/life science, etc.), measurements, and industrial applications, and have been still challenging and studied extensively.2,3 On the other hand, laser oscillation behaviors from a random medium, the so-called random laser oscillation,4–6 are also of much interest. Usually, the random laser system has no optical resonators,7 and many scatterers are randomly dispersed and located in an optical amplifying medium.8–11 Typically, scatterers are either a low refractive material such as SiO2 or a high refractive material, such as TiO2, ZnO, or ZrO2, whereas Nd:YAG, ZnO, GaAs, rhodamine, stilbene, and DCM are well-known as optical amplifying media. Specifically, random laser oscillation is caused by optical amplification based on the multiple scattering effect.11There are two kinds of modes in random laser oscillation.12 One is the non-resonant and incoherent mode,5,6 and the other is the resonant and coherent mode.8,13 In the case of the former, the excitation light, spontaneous emission, and stimulated emission may propagate inside a random medium through the multiple scattering process. When the total gain of light amplification becomes equal to the scattering loss at a lasing threshold (Ith) of excitation light, random laser oscillation is generated above Ith. The emission spectrum of the non-resonant and incoherent mode5,6 is a kind of multi-mode spectrum, and the emission peak is located in the vicinity of the wavelength so that the gain can become the maximum.12 The full width at half maximum (FWHM) of emission spectrum is usually 2 to 10 nm. On the other hand, the emission spectrum possessing some spikes is obtained in the resonant and coherent mode of the latter case.8,12,13 The so-called speckle pattern gives rise to this phenomenon,14 although only some mechanisms have been discussed so far.15–17 Possibly, a pseudo-resonator would be optically constructed by interfering between the scattered lights having specific phase in a random medium. Nevertheless, the characteristics of random laser oscillation are omnidirectional emission, easy mold fabrication, and a high degree of freedom to design and construct random laser systems.4–6,18 Ith has been controlled so far by changing the size and shape of a scatterer and its dispersion concentration.19–21 Indeed, random laser systems are expected to be one of the next-generation elements, devices, sensors, and so on in the fields of optics and photonics.11,12,22,23 However, ordinary random laser has some drawbacks.24 The incident efficiency of excitation light is rather decreased, owing to surface reflection, when the dispersion concentration of scatterers is high in a random medium. This brings about the limit to reduce Ith. To avoid such a problem, it is rationally effective to adopt a random medium with porous structure as a scatterer.24–26 An optical path length is extended in a porous structure, and then, the excitation volume of the optical amplifying medium is also enlarged. As a result, the optical path length will be repeatedly extended further.24 Multiple scattering can occur more effectively in a porous structure with a high refractive index.19 These optical advantages will certainly reduce Ith in random laser oscillation.21
In the present study, the most important purpose is to evidently elucidate the superiority of a porous medium to inorganic microparticles (MPs) as a scatterer in a random laser oscillation. That is to say, an organic fluorescent dye [rhodamine B (RhB) as an optical amplifying medium] had been suitably loaded inside the porous zirconia medium (PZrM) [porous scatterers, n = 2.21 at λ = 632.8 nm], and the structural correlation (e.g., pore size in PZrM) of Ith in random laser be discussed in detail by the measurement using the emission spectrum (compared with zirconia MPs).27 On the other hand, porous polymers, such as silk fibroin, polyvinyl alcohol (PVA) fibers, and PVA MPs, have recently attracted attention, which will possibly lead to some applications, e.g., biocompatible sensing, chemical environment imaging, low coherent illumination, and photonic barcoding.28–30
2. Experimental
2.1 Materials
Styrene monomer, p-styrenesulfonic acid sodium salt (NaPSS), potassium peroxodisulfate (KPS), potassium hydroxide (KOH), potassium dihydrogen phosphate (KH2PO4), zirconyl chloride octahydrate (ZrOCl2·8H2O), rhodamine B (RhB), ethylene glycol (EG), ethanol, and acetone were purchased from FUJIFILM Wako Pure Chemical Corp. 1-Butanol solution (ca. 80%) of zirconium(IV) tetrabutoxide (Zr(OBu)4) was purchased from Tokyo Chemical Industry Co., Ltd. All of the chemical reagents and ultrapure water (18.2 MΩ cm) were used without further purification.2.2 Preparations of polystyrene microparticles (PS MPs), porous zirconia medium (PZrM), and zirconia microparticles (Zr MPs)
As shown in Table S1,† the emulsion polymerization is performed to produce PS MPs at 65 °C under nitrogen atmosphere for a given polymerization reaction time after the addition of styrene monomer (2 M), NaPSS (0 to 2 mM), and KPS (3 mM) as initiators into the mixed medium (200 mL) of water (70 to 100 wt%) and ethanol (30 to 0 wt%) containing KOH (4 mM) and KH2PO4 (4 mM).31,32The sol–gel method was employed to fabricate PZrM.33 Colorless zirconia precursor was first prepared by heating a mixture of ethanol (100 mL) and ZrOCl2·8H2O (1.6 M) at 70 °C for 20 h. Next, PS MPs as templates were filtered out under reduced pressure from an aqueous dispersion liquid (10 mL) of PS MPs, immersed for half an hour by dropping ethanol solution (5 mL) of the zirconia precursor, and then dried up at 75 °C for 3 h. Finally, the resulting solid-state mixture was milled into a fine powder, which was heated at 350 °C for 4 h using an electric oven (Yamato Scientific Co., Ltd.: FO100). The temperature was increased up to 580 °C at 3 K min−1 and further the mixture was calcinated at 580 °C for 6 h in order to fabricate PZrM as a white powder by removing PS MPs.33
Zr MPs were prepared as follows.34 1-Butanol solution of Zr(OBu)4 (1.2 mL) was quickly added stepwise into a mixture of ethanol (100 mL) and NaCl aq. (0.1 M, 0.4 to 0.6 mL) at 60 °C for 4 h under nitrogen atmosphere. The resulting Zr MPs were purified by centrifugation at 18![[thin space (1/6-em)]](https://www.rsc.org/images/entities/char_2009.gif) 000 rpm for 20 min (Hitachi Koki Co., Ltd.: Himac CF16RZ), dried up at 75 °C for 3 h, and finally calcinated in a similar manner as above.33
000 rpm for 20 min (Hitachi Koki Co., Ltd.: Himac CF16RZ), dried up at 75 °C for 3 h, and finally calcinated in a similar manner as above.33
2.3 Loading of RhB into PZrM and mixing of RhB with Zr MPs
About 10 μL of EG solution of RhB (1.5 mM) was penetrated and then loaded homogenously into PZrM powder (0.7, 1.5, and 3.0 mg) mounted on a glass slide by utilizing the capillary force effect and was similarly mixed with Zr MP powder (1.5 mg). RhB loaded into PZrM powder and RhB mixed with Zr MP powder were processed into a disk-shaped sample (diameter: 10 mm and height: 1.5 mm).2.4 Characterization methods
The following instruments were used for characterization: scanning electron microscope (SEM: JEOL, JSM-6700F, 15 kV), dynamic light scattering instrument (DLS: Malvern Instruments, Zetasizer Nano ZS), thermal gravimetric analysis equipment (TGA: PerkinElmer, Pyris 1 TGA), Fourier transform infrared spectroscope (FT-IR: Thermo Fisher Scientific, Nicolet Avatar 360; ATR option: Smith Detection, DuraScope (Ge disk)), and powder X-ray diffractometer (XRD: Brucker, D8 Advance).2.5 Optical system to measure emission spectrum
The optical system is schematically illustrated in Fig. S1.† A Q-switched Nd:YAG laser (LOTIS TII, LS-2137U, 400 mJ at λ = 532 nm (SH), pulse duration = 6 ns, repetition rate = 10 Hz, and beam diameter below 8 mm), compact-type fiber optical spectrometer (Ocean Optics, USB2000, ILX511 linear silicon CCD array, λ = 200 to 800 nm, optical resolution = 0.36 nm, and exposure time = 100 ms), thermal detector for measurement of the laser output (Gentec-EO, UP19K-15S-VM-D0) and laser power meter (Gentec-EO, SOLO2), variable reflective type ND filter (SIGMA KOKI, NDHN-100), L1 (spherical plano-convex lens, SIGMA KOKI, SLQN-20-120P, f = 150 mm), and L2 (spherical plano-concave lens, SIGMA KOKI, SLQN-10-15N, f = 15 mm). The laser incident beam used was focused on to be ca. 1 mm in diameter.3. Results and discussion
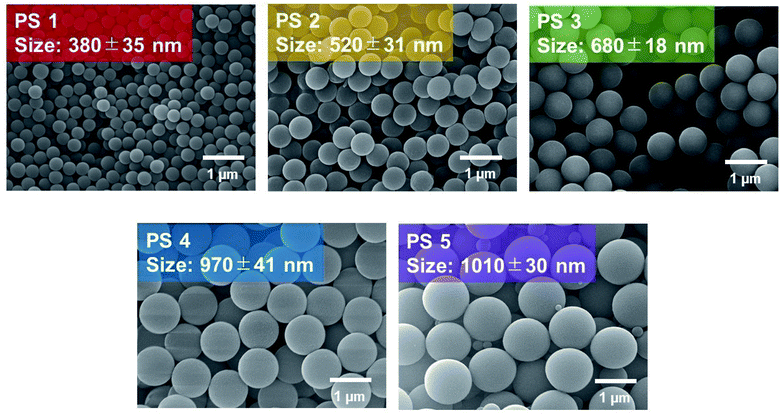
Fig. 1 shows the SEM images of PS MPs (sample codes: PS1 to PS5). As summarized in Table 1, the particle sizes are the average values calculated from 100 of the specimens obtained as SEM images and are approximately the same as those obtained by measuring via the DLS method within the experimental errors. The polydispersity index (PdI) in Table 1 is less than unity in any case, which demonstrates the narrow distribution of the particle sizes.35 In general, the particle size decreased with an increase in the concentration of the ionic co-monomer of NaPSS or with a decrease in the mixture ratio of added ethanol because NaPSS and ethanol would contribute to the solubility of the styrene oligomer formed at the initial stage of emulsion polymerization and dispersion stability of the resulting PS MPs in an aqueous medium.32 Thus, the particle sizes of PS MPs could be controlled adequately by mainly changing the added amounts of NaPSS and/or ethanol in the present study.| Sample code | Particle sizea [nm] (SEM) | Particle size [nm] (DLS) | PdI (DLS) | Sample code | Pore size [nm] |
|---|---|---|---|---|---|
| a The particle size was the average values calculated from 100 of specimens obtained as SEM images. | |||||
| PS1 | 380 ± 85 | 380 | 0.109 | PZM1 | 210 ± 40 |
| PS2 | 520 ± 31 | 660 | 0.098 | PZM2 | 380 ± 31 |
| PS3 | 680 ± 18 | 750 | 0.204 | PZM3 | 470 ± 39 |
| PS4 | 970 ± 41 | 930 | 0.679 | PZM4 | 650 ± 79 |
| PS5 | 1010 ± 30 | 1010 | 0.664 | PZM5 | 840 ± 82 |
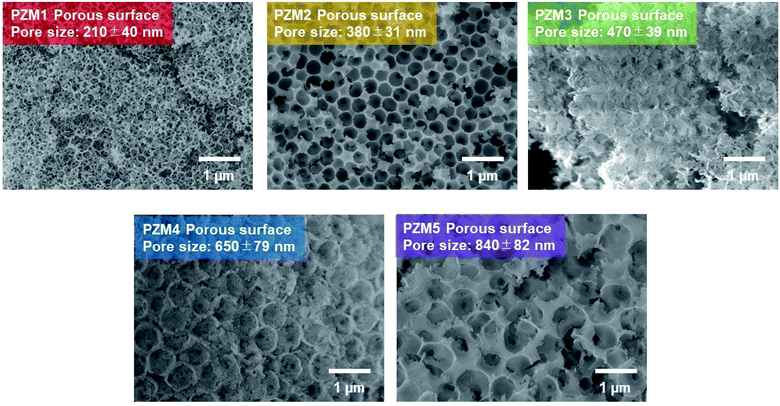
Fig. 2 shows the SEM images of the obtained PZrM (sample codes: PZM1–PZM5).36 The formation of PZrM continuously proceeded through the hydrolysis and deprotonation reactions in the zirconia precursor,37 the subsequent polycondensation reaction, and the removal of PS MPs during calcination at increasing temperatures.39 Fig. S2(a)† shows that the IR absorption peaks from PS MPs at 75 °C disappeared completely at 580 °C,36 which strongly suggests the removal of PS MPs used as templates. Concurrently, the IR absorption peak (Zr–O stretching vibration in zirconia) was observed at 350 °C, and the intensity of the IR absorption increased at 580 °C in the range of 500 cm−1 to 800 cm−1.40 The powder XRD patterns (Fig. S2(b)†) also changed as follows. Only the halo peak was at 2θ = 10° from PS MPs at 70 °C.41 The weak and broad peak at around 2θ = 30° was from zirconia in an amorphous state at 350 °C. The diffraction peaks from the tetragonal cell structure of zirconia crystal appeared at 580 °C.42 In addition, Fig. S3† shows the TGA data obtained during the calcination process. The PS material thermally decomposed at about 360 °C.43 Thus, PS MPs would be thermal-degraded gradually at 350 °C of the first heating stage, and subsequently, the polycondensation of zirconia precursor proceeded rapidly with an increase in temperature so as to form a porous structure. Furthermore, the thermal decomposition and the removal of PS MPs occurred completely at the second heating stage of 580 °C.43 Then, amorphous PZrM was annealed and crystallized sufficiently at the same time.38 It can be seen from the SEM images of PZM3–PZM5 that the surface of PZrM was partially and slightly destroyed when volatile components from the thermally degraded PS MPs were volume expanded and liberated to outside.
The pore sizes of PZrM are the average ones from 30 specimens obtained as SEM images and listed in Table 1. The determined pore sizes were smaller than the particle sizes of PS MPs used as templates. The resulting PZrM was as a whole shrunk during the calcination process38 because of the following factors: removal of volatile components, such as water produced by polycondensation33,34 and fragments from thermally decomposed PS MPs,43 and crystallization of amorphous zirconia. Interestingly, one can see the small-sized black dots inside the porous structure of PZrM. These are a kind of “micropores” found between the neighboring porous structures inside PZrM, which were formed by the adhesion and/or fusion between the contacted PS MPs before calcination.44 Alternatively, the adjacent porous structures would be connected with each other inside PZrM. The micropores would be experimentally known to have two important roles, namely as a path for the removal of volatile components during calcination and for the homogeneous and easy loading of EG solutions of RhB into PZrM by capillary force effect.
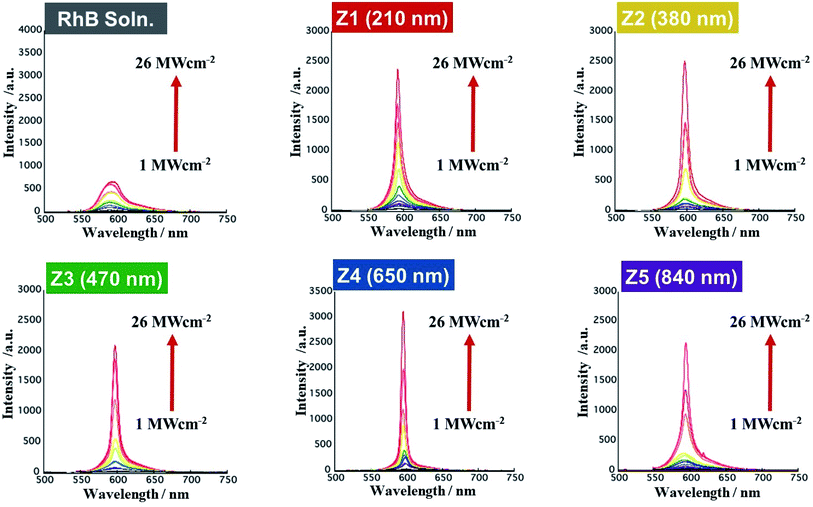
The emission spectra of RhB (1.5 mM, 10 μL) loaded inside PZrM with different pore sizes (sample codes: Z1 to Z5, 1.5 mg) are shown in Fig. 3. The excitation light intensity was varied in twelve steps of 1, 2, 3, 4, 5, 6, 8, 10, 14, 18, 22, and 26 MW cm−2. These emission spectra were obtained by averaging about 100 spectral data, which were retrieved for 20 s of irradiation time of excitation light at four different positions of the laser beam spot in each of the three specimens prepared under the same preparation conditions. As a result, the emission intensity was multiplied remarkably beyond the excitation light intensity in any case, and the emission peaks became sharp and narrowed extremely compared with that of the EG solution of RhB (1.5 mM). The most important feature is that the emission spectra of Z1 to Z5 provided a single and sharp peak without any spikes at a wavelength range of 550 to 650 nm, which distinctly demonstrated the “non-resonant and incoherent random laser oscillation” in any case.11,12 However, the measured emission spectra shown in Fig. 3 involve in common the spontaneous fluorescence that originated from RhB itself. Thus, the spectral decomposition is performed by employing the Gaussian function, as shown in Fig. S4.†45 As a result, the Gaussian component of blue solid-line divided from the measured emission spectra of Z5 (1.5 mg) was evidently assigned to the origin of random laser oscillation with reference to the spectral decomposition in the emission spectra of the RhB solution (1.5 mM).
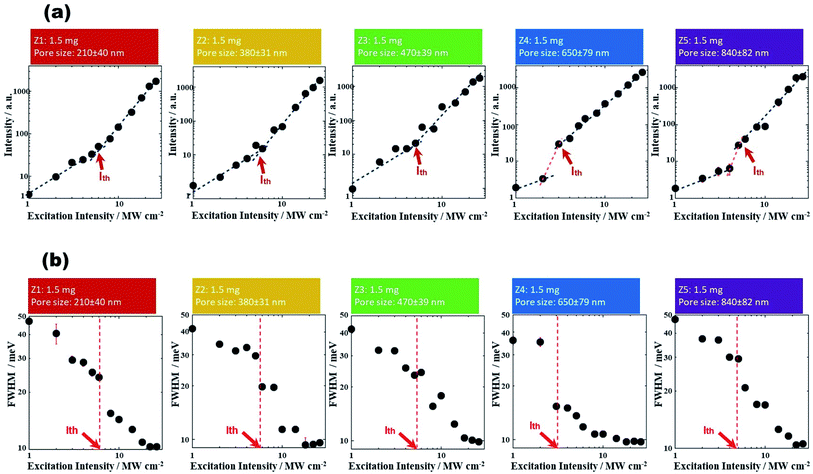
We further discuss about the spectral behaviors of the Gaussian component, i.e., random laser oscillation peaks. Fig. 4 shows the dependences of the (a) intensity and (b) FWHM of random laser oscillation peaks on the excitation light intensity in Z1 (1.5 mg) to Z5 (1.5 mg). The arrows indicate the experimentally determined Ith.7,11,21 The intensity of random laser oscillation increased with the excitation light intensity and enhanced remarkably above Ith. The FWHM narrowed around Ith at the same time. On the other hand, the wavelength of the random laser oscillation peak was barely influenced by the excitation light intensity within the experimental errors. Incidentally, although the emission spectra of the RhB solution shown in Fig. 3 and S4(b)† might correlate with the so-called amplified spontaneous emission (ASE),46,47 no argument has now advanced here from the viewpoint of main purpose of the present study.
Apparently, overall, the dependence of Ith on the pore sizes and the added amounts of PZrM powder is shown in Fig. 5. Ith decreased merely with an increase in the added amounts of PZrM powder (0.7, 1.5, and 3.0 mg) in any of the samples (Z1–Z5)48–50 owing to the highly efficient multiple scattering effect inside the porous structure.19,27 It is worth noting that Ith provided the minimum against pore sizes. The wavelength of random laser oscillation peaks (λ = 590 to 600 nm) is close to the pore size (650 nm) of Z4 (PZM4) compared with those of the others (Z1, Z2, Z3, and Z5). To further clarify this relation, the scattering efficiency (Qsca) has been simulated on the basis of the Mie scattering theory by assuming the optically structural model at the first approximation, as illustrated in Fig. S5(a),†51,52 wherein a spherical domain filled with EG is located at the surrounding medium of zirconia. The radii (r) of the domains are in the range of 105–420 nm, which correspond to the pore size of PZrM, as listed in Table 1. It has become apparent from Fig. S5(b)† that Qsca for r = 235 nm (green line, corresponding to PZM3) and r = 325 nm (blue line, corresponding to PZM4) has become relatively high and takes the maximum in the vicinity of the wavelength of random laser oscillation peaks. In particularly, the random laser oscillation from the porous structure was closely correlated with the pore size,25,26 and then, the multiple scattering effect inside Z4 (PZM4) became highly efficient for random laser oscillation from RhB,19,27,53 which would result in the lowering of Ith.
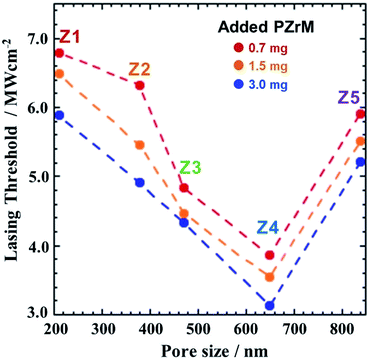 | ||
| Fig. 5 Dependence of Ith on the pore sizes of Z1 (PZM1) to Z5 (PZM5) and the added amounts of PZrM powders (0.7, 1.5, and 3 mg). | ||
Furthermore, the emission spectra were investigated in the dispersion mixture of the EG solution of RhB (1.5 mM, 10 μL) and Zr MPs (1.5 mg) (sample codes: ZP1 and ZP2) (Fig. S6†). Similarly, the measurements of emission spectra at various excitation light intensities and the spectral decomposition was carried out to determine Ith. It was found from Fig. 6 that Ith in Z4 is remarkably lower than those of ZP1 and/or ZP2 within the present experimental framework. This fact strongly suggests that PZrM as a porous scatterer would be superior to Zr MPs from the viewpoint of random laser oscillation caused by the multiple scattering effect.19,27,53
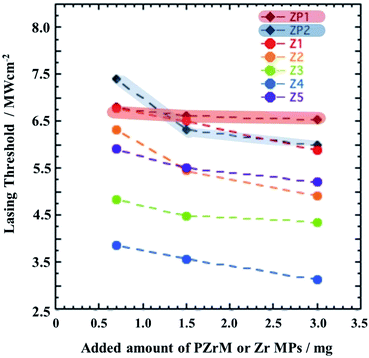 | ||
| Fig. 6 Comparison of Ith in the cases of PZrM (Z1 to Z5) (0.7, 1.5, and 3 mg) and Zr MPs (sample codes: ZP1 and ZP2) (0.7, 1.5, and 3.0 mg). | ||
Finally, the present random laser system, the minimum Ith = ca. 3 MW cm−2 in Fig. 5 and 6, consisting of PZrM and RhB, was tried to be compared with similar others. Reasonably, it should be necessary to carefully compare the obtained Ith with that described elsewhere because Ith is in general influenced by some experimental factors, such as the used materials, fabrication processes, and pumping and detecting conditions. However, to the best of our knowledge, there were actually no previously reported literatures with respect to PZrM. Thus, indirect comparison was performed by noting the scatterer of inorganic MPs. For example, Ith = 6.8 to 8.6 MW cm−2 in Zr MPs/Rh6G/PU,21 Ith = 75.8 to 121.1 MW cm−2 in Zr MPs/DO11/PMMA,54 Ith = 3 to 10 MW cm−2 in ZnO MPs (gain medium and scatterer),8,55,56 and Ith = 30 MW cm−2 in ZnO nanorods.57 In addition, some articles relating to MOFs (metal–organic frameworks) were recently reported as follows: MOF powder (Ith = 1.5 mJ cm−2, two-photon pumping),58 MOF single crystalline (Ith = 12.5 nJ cm−2),59 and MOF particles (Ith = 0.67 mJ cm−2).60 Nevertheless, it can be claimed that Ith in the present random laser system is low enough compared with others.
4. Conclusions
PZrM was fabricated successfully using PS MPs as templates. The emission spectra of RhB loaded inside PZrM were measured at various excitation light intensities, and the Gaussian component of random laser oscillation was separated suitably by employing the spectral decomposition process to determine Ith. The Ith was affected extensively by the pore sizes of PZrM and the added amount of PZrM powder. In fact, the Ith clearly provided the minimum, when the pore size was close to the wavelength of random laser oscillation, which would be rational from Qsca simulation on the basis of Mie scattering theory. It became apparent that PZrM as a porous scatterer would be superior to Zr MPs with respect to random laser oscillation.Funding
Ministry of Education, Cultures, Sports, Science and Technology (MEXT), Japan.Conflicts of interest
There are no conflicts of interest to declare.Acknowledgements
The present research was performed with the financial support from the Management Expenses Grant in Tohoku University (National University Corporation). This budget was delivered from MEXT, Japan.References
- H. Haken, Laser Theory, Springer-Verlag, N.Y., 1984 Search PubMed.
- R. Scheps, Prog. Quantum Electron., 1996, 20, 271–358 CrossRef CAS.
- M. A. Zimmler, F. Capasso, S. Müller and C. Ronning, Semicond. Sci. Technol., 2010, 25, 024001 CrossRef.
- D. S. Wiersma, M. P. van Albada and A. Lagendijk, Nature, 1995, 373, 203–204 CrossRef CAS.
- M. A. Noginov, Solid-State Random Laser, Springer, N.Y., 2005 Search PubMed.
- D. S. Wirsma, Nat. Phys., 2008, 4, 359–367 Search PubMed.
- N. M. Lawandy, R. M. Balachandran, A. S. L. Gomes and E. Sauvain, Nature, 1994, 368, 436–438 CrossRef.
- H. Cao, Y. G. Zhao, S. T. Ho, E. W. Seelig, Q. G. Wang and R. P. H. Chang, Phys. Rev. Lett., 1999, 82, 2278–2281 CrossRef CAS.
- H. Cao, J. Y. Xu, Y. Ling, A. L. Burin, E. W. Seelig, X. Liu and R. P. H. Chang, IEEE J. Quantum Electron., 2003, 9, 111–119 CrossRef CAS.
- C. T. Dominguez, M. de A. Gomes, Z. S. Macedo, C. B. de Araújo and A. S. L. Gomes, Nanoscale, 2015, 7, 317–323 RSC.
- H. Cao, Waves Random Complex Media, 2003, 13, R1–R39 CrossRef.
- F. Luan, B. Gu, A. S. L. Gomes, K.-T. Yong, S. Wen and P. N. Prasad, Nano Today, 2015, 10, 168–192 CrossRef CAS.
- H. Cao, J. Y. Xu, D. Z. Zhang, S.-H. Chang, S. T. Ho, E. W. Seelig, X. Liu and R. P. H. Chang, Phys. Rev. Lett., 2000, 84, 5584–5587 CrossRef CAS PubMed.
- J. Andreasen, A. A. Asatryan, L. C. Botten, M. A. Byrne, H. Cao, L. Ge, L. Labonté, P. Sebbah, A. D. Stone, H. E. Türeci and C. Vanneste, Adv. Opt. Photonics, 2011, 3, 88–127 CrossRef CAS.
- A. F. Ioffe and A. R. Regel, Prog. Semicond., 1960, 4, 237–291 CrossRef.
- V. M. Apalkov, M. E. Raikh and B. Shapiro, Phys. Rev. Lett., 2002, 89, 016802 CrossRef CAS PubMed.
- M. Hgulinyan and L. Pavesi, Light Localization and Lasing, Cambridge Univ. Press, UK, 2015 Search PubMed.
- B. Redding, M. A. Choma and H. Cao, Nat. Photonics, 2012, 6, 355–359 CrossRef CAS PubMed.
- A. Z. Genack and J. M. Drake, Nature, 1994, 368, 400–401 CrossRef.
- T. Okamoto and S. Adachi, Opt. Rev., 2010, 17, 300–304 CrossRef CAS.
- B. R. Anderson, R. Gunawidjaja and H. Eilers, J. Opt. Soc. Am. B, 2014, 31, 2363–2370 CrossRef CAS.
- Y. Feng and K. Ueda, Phys. Rev. A: At., Mol., Opt. Phys., 2003, 68, 025803 CrossRef.
- C. J. S. de Matos, L. de S. Menezes, A. M. B. Silva, M. A. M. Gamez, A. S. L. Gomes and C. B. de Araujo, Phys. Rev. Lett., 2007, 99, 153903 CrossRef PubMed.
- V. P. Yashcuk, V. Koreniuk, E. Tikhonov and V. Bezrodny, Appl. Phys. B, 2014, 92, 593–597 CrossRef.
- C. C. Alves, C. R. Mendonaca, L. de Boni and J. M. A. Caiut, J. Mater. Sci.: Mater. Electron., 2019, 30, 16849–16855 CrossRef CAS.
- S. Murai, K. Fujita, J. Konishi, K. Hirao and K. Tanaka, Appl. Phys. Lett., 2010, 97, 031118 CrossRef.
- D. S. Wiersma, Nat. Photonics, 2013, 7, 188–196 CrossRef CAS.
- S. Caixero, M. Gaio, B. Marelli, F. G. Omenetto and R. Sapienza, Adv. Opt. Mater., 2016, 4, 998–1003 CrossRef.
- V. D. Ta, D. Saxena, S. Caixeiro and R. Sapienza, Nanoscale, 2020, 12, 12357–12363 RSC.
- V. D. Ta, S. Caixeiro, D. Saxena and R. Sapienza, Advanced Photonics Research, 2021, 2, 2100036 CrossRef.
- A. R. Goodall, M. C. Wilkinson and J. Hearn, J. Polym. Sci., Polym. Chem. Ed., 1977, 15, 2193–2218 CrossRef CAS.
- Y. Chonde and I. M. Krieger, J. Appl. Polym. Sci., 1981, 26, 1819–1827 CrossRef CAS.
- C. J. Brinker and G. W. Scherer, Sol-Gel Science, Academic Press, N.Y., 1990 Search PubMed.
- J. Widoniak, S. E. Assmann and G. Maret, Eur. J. Inorg. Chem., 2005, 15, 3149–3155 CrossRef.
- W. M. Brouwer, J. Appl. Polym. Sci., 1989, 38, 1335–1346 CrossRef CAS.
- S. Li, J. Zheng, W. Yang and Y. Zhao, Mater. Lett., 2007, 61, 4784–4786 CrossRef CAS.
- A. Clearfield, Rev. Pure Appl. Chem., 1964, 14, 91–108 CAS.
- G. K. Chuah, S. Jaenicke, S. A. Cheong and K. S. Chan, Appl. Catal., A, 1996, 145, 267–284 CrossRef CAS.
- N. Grassie and N. A. Weir, J. Appl. Polym. Sci., 1965, 9, 975–986 CrossRef CAS.
- C. M. Phillippi and K. S. Mazdiyasni, J. Am. Ceram. Soc., 1971, 54, 254–258 CrossRef CAS.
- J. R. Katzs, J. Selman and L. Heyne, Z. Phys. Chem., 1927, 125, 321–330 CrossRef.
- N. Chadra, D. K. Singh, M. Shrma, R. K. Upadhyay, S. S. Amritphale and S. K. Sanghi, J. Colloid Interface Sci., 2010, 342, 327–332 CrossRef PubMed.
- L. Reich, Element of Polymer Degradation, McGraw-Hill Book Co., N.Y., 1971 Search PubMed.
- R. C. Schroden, M. Al-Daous, C. F. Blandford and A. Stein, Chem. Mater., 2002, 14, 3305–3325 CrossRef CAS.
- M. Hino, Spectrum Analysis, Asakura Shoten, Tokyo, 1972 Search PubMed.
- H. Cao, J. Y. Xu, S.-H. Chang and S. T. Ho, Phys. Rev. E: Stat., Nonlinear, Soft Matter Phys., 2000, 61, 1985–1989 CrossRef CAS PubMed.
- L. Cerdan, A. Costela, I. Garcia-Moreno, O. Garcia and R. Sastre, Opt. Express, 2019, 10, 10247–10256 Search PubMed.
- L. W. Sha, C. H. Liu and R. R. Alfano, Opt. Lett., 1994, 19, 1922–1924 CrossRef PubMed.
- N. M. Lawandy and R. M. Balachandran, Nature, 1995, 373, 204 CrossRef CAS.
- G. Beckering, S. J. Zilker and D. Haarer, Opt. Lett., 1997, 22, 1427–1429 CrossRef CAS PubMed.
- G. Mie, Ann. Phys., 1908, 25, 377–445 CrossRef CAS.
- H. C. Van de Hulst, Light Scattering by Small Particles, Dover Pub. Inc., N.Y., 1957 Search PubMed.
- M. Ohtsu and H. Hori, Near-Field Nano Optics, Kluwer Academic/Plenum Publishers, N.Y., 1999 Search PubMed.
- B. R. Anderson, R. Gunawidjaja and H. Eilers, J. Opt., 2016, 18, 015403 CrossRef.
- J. Fallert, R. J. B. Dietz, M. Hauser, F. Stelzl, C. Klingshirn and H. Kalt, J. Lumin., 2009, 129, 1685–1688 CrossRef CAS.
- R. Niyuki, H. Fujiwara, Y. Ishikawa, N. Kashizaki, T. Tsuji and K. Sasaki, J. Opt., 2016, 18, 035202 CrossRef.
- H. Fujiwara, T. Suzuki, R. Niyuki and K. Sasaki, New J. Phys., 2016, 18, 103046 CrossRef.
- M. Liu, H. S. Quah, S. Wen, Y. Ki, J. J. Vittal and W. Ji, J. Phys. Chem. C, 2018, 122, 777–781 CrossRef CAS.
- K. P. Bera, S. Kamal, A. I. Inamdar, B. Sainbileg, H.-I. Lin, Y.-M. Liao, R. Ghosh, T.-J. Chang, Y.-G. Lee, H. Cheng-Fu, Y.-T. Hsu, M. Hayashi, C.-H. Hung, T.-T. Luo, K.-L. Lu and Y.-F. Chen, ACS Appl. Mater. Interfaces, 2020, 12, 36485–36495 CrossRef CAS PubMed.
- B. Xu, Z. Gao, Y. Wei, Y. Liu, X. Sun, W. Zhang, X. Wang, Z. Wang and X. Meng, Nanoscale, 2020, 12, 4833–4838 RSC.
Footnote |
| † Electronic supplementary information (ESI) available. See DOI: 10.1039/d1ra05791j |
| This journal is © The Royal Society of Chemistry 2021 |

