 Open Access Article
Garnet to hydrogarnet: effect of post synthesis treatment on cation substituted LLZO solid electrolyte and its effect on Li ion conductivity†
Charlotte Fritsch a,
Tatiana Zinkevichab,
Sylvio Indris
 a,
Martin Etterc,
Volodymyr Barancd,
Thomas Bergfeldte,
Michael Knappa,
Helmut Ehrenberg
 a and
Anna-Lena Hansen
 *a
*a
aInstitute for Applied Materials – Energy Storage Systems (IAM-ESS), Karlsruhe Institute of Technology, Hermann-von Helmholtz-Platz 1, 76344 Eggenstein-Leopoldshafen, Germany. E-mail: anna-lena.hansen-kit.edu
bHelmholtz Institute Ulm, Helmholtzstraße 11, 89081 Ulm, Germany
cDeutsches Elektronen – Synchrotron (DESY), Notkestraße 85, 22607 Hamburg, Germany
dHeinz Maier-Leibnitz Zentrum, Lichtenbergstraße 1, 85748 Garching bei München, Germany
eInstitute for Applied Materials – AWP (INT), Karlsruhe Institute of Technology, Hermann-von Helmholtz-Platz 1, 76344 Eggenstein-Leopoldshafen, Germany
First published on 10th September 2021
Abstract
We investigated why commercial Li7La3Zr2O12 (LLZO) with Nb- and Ta substitution shows very low mobility on a local scale, as observed with temperature-dependent NMR techniques, compared to Al and W substituted samples, although impedance spectroscopy on sintered pellets suggests something else: conductivity values do not show a strong dependence on the type of substituting cation. We observed that mechanical treatment of these materials causes a symmetry reduction from garnet to hydrogarnet structure. To understand the impact of this lower symmetric structure in detail and its effect on the Li ion conductivity, neutron powder diffraction and 6Li NMR were utilized. Despite the finding that, in some materials, disorder can be beneficial with respect to ionic conductivity, pulsed-field gradient NMR measurements of the long-range transport indicate a higher Li+ diffusion barrier in the lower symmetric hydrogarnet structure. The symmetry reduction can be reversed back to the higher symmetric garnet structure by annealing at 1100 °C. This unintended phase transition and thus a reduction in conductivity is crucial for the processing of LLZO materials in the fabrication of all-solid state batteries.
1. Introduction
The garnet-type structure La3Li5M2O12 (M = Nb, Ta) was first described by Mazza1 and Hyooma2 in 1988. Li7La3Zr2O12 (LLZO), with Zr substituted for Nb and Ta yielded remarkably high Li+ conductivities (3 × 10⁻⁴ S cm−1 at 25 °C) and made the ceramic material a promising candidate as a solid-state Li-ion conductor.3 A comprehensive overview of LLZO materials and the recent development of oxide based all solid-state batteries were published recently,4 e.g. by Wang et al.5 To improve the ionic conductivities, high mobility and a high density of charge carriers must be achieved. Among other methods, substitution in the cation lattice has been proven to increase the ionic conductivity in LLZO materials.6 Aliovalent substitution of the cations is on the one hand required for the stabilization of the cubic structure at ambient conditions, which yields much higher conductivities as compared to tetragonal counterparts. On the other hand, it can induce disorder into the structures, which is known to be beneficial for ionic conductivities.7–10 Substitution with higher valent cations can lead to a higher local mobility of ions.11 It is assumed, that a maximum of sublattice entropy in garnet-type structures could have an enhancing effect on the Li+ conductivity.10 The introduction of defects and distortions via ball milling can have a positive effect on conductivity, as explained by Schlem et al.12 Liu et al. follow this by stating that an understanding of this local defect structure is also important in order to prevent dendrite formation.13 Thorough choice of the substituents allows tuning the materials properties and gaining more efficient sintering conditions and thus economic fabrication for industrial application. Well-balanced substitution of Zr4+ by e.g. Nb5+, Ta5+ and W6+ reduces the required synthesis temperature and duration as compared to the common Al3+ substitution as summarized in Table 1. All materials were obtained from a ceramic synthesis and the total conductivity was measured by impedance spectroscopy. While the resultant conductivities of the LLZO samples do not differ significantly, in order to get a reasonable conductivity in Al containing LLZO much longer sintering times are required (up to 36 hours). Using the other substituents, the maximum necessary sintering time was 15 h. Therefore, Nb-, Ta- and W-substituted LLZOs are beneficial for large-scale battery production. Cations suitable for substitution in cubic LLZO and their preferred coordination in binary oxides are listed in Table S1 in the ESI.†| Stoichiometry | Calcination steps | Bulk conductivity | Ref. |
|---|---|---|---|
| 1 wt% Al as Al2O3 between (2) and (3) calcination | (1) 900 °C, 5 h | 4.4 × 10⁻⁴, 25 °C | 14 and 15 |
| (2) 950 °C, 12 h | |||
| (3) 1180 °C, 36 h | |||
| Li6.5La3Zr1.5Nb0.5O12 | (1) 900 °C, 8 h | 6.6 × 10⁻⁴ 21 °C | 16 |
| (2) 1230 °C, 15 h | |||
| Li6.675La3Zr1.625Ta0.375O12 starting from LiOH | (1) 950 °C, 12 h | 5.0 × 10⁻⁴, 25 °C | 17 |
| (2) 1000 °C, 12 h | |||
| (3) 1000 °C, 12 h | |||
| Li6.3La3Zr1.65W0.35O12 | (1) 900 °C, 12 h | 8.0 × 10⁻⁴, 25 °C | 18 |
| (2) 1200 °C, 12 h |
While most of LLZO materials crystallize in the classical garnet structure type, space group Ia![[3 with combining macron]](https://www.rsc.org/images/entities/char_0033_0304.gif) d (no. 230), a different garnet structure is also known: “hydrogarnet” (I
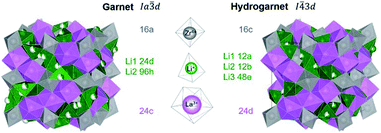
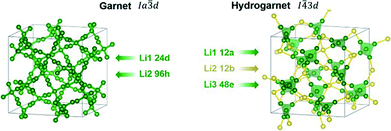
d (no. 230), a different garnet structure is also known: “hydrogarnet” (I![[4 with combining macron]](https://www.rsc.org/images/entities/char_0034_0304.gif) 3d, no. 220). The latter has been observed for Ga and Fe substituted samples.19–21 Due to their small ionic radius, these ions are expected to occupy the Li site(s). In contrast, larger atoms such as Nb, Ta, and W substitute on the Zr site. The similarity of both structures can be seen in Fig. 1. In contrast to the garnet structure, the hydrogarnet structure lacks a general threefold inversion axis. We note that the term hydrogarnet refers to the structure type of space group no. 220 and not to an exchange of protons or hydroxide groups.
3d, no. 220). The latter has been observed for Ga and Fe substituted samples.19–21 Due to their small ionic radius, these ions are expected to occupy the Li site(s). In contrast, larger atoms such as Nb, Ta, and W substitute on the Zr site. The similarity of both structures can be seen in Fig. 1. In contrast to the garnet structure, the hydrogarnet structure lacks a general threefold inversion axis. We note that the term hydrogarnet refers to the structure type of space group no. 220 and not to an exchange of protons or hydroxide groups.
An additional site for Li transport in the hydrogarnet structure is described by Wagner and Rettenwander.19 They propose that the symmetry reduction is caused by the presence of Gallium. Robben et al. follow this assumption.21 In a later publication dealing with Fe-substituted LLZO, Wagner et al. propose that the hydrogarnet structure is formed by ordering of Fe3+ on the tetrahedral Li1 (12a) site.20 To the best of our knowledge, the formation of the hydrogarnet structure has not been reported for LLZO substituted with Al3+, Nb5+, Ta5+ or W6+ so far. In this paper, four differently substituted (Al3+, Nb5+, Ta5+, or W6+) commercial LLZO materials are examined on the crystal structure and local distortions by means of X-ray and neutron powder diffraction (XRD/NPD) as well as by 6Li and 27Al magic-angle spinning (MAS) nuclear magnetic resonance (NMR) spectroscopy. Total scattering pair distribution function analysis (PDF) provides insights into the structural impact of the synthesis steps. We investigate the formation of geometric frustration induced by ball milling and its reversal by temperature treatment with XRD and PDF. The short-range Li+-ion dynamics are studied using temperature-dependent static 7Li NMR lineshape measurements and 7Li NMR spin–lattice relaxation experiments (T1). Examining the short-range Li+ transport and ion hopping, the commercial hydrogarnet-structured LLZO is compared to our synthesized garnet LLZO reference samples.
We show that the thermal treatment induces the hydrogarnet-to-garnet transformation. This influences the bulk Li+ conductivity, which becomes that much enhanced that it can be assessed by 7Li pulsed field-gradient (PFG) NMR and impedance measurements on sintered pellets.
2. Experimental
LLZO samples were purchased from MSE supplies with different substituents. Their stoichiometry provided by the supplier is: Li6.1Al0.3La3Zr2O12, Li6.5La3Zr1.5Nb0.5O12, Li6.25La3Zr1.25Ta0.75O12, Li6.3La3Zr1.65W0.35O12. The stoichiometry was revised by X-ray fluorescence spectroscopy (XRF) (Pioneer S4, Bruker AXS), inductively-coupled plasma optical-emission spectroscopy (ICP-OES) (iCAP 7600 ICP-OES Duo, Thermo Fisher Scientific) and carrier gas hot extraction (CGHE) (TC 600, LECO) for oxygen, as described below. The results are listed in the ESI in Table S2.† LLZO reference compounds were prepared according to the composition specified by the manufacturer as listed above by a high-temperature route using Li2CO3 (Alfa Aesar), ZrO2 (Alfa Aesar) and La2O3 (Alfa Aesar) and either AlNO3 (Alfa Aesar), NbO2, Ta2O5 or WO2.9 for the substituents (Alfa Aesar). The starting materials were mixed in stoichiometric amounts (5 wt% Li2CO3 excess was used) and milled for 1 h in 2-propanol in a planetary ball mill (Fritsch, Pulverisette 7, premium line) with zirconia balls and grinding bowls. After calcination at 1100 °C in MgO crucibles, garnet-type LLZO was obtained as a white powder. The powder was ball milled subsequently as described above or pressed to pellets, covered with mother powder, and sintered at 1100 °C for 10 h. LiOH (Sigma Aldrich) as a reference was dried in vacuum overnight.For the XRF measurement, 25 mg (accuracy ± 0.05 mg) of each sample together with 6000 mg (49.75% Li2B4O7 + 49.75% LiBO2 + 0.5% LiBr) has been balanced in a platinum crucible and fused by 1100 °C. Afterwards the flux has been poured out in a platinum dish. For the calibration, four fusion tablets with matrix-adapted standards (Li2CO3, Al2O3, ZrO2, La2O3, Nb2O5, Ta2O5, WO3) were melted. The range of the calibration solutions did not exceed a decade. Two to three energy lines of the elements have been used for calculation. For the ICP-OES measurement, 30 mg of the samples (accuracy ± 0.05 mg) was dissolved in 4 ml hydrochloric acid, 4 ml sulfuric acid and 0.02 ml hydrofluoric acid at 250 °C for 12 h in the pressure digestion vessel DAB-2 (Berghof). The analysis of the elements was accomplished with four different calibration solutions and an internal standard (Sc). The range of the calibration solutions did not exceed a decade. Two to three wavelengths of the elements have been used for calculation. The oxygen concentration was calibrated with the certified standard KED 1025, a steel powder from ALPHA. The calibration was verified with two oxide powders (La2O3, ZrO2). The calibration range was close to the concentration of the samples. The standards and the samples were weighed with 3 mg to 100 mg (weighing accuracy ± 0.05 mg) in Sn crucibles (5 × 12 mm). 5 mg graphite was added and wrapped. Combined with a Sn pellet (about 200 mg) it was put into a Ni crucible. The package was loaded in an outgassed double graphite crucible. The measurements take place at 5800 W. The evolving gases CO2 and CO were swept out by helium as an inert carrier gas and measured by infrared detectors.
X-ray diffraction patterns were measured on a STOE Stadi P powder diffractometer using monochromatic Mo-Kα1 radiation (λ = 0.70932 Å). Powder samples were measured in Debye–Scherrer geometry in sealed glass capillaries. A LaB6 reference (NIST660b) was measured accordingly to account for instrumental contributions and alignment.
Neutron powder diffraction (NPD) studies were performed at the high-resolution powder diffractometer SPODI (research neutron reactor FRM II, Garching, Germany).22 Monochromatic neutrons (λ = 1.5482 Å) were obtained at a 155° take-off angle using the 551 and 331 reflections of a vertically focusing composite Ge monochromator, accordingly. The vertical position-sensitive multidetector (300 mm effective height) consisting of 80 3He tubes and covering an angular range of 160° 2θ was used for data collection. Measurements were performed in the Debye–Scherrer geometry. The powder sample was filled into a cylindrical thin-wall vanadium container of 10 mm diameter under argon and metal sealed using indium wire. Exposure time was set to 4 h per pattern. The instrumental resolution function was determined using a Na2Ca3Al2F14 reference. The Rietveld co-refinement against both X-ray and neutron diffraction patterns was performed using the FullProf software package.23 Cell parameters were determined from the X-ray data.
Room temperature synchrotron total scattering experiments were performed at the Powder Diffraction and Total Scattering beamline P02.1 at PETRA III, DESY, using radiation with a photon energy of ∼60 keV (λ = 0.20723 Å).24 The data was acquired using a Perkin Elmer area detector with a sample-detector distance of 350 mm. The exposure time for each diffraction pattern was 20 min. The obtained 2D images were integrated to 1D patterns by using the program DAWNscience.25 Powder samples were measured in sealed glass capillaries with 0.5 mm diameter. An empty capillary was measured under the same conditions and used for background subtraction. To account for the instrumental resolution function, LaB6 (NIST660a) and a Ni reference were measured. The corresponding pair distribution function was calculated using pdfgetx3 (ref. 26) with Qmax = 20 Å−1. Calculation of PDFs based on molecular models and real space Rietveld fitting was performed with PDFgui.27 Coordination analysis was calculated using the Software OVITO28 based on a crystal structure published by Awaka et al.29
6Li and 27Al magic-angle spinning (MAS) nuclear magnetic resonance (NMR) spectroscopy was performed with Bruker Avance 500 MHz spectrometer at a field of 11.7 T, which corresponds to resonance frequencies of 73.6 MHz and 130.3 MHz, respectively. For these measurements, the samples were packed into 2.5 mm zirconia rotors in an argon-filled glove box and spinning was performed at 30 kHz. The spectra were recorded with a rotor-synchronized Hahn-echo pulse sequence. The chemical shifts were referenced to aqueous solutions of 1 M LiCl for 6Li and 1 M Al(NO3)3 for 27Al.
Temperature-dependent static 7Li NMR spectra were acquired on a Bruker 200 MHz spectrometer. The spectrometer was equipped with a high-temperature probe which allows measurements in a temperature range from −100 to 250 °C. Static spectra were measured with a quadrupolar-echo pulse sequence with an inter-pulse delay of 30 μs. The relaxation delays were optimised for every measurement based on the spin-lattice relaxation time. T1 relaxation times were obtained with a saturation-recovery pulse sequence.
PFG NMR measurements were accomplished on a Bruker 300 MHz spectrometer at a static field of 7.05 T. A stimulated-echo pulse sequence with bipolar gradients was used to measure the long-range translational motion of the 7Li ions. The temperature range assessed with the gradient probe is 25 to 80 °C. A pre-scan delay has been chosen based on the prior relaxation time measurements. The diffusion parameters were optimized before measurements in order to gain a visible drop of a signal intensity as a function of gradient strength. The diffusion times varied in the range 75–100 ms and the gradient duration was set between 3 and 4.5 ms.
Raman spectroscopy was performed on a LabRAM HR Evolution spectrometer (HORIBA Scientific) using a 100× magnification objective with an excitation wavelength of 632.81 nm. The spectral data were recorded with exposure times of 10 s over the wavenumber range of 100 to 1100 cm−1. All samples were measured in sealed glass capillaries. All Raman spectra were baseline corrected using the Horiba Labspec 6 software.
Electrochemical impedance measurements were performed using a BioLogic SP300 potentiostat at frequencies from 7 MHz to 1 Hz with a 10 mV sinusoidal amplitude. A sintered pellet was sandwiched between stainless steel cylinders, sputtered with Au, with a weight of 3 t. The ionic conductivity σ was calculated with σ = l/(A × R). l is the pellet thickness, A is the area and R is the resistance.
Prior to the EIS measurements, 150 mg powder was pressed for 10 minutes with 5 t and sintered for 10 h at 1100 °C after covering with mother powder in a MgO crucible.
Scanning electron microscopy images were recorded using a Zeiss Merlin microscope using 10 kV acceleration voltage.
3. Results and discussion
3.1 Crystal structure of commercial LLZO in garnet and hydrogarnet structure
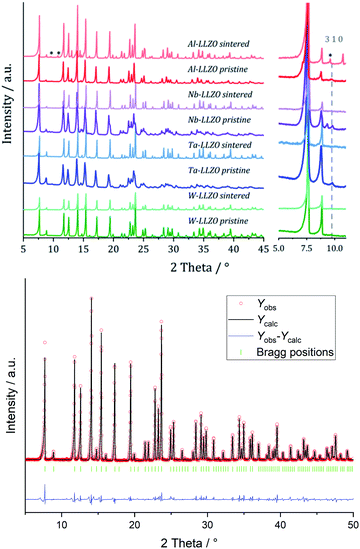
XRD and NPD patterns of commercial Al-, Nb- Ta-, and W-substituted LLZO together with corresponding Rietveld refinements are shown in Fig. 2, 3 and S1, S2.† The refinement reveals LLZO in garnet-type structure with symmetry Ia![[3 with combining macron]](https://www.rsc.org/images/entities/char_0033_0304.gif) d (space group no. 230) as the main phase for W-substituted LLZO with lattice parameter a = 12.934 Å. Both Li positions 24d and 96 h are refined to low occupancy in a free refinement.
d (space group no. 230) as the main phase for W-substituted LLZO with lattice parameter a = 12.934 Å. Both Li positions 24d and 96 h are refined to low occupancy in a free refinement.
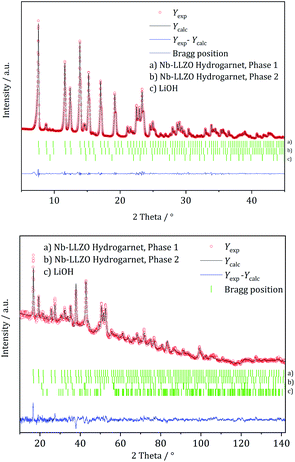 | ||
| Fig. 2 Rietveld co-refinement against, top: X-ray diffraction pattern (Mo Kα1) and bottom: neutron diffraction pattern (λ = 1.5482 Å) of commercial Nb-substituted LLZO. | ||
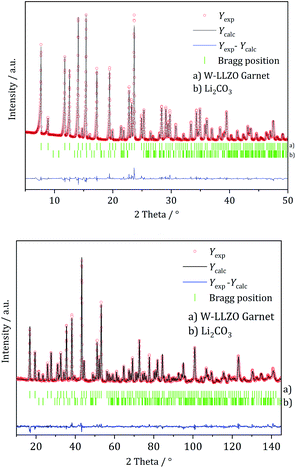 | ||
| Fig. 3 Rietveld co-refinement against, top: X-ray diffraction pattern (Mo Kα1) and bottom: neutron diffraction pattern (λ = 1.5482 Å) of commercial W-substituted LLZO. | ||
An attempt to refine the structural models using the diffraction data of Nb- and Ta-LLZO, applying a garnet-type structure model, could not accurately reproduce the data and the reflection 310 at 2θ = 9.9° could not be assigned. Additionally, a superposition of reflections in the X-ray diffraction data of Nb- and Ta-LLZO is observed. Eventually, a refinement with a hydrogarnet I![[4 with combining macron]](https://www.rsc.org/images/entities/char_0034_0304.gif) 3d model and two different lattice parameters describes the diffraction data precisely, revealing the structural inhomogeneity of the samples. The lattice parameters were refined to a = 13.104 Å and a′ = 12.985 Å for Nb-LLZO, and a = 13.104 and a′ = 13.013 Å for Ta-LLZO, respectively.
3d model and two different lattice parameters describes the diffraction data precisely, revealing the structural inhomogeneity of the samples. The lattice parameters were refined to a = 13.104 Å and a′ = 12.985 Å for Nb-LLZO, and a = 13.104 and a′ = 13.013 Å for Ta-LLZO, respectively.
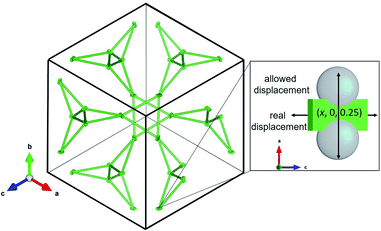
A chemical inhomogeneity in Ta-substituted LLZO was suspected by Yamada et al.30 A similar superposition of reflections from two LLZO phases with different lattice parameters was observed by Zeier et al.31 For Ta substituted LLZO, the phase model with the larger lattice parameter is refined to high Ta substitution and no occupancy of Li2. The phase model with the smaller lattice parameter however is refined to lower Ta amount and high occupancy of Li2. Due to the practically identical scattering cross-section of Nb and Zr, the evaluation of the Nb distribution between the two hydrogarnet phases is not possible from diffraction data. Because of the chemical similarity of Nb and Ta, however, it can be assumed that the Nb distribution is equal to that in the Ta-substituted LLZO: the large cell is Ta-poor, the small cell Ta-rich. The similar occupancy trend for Li is observed: in the larger cell, Li2 is refined to zero occupancy, in the smaller cell it is fully occupied. The structural details of Ta substituted hydrogarnet LLZO can be found in Table 2. A fully occupied Li2 position can be regarded as a bottleneck for bulk Li transport, as depicted in Fig. 4.
| Phase 1 | Phase 2 | |
|---|---|---|
| Space group | I![[4 with combining macron]](https://www.rsc.org/images/entities/char_0034_0304.gif) 3d 3d |
I![[4 with combining macron]](https://www.rsc.org/images/entities/char_0034_0304.gif) 3d 3d |
| Lattice parameter a, a′/Å | 13.104 | 13.013 |
![[thin space (1/6-em)]](https://www.rsc.org/images/entities/char_2009.gif) |
||
| Atomic coordinates Li1 12a | ||
| x | 0.37500 | 0.37500 |
| y | 0.00000 | 0.00000 |
| z | 0.25000 | 0.25000 |
| occ | 1 | 1 |
![[thin space (1/6-em)]](https://www.rsc.org/images/entities/char_2009.gif) |
||
| Atomic coordinates Li2 12b | ||
| x | — | 0.87500 |
| y | — | 0.00000 |
| z | — | 0.25000 |
| occ | — | 0.8(11) |
![[thin space (1/6-em)]](https://www.rsc.org/images/entities/char_2009.gif) |
||
| Atomic coordinates Li3 48e | ||
| x | 0.169(3) | 0.090(3) |
| y | 0.100(3) | 0.203(3) |
| z | 0.459(3) | 0.450(3) |
| occ | 0.6(11) | 0.9(11) |
![[thin space (1/6-em)]](https://www.rsc.org/images/entities/char_2009.gif) |
||
| Atomic coordinates Li4 48e | ||
| X | 0.380(5) | — |
| Y | 0.425(4) | — |
| Z | 0.098(4) | — |
| occ | 0.4(11) | — |
![[thin space (1/6-em)]](https://www.rsc.org/images/entities/char_2009.gif) |
||
| Atomic coordinates Zr 16c | ||
| x | −0.01370(15) | −0.00999(13) |
| y | −0.01370(15) | −0.00999(13) |
| z | −0.01370(15) | −0.00999(13) |
| occ | 0.524(7) | 0.552(6) |
![[thin space (1/6-em)]](https://www.rsc.org/images/entities/char_2009.gif) |
||
| Atomic coordinates Ta 16c | ||
| x | −0.01370(15) | −0.00999 |
| y | −0.01370(15) | −0.00999 |
| z | −0.01370(15) | −0.00999 |
| occ | 0.226(7) | 0.448(6) |
![[thin space (1/6-em)]](https://www.rsc.org/images/entities/char_2009.gif) |
||
| Atomic coordinates La 24d | ||
| x | 0.1171(2) | 0.1182(3) |
| y | 0.00000 | 0.00000 |
| z | 0.25000 | 0.25000 |
| occ | 1 | 1 |
![[thin space (1/6-em)]](https://www.rsc.org/images/entities/char_2009.gif) |
||
| Atomic coordinates O 48e | ||
| x | 0.0897(2) | 0.1128(4) |
| y | 0.1874(8) | 0.1864(4) |
| z | 0.2722(7) | 0.2700(4) |
| occ | 1 | 1 |
![[thin space (1/6-em)]](https://www.rsc.org/images/entities/char_2009.gif) |
||
| Atomic coordinates O 48e | ||
| x | 0.0359(7) | 0.0293(5) |
| y | 0.4419(9) | 0.4604(5) |
| z | 0.1382(8) | 0.1482(5) |
| occ | 1 | 1 |
![[thin space (1/6-em)]](https://www.rsc.org/images/entities/char_2009.gif) |
||
| Structural strain | ||
| dD/D ×10−4 | 47.65(3) | 58.8(10) |
Yet our data quality set limits the significance of the differences between the two phases to some extent. The proportion of the larger cell is overweighted with neutron data (2.2![[thin space (1/6-em)]](https://www.rsc.org/images/entities/char_2009.gif) :
:![[thin space (1/6-em)]](https://www.rsc.org/images/entities/char_2009.gif) 1) compared to X-ray data (1
1) compared to X-ray data (1![[thin space (1/6-em)]](https://www.rsc.org/images/entities/char_2009.gif) :
:![[thin space (1/6-em)]](https://www.rsc.org/images/entities/char_2009.gif) 1). We furthermore raise the point that the hydrogarnet phase, like cubic LLZO garnet, presumably requires a cationic substituent, since an unsubstituted hydrogarnet LLZO cubic phase has not yet been described in the literature.
1). We furthermore raise the point that the hydrogarnet phase, like cubic LLZO garnet, presumably requires a cationic substituent, since an unsubstituted hydrogarnet LLZO cubic phase has not yet been described in the literature.
Diffraction data of Al-LLZO can be described using both types of structures with a lattice parameter of a = 13.023 Å. Based on the crystallographic hydrogarnet structure published by Wagner and Rettenwander et al.,19 Al3+ is located on both a tetrahedrally coordinated position of Li1 and an octahedrally coordinated position of Zr. The total occupancy of the position is constrained to the defined stoichiometry detected using ICP-OES. In contrast, Nb5+, Ta5+ and W6+ are located on the octahedrally coordinated position of Zr4+ and the total occupancy of the position is constrained to the stoichiometry as described above. The results of the refinements are listed in Table 3.
| Substituent: stoichiometry | Crystal structure(s) | Lattice parameters a/Å | Structural strain [Δd/d × 10−4] |
|---|---|---|---|
| Al: Li6.25Al0.25La3Zr2O12 | Garnet/hydrogarnet | 13.023 | 16.28 |
| Nb: Li6.5La3Zr1.5Nb0.5O12 | Hydrogarnet/hydrogarnet | 13.104/12.985 | 37.93/64.50 |
| Ta: Li6.25La3Zr1.25Ta0.75O12 | Hydrogarnet/hydrogarnet | 13.104/13.013 | 47.66/55.64 |
| W: Li6.3La3Zr1.65W0.35O12 | Garnet | 12.934 | 26.09 |
Traces of anhydrous LiOH have also been noticed in NPD datasets for Al-LLZO (1 wt%) and Nb-LLZO (11 wt%). Reflections of crystalline Li2CO3 are detectable in NPD data of Al-LLZO (1 wt%), Ta-LLZO (3 wt%), and W-LLZO (2 wt%). 3 wt% crystalline La2Zr2O7 and 2 wt% La(OH)3 are found in Al-LLZO. Results of the crystallographic analysis and refinements of the synthesized samples can be found in the ESI in Fig. S4 and Table S3.†
3.2 Local structure
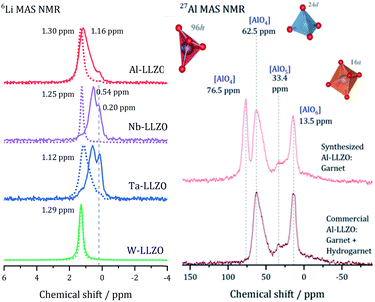
After demonstrating that commercial Al, Nb, and Ta substituted LLZO does not crystallize in the garnet structure as specified by the manufacturer, we synthesized LLZO samples with Al, Nb, Ta, and W substitution to provide a reference for all substituents in garnet structure.Fig. 5 presents the 6Li MAS NMR spectra of commercial and synthesized Al-, Nb-, Ta-, and W-LLZO. Strong differences can be observed in the line width of the peaks in the spectra. The peaks of hydrogarnet LLZO are broader than those of garnet LLZO, which points to stronger variations in the local environment around the Li site. In addition, the spectra of commercial Ta-, Nb- and Al-LLZO (hydrogarnet) represent at least two chemically inequivalent Li positions/environments. In contrast, all synthesized samples and the commercial W-LLZO show a different structural arrangement – a narrow 6Li peak is located at 1.12–1.3 ppm. This signal includes resonances from the Li sites in octahedral and tetrahedral environments in which fast exchange can occur. A similar chemical shift for unsubstituted garnet-type LLZO has been observed and discussed by Larraz et al.32
Two lithium sites in commercial Nb- and Ta-substituted LLZO can be distinguished. It can be assumed that the signal at 0.2 ppm stems from the additional highly occupied Li3 site featured in the hydrogarnet structure. The 6Li signals of the hydrogarnet structure in Nb-and Ta-LLZO (commercial samples) are shifted upfield compared to those of the garnet signals and occur at 0.54 and 0.58 ppm. The corresponding signals of Nb- and Ta-LLZO with garnet structure (synthesized samples) occur at 1.25 and 1.12 ppm. Synthesized Ta-LLZO shows a shoulder comparable to that of commercial Al-LLZO so we can assume the presence of both garnet and hydrogarnet structure. The assignment of the upfield signal to the tetrahedral and the low-field signal to the octahedral coordination made by van Wüllen33 is contradictive to our refinement, according to which these two positions are calculated to low values of occupancy. We assume that Li+, apart from the Li3 site in the hydrogarnet structure, is highly mobile and occupies two not clearly distinguishable sites.
The appearance of the 6Li NMR spectra correlates very well with the conclusions deduced from structural studies with XRD and neutron diffraction. However, we could not observe LiOH and Li2CO3 signals with NMR spectroscopy. The reason can be that the intensity of these signals is very small due to the low abundance and that signals are superimposed by the main phase resonances. The spectrum of LiOH and Li2CO3 can be found in the Fig. S5† in the EIS in agreement with Hu et al.34 The Raman spectra of LLZO, LiOH and Li2CO3 depicted in Fig. S3† can provide further information about LiOH and Li2CO3 as surface species.
The 27Al MAS spectra allow gaining further insight into the structure of Al-LLZO. The 27Al spectra of the commercial and synthesized samples are depicted in Fig. 5 on the right. The commercial sample exhibits Al in three different coordinations: tetrahedral 24d, fivefold and octahedral coordination of Al by O-atoms. In contrast, an additional signal at 76.5 ppm can be assigned to a 96h position that is also tetrahedrally coordinated in the synthesized Al-LLZO.35 There are no significant indications for Al-containing side phases, so we assume a multiple substitution of Li1 24d, Li2 96h, and Zr 16a by Al. As described by Buschmann et al., it was not possible to locate the octahedrally coordinated Al in the crystal structure with our diffraction data either.36
3.3 Structural conversion
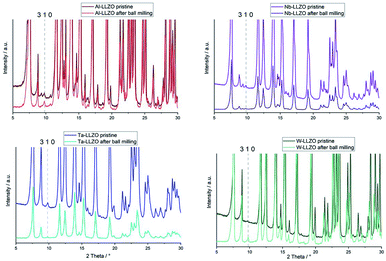
Only the commercial W-LLZO and all of the synthesized reference samples are present in the expected garnet structure as demonstrated by XRD, NPD and NMR. This indicates that not the substitution of aliovalent cations itself leads to the observed symmetry reduction, but an additional treatment of the samples. Routinely, these samples are ball milled after synthesis to achieve a better homogeneity of the samples, therefore, we had a closer look on the ball milling process.No additional reflections are observed with XRD after ball milling of Nb- and Ta-substituted LLZO (Fig. 6). A decrease in the reflection intensities is due to a loss of crystallinity after the harsh mechanical treatment. Additionally, no further separation of the two cubic phases in each material can be noted. The characteristic 310 hydrogarnet reflection is still observed after ball milling, revealing that the hydrogarnet structure is preserved during the mechanical treatment.
No clear statement about a phase transition between garnet and hydrogarnet of Al-LLZO is possible with the data displayed in Fig. 6. Besides the missing assignment of the pristine phase, the determination of the phase is additionally hindered by superimposing peaks of Li2CO3.
Ball milling the garnet-structured W-LLZO, however, results in the formation of the hydrogarnet structure, as depicted in Fig. 6 and 7. This leads to the conclusion that the commercial samples have already been milled by the supplier, except for the W sample. After ball milling of the W-LLZO, its diffraction pattern can be modelled with two hydrogarnet phases with different lattice parameters, likewise to the Nb- and Ta-substituted hydrogarnet LLZO.
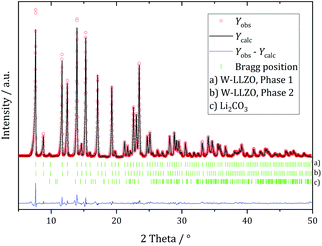 | ||
| Fig. 7 Rietveld refinement based on diffraction data of W-substituted LLZO after 1 h ball milling with a hydrogarnet model. | ||
We performed XRD measurements on subsequently sintered commercial samples as collected in Fig. 8. It can be concluded that the sintering procedure (10 h at 1100 °C in air resp. motherpowder) results in a complete conversion into the garnet structure independent from the pristine state (hydrogarnet or garnet), crystallinity, or substituting element. The impurities in the Al-LLZO sample result in a large number of secondary phases after sintering. A refinement of a diffraction pattern is exemplarily shown in Fig. 8 for sintered commercial Ta-LLZO.
3.4 Origins of the structural difference from a crystallographic perspective
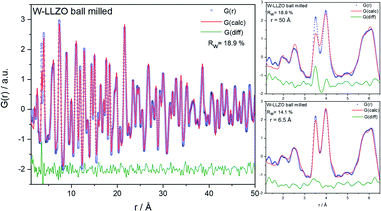
To investigate the ball milling process in detail we focus on the phase pure W-LLZO, which was not yet ball milled. While the symmetry reduction causes only minor changes in the XRD pattern, bearing the risk of being overlooked, the local structural changes are more obvious. In Fig. 9 the low r (<5 Å) region of the PDFs acquired after all three synthesis steps (pristine, ball milled, and sintered) are displayed. The differences below 3 Å are small and the corresponding distances are hard to distinguish from each other. The two peaks corresponding to [Zr/W–La] and [La–La] distances, however, differ clearly in the PDF of the ball milled sample. While the peak at 3.98 Å only changes its intensity, the one at 3.62 Å shifts to 3.50 Å. In the garnet structure, Zr/W and La occupy the special Wyckoff sites 16a (0, 0, 0) and 24c (1/8, 0, 1/4), respectively. Therefore, the [Zr/W–La] distance can only be reduced by a reduction of the symmetry. This is the case in the hydrogarnet structure, where the 16c site becomes (x, x, x) and 24d (x, 0, 1/4), respectively. Fitting the PDF (Fig. 10) in a so-called real space Rietveld approach (small box modelling), reveals that the hydrogarnet structure is a suitable model that fits the observed PDF sufficiently well on a large r scale (50 Å). Nevertheless, a closer look at the above mentioned low-r part reveals the inability of an averaged model to fully describe the short-range order, even if two models are used as described for XRD and NPD. Especially, the intensity of the peak at 3.50 Å is not reproduced well in the modelled PDF. Only a model with strongly anisotropic displacement factors of the La cations sufficiently fits the peak. Increasing the r range above 6.5 Å, results in a decrease of the anisotropy and simultaneously a decrease of the intensity, revealing that this is a local phenomenon. Keeping in mind that the short-range order was altered by ball milling only, it is likely that local lattice distortions are the root cause for this finding and not a chemical short-range order by substitution.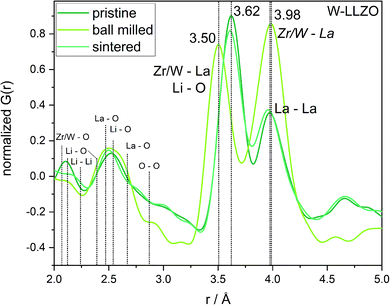 | ||
| Fig. 9 Zoom into short-range normalized pair distribution functions of W-LLZO before (pristine), after ball milling (ball milled) and after sintering at 1100 °C for 10 h (sintered), respectively. Corresponding long-range PDFs are given in the ESI in Fig. S6.† | ||
The La sublattice consists of corner sharing triangles depicted in Fig. 11. The only possible displacement of La is in the x direction. This is exemplified in Fig. 11 by two additional grey atoms occupying (0.10, 0, 0.25) and (0.15, 0, 0.25), respectively. The displacement factor in green, however, indicates a displacement perpendicular to the one allowed by the symmetry constraints. This implies that the local symmetry could even be lower than the global I![[4 with combining macron]](https://www.rsc.org/images/entities/char_0034_0304.gif) 3d. The discrepancy between local and global symmetry leads to a geometrically frustrated system concerning the La sublattice.
3d. The discrepancy between local and global symmetry leads to a geometrically frustrated system concerning the La sublattice.
A comparison of the structural models used for pristine W-LLZO and sintered W-LLZO using the program compstru (Bilbao Server of crystallography), yields the measure of similarity (0.001) and the degree of lattice distortion (0.0012).37,38 This confirms the already observed recovery of the garnet structure after the additional sintering step. Details and a comparison of all other structural models used in PDF analysis are given in the ESI.†
3.5 Local Li ion hopping
NMR spectroscopy provides a variety of techniques to investigate ion dynamics in a wide range of time scales. The local hopping of Li ions on time scales of some ns can be investigated by temperature-dependent measurements of the so-called spin-lattice relaxation rate T1−1. This hopping causes fluctuations in the local magnetic/electric fields at the sites of the Li nuclei that in turn induce transitions between the nuclear Zeeman levels and thus result in effective relaxation of the nuclear polarization. This relaxation is most effective when the average hoping rate of the Li ions equals the resonance frequency of the Li nuclei (τ−1 ≈ ωL). For the case of isotropic and uncorrelated motion of the Li ions, the overall temperature dependence of the relaxation rate T1−1 can be described according to Bloembergen, Purcell and Pound.39–41
 | (1) |
 | (2) |
 | (3) |
 | (4) |
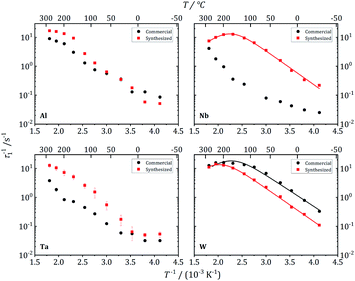 | ||
| Fig. 12 7Li NMR relaxation rates T1−1 vs. inverse temperature for commercial and synthesized Al-, Nb-, Ta-, and W-substituted LLZO. Solid lines show fits according to eqn (1) and (2). | ||
| Sample | EA/eV | τ−1/s−1 | D/m2 s−1 | σ/S cm−1 |
|---|---|---|---|---|
| Garnet Nb-LLZO, synthesized | 0.23 | 2.5 × 10⁷ | 1.3 × 10⁻¹³ | 1.8 × 10⁻⁴ |
| Garnet W-LLZO, commercial | 0.22 | 3.1 × 10⁷ | 1.6 × 10⁻¹³ | 2.3 × 10⁻⁴ |
| Garnet W-LLZO, synthesized | 0.23 | 1.4 × 10⁷ | 7.1 × 10⁻¹⁴ | 1.0 × 10⁻⁴ |
These three garnet-structured samples reveal similar local dynamics with estimated Li conductivities in the range between 0.23 and 0.50 mS cm−1. For the other samples that crystallize in the hydrogarnet structure, the maximum in T1−1(T−1) occurs at higher temperatures outside the experimentally accessible temperature range, indicating slower local dynamics of the Li ions. An exception is the Al-LLZO synthesized reference sample, crystallizing in the garnet structure, but featuring a slower Li hopping than the other garnet samples. The Al atoms, in contrast to Nb, Ta and W, occupy Li positions, as we have proven by 27Al NMR, which could be a reason for hindered local Li diffusion.
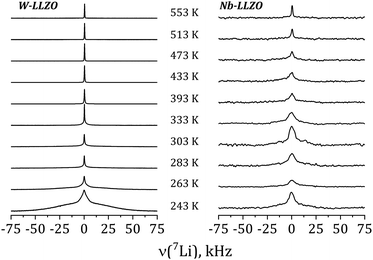
Further insights into the dynamics of the Li ions on time scales of some ms can be obtained by the temperature dependence of static 7Li NMR spectra (nuclear spin I = 3/2). Fig. 13 shows exemplarily the spectra of commercial W-LLZO and Nb-LLZO for temperatures between 243 K and 553 K.
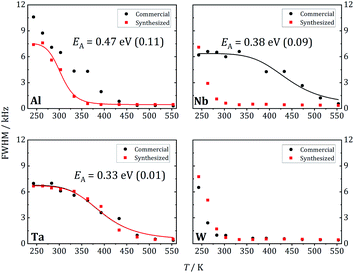
At 243 K, a broad contribution is visible for W-LLZO in the range ±50 kHz corresponding to the quadrupolar satellites, i.e. the nuclear spin transitions |+3/2〉 ↔ |+1/2〉 and |−1/2〉 ↔ |−3/2〉. On top of this broader contribution, a narrower signal is visible with a width of about 8 kHz corresponding to the central transition |+1/2〉 ↔ |−1/2〉. With increasing temperature, a so-called motional narrowing is visible, i.e. a reduction of the width of both contributions to the spectrum. This narrowing occurs when the average hopping rate of the ions/nuclei exceeds the width of the spectral components resulting in temporal averaging of the local environments around the Li nuclei on time scales of the inverse line width. The line width (full width at half maximum = FWHM) is shown for all samples in Fig. 14, again for temperatures between 243 K and 553 K. For some samples, e.g., commercial and synthesized Ta-LLZO, a clear step-like behaviour is observed. At low temperatures, a plateau is visible with a width of about 7 kHz, representing the strength of interactions of the 7Li nuclei with their environment. At temperatures between 350 K and 450 K, the motional narrowing can be observed. Above 450 K, a high-temperature plateau with a width of about 0.5 kHz is visible which just reflects the inhomogeneity of the external magnetic field.
The overall temperature dependence of the line Δν width can be described with the empirical expression by Hendrickson and Bray:44
 | (5) |
3.6 Li diffusion
The long-range transport of the Li ions was investigated by 7Li PFG NMR measurements on the garnet LLZO samples, see Table 5. For the other samples, diffusion was not fast enough to get meaningful signals. Fig. 15 shows the results for commercial W-LLZO for temperatures between 313 K and 343 K. The echo damping I/I0 as a function of the gradient strength g can be well described with a Gaussian function, as expected from the Stejskal–Tanner equation.45 The extracted diffusion coefficients are listed in Table 5. The Li conductivity can again be calculated from the diffusion coefficients according to eqn (4). Overall, we see faster Li mobility for garnet LLZO in comparison to hydrogarnet LLZO. A good agreement is obtained for the Li conductivity and the activation barriers when comparing T1−1 measurements (ns time scale) with motional narrowing (ms) and PFG NMR (75 ms).| Sample | D/m2 s−1 | EA/eV | σ/S cm−1 |
|---|---|---|---|
| Garnet Nb-LLZO, synthesized | (0.28 ± 0.16) × 10−13 | 0.45 ± 0.15 | 4.0 × 10⁻⁵ |
| Garnet W-LLZO, commercial | (0.78 ± 0.11) × 10−13 | 0.35 ± 0.05 | 1.1 × 10⁻⁴ |
| Garnet W-LLZO, synthesized | (0.96 ± 0.69) × 10−13 | 0.26 ± 0.23 | 1.4 × 10⁻⁴ |
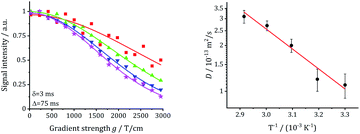 | ||
| Fig. 15 Echo damping vs. gradient field strength g and extracted diffusion coefficients for commercial W-LLZO. | ||
Using the approach described in the relaxation studies section, the diffusion coefficients can be transformed into conductivities. These values are also included in the tables and can be compared with the data obtained by impedance spectroscopy.
Impedance measurements at 25, 35, and 45 °C of sintered Nb-, Ta-, and W-LLZO pellets and equivalent circuits are depicted in Fig. S8–S10.† The Li+ conductivity is extracted from R2 and listed in Table 6. No data could be measured for sintered commercial Al-LLZO, probably due to the high degree of La2Zr2O7 impurity. We calculated an activation energy for Lithium diffusion with an Arrhenius approach according to eqn (6).
 | (6) |
| Sample | σ/S cm−1 | EA/eV |
|---|---|---|
| Nb-LLZO, commercial | 1.3 × 10⁻⁴ | 0.33 |
| Nb-LLZO, synthesized | 8.4 × 10⁻⁵ | 0.37 |
| Ta-LLZO, commercial | 1.8 × 10⁻⁴ | 0.39 |
| W-LLZO, commercial | 6.1 × 10⁻⁵ | 0.33 |
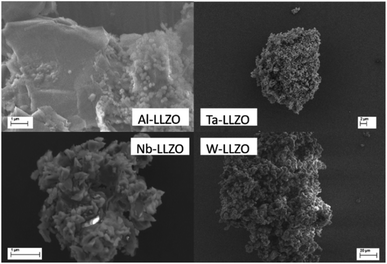
The conductivities are lower than the highest conductivities reported for each substituent: Nb-LLZO,16 Ta-LLZO,17 W-LLZO,18 which we attribute to the relatively shorter sintering time and lower sintering temperature, which in turn can result in a higher concentration of grain boundaries. Based on the same sintering procedure, we can estimate a slightly lower conductivity for W-LLZO and a slightly higher activation energy of Li diffusion in Ta-LLZO compared to literature values. The comparison of the conductivities obtained with two independent techniques, NMR and impedance, show good agreement. The activation energies are similar, despite a higher experimental error due to the data scattering in PFG-experiments. The conductivities are also of the same order of magnitude. The majority of the particle sizes observed with SEM are larger than the diffusion distance probed during the PFG signal decay at Δt = 75 ms, corresponding to displacements of several micrometers46 as pictured in Fig. 16. We note that the EIS results of Nb-LLZO and Ta-LLZO refer to the garnet structure due to the phase transition during sintering.
A lower activation energy for Li diffusion in Nb-substituted LLZO in comparison with Ta-substitution has also been measured by Thangadurai et al.47
4. Conclusions
We investigated the formation of a hydrogarnet structure starting from garnet LLZO with Al, Nb, Ta, and W substitution with XRD, NPD, total scattering PDF, 6Li and 27Al MAS NMR. Ball milling transforms the higher symmetric garnet structure to the hydrogarnet structure and annealing causes the reverse effect. The formation of the hydrogarnet structure does not seem to depend on the substituting cation. The two crystal structures can be distinguished by diffraction methods due to the symmetry reduction Ia![[3 with combining macron]](https://www.rsc.org/images/entities/char_0033_0304.gif) d → I
d → I![[4 with combining macron]](https://www.rsc.org/images/entities/char_0034_0304.gif) 3d, i.e., a loss of the threefold inversion axis in the hydrogarnet structure. PDF analysis shows a distortion of the octahedral MO6 (M = Al, Zr, Nb, Ta, W) coordination in the hydrogarnet. With 6Li MAS NMR, we observe two different local environments of Li in the hydrogarnet structure and one in the garnet, as expected from the XRD and NPD results. The hydrogarnet structure offers an additional Li site that is highly occupied and therefore is supposed to slow down the Li diffusion. The Li diffusion in the hydrogarnet structure was measured on different time/length scales from single local jumps to bulk and long-range conductivity with 7Li T1 relaxation and motional line narrowing NMR. Both methods reveal that the local mobility of Li in hydrogarnet LLZO is inferior to that of garnet LLZO. Regardless of the type of substituting cation, care must be taken with LLZO garnet that mechanical treatment does not unintentionally transform the structure into hydrogarnet, which has a lower Li ion conductivity.
3d, i.e., a loss of the threefold inversion axis in the hydrogarnet structure. PDF analysis shows a distortion of the octahedral MO6 (M = Al, Zr, Nb, Ta, W) coordination in the hydrogarnet. With 6Li MAS NMR, we observe two different local environments of Li in the hydrogarnet structure and one in the garnet, as expected from the XRD and NPD results. The hydrogarnet structure offers an additional Li site that is highly occupied and therefore is supposed to slow down the Li diffusion. The Li diffusion in the hydrogarnet structure was measured on different time/length scales from single local jumps to bulk and long-range conductivity with 7Li T1 relaxation and motional line narrowing NMR. Both methods reveal that the local mobility of Li in hydrogarnet LLZO is inferior to that of garnet LLZO. Regardless of the type of substituting cation, care must be taken with LLZO garnet that mechanical treatment does not unintentionally transform the structure into hydrogarnet, which has a lower Li ion conductivity.
Author contributions
Charlotte Fritsch: conceptualization, investigation (XRD, EIS, Raman), writing – original draft; Tatiana Zinkevich: investigation (Li NMR: relaxation, motional narrowing, PFG-NMR); Sylvio Indris: investigation (NMR: 6Li MAS, 27Al MAS); Martin Etter: supervision (synchrotron), writing – review & editing; Volodymyr Baran: investigation (NPD); Thomas Bergfeldt: investigation (ICP-OES); Michael Knapp: project administration, funding acquisition, writing – review & editing; Helmut Ehrenberg: investigation (XRD), funding acquisition & administration; Anna-Lena Hansen: investigation (PDF), supervision, writing – review & editing.Conflicts of interest
There are no conflicts to declare.Acknowledgements
Financial support from Federal Ministry of Education and Research (BMBF) within the FestBatt project (03XP0176A) is gratefully acknowledged. This work contributes to the research performed at CELEST (Center for Electrochemical Energy Storage Ulm-Karlsruhe). We acknowledge DESY (Hamburg, Germany), a member of the Helmholtz Association HGF, for the provision of beamtime at beamline P02.1 at Petra III.References
- D. Mazza, Mater. Lett., 1988, 7, 205–207 CrossRef CAS.
- H. Hyooma and K. Hayashi, Mater. Res. Bull., 1988, 23, 1399–1407 CrossRef CAS.
- R. Murugan, V. Thangadurai and W. Weppner, Angew. Chem., Int. Ed., 2007, 46, 7778–7781 CrossRef CAS PubMed.
- K. Subramanian, G. V. Alexander, K. Karthik, S. Patra, M. S. Indu, O. V Sreejith, R. Viswanathan, J. Narayanasamy and R. Murugan, J. Energy Storage, 2021, 33, 102157 CrossRef.
- C. Wang, K. Fu, S. P. Kammampata, D. W. McOwen, A. J. Samson, L. Zhang, G. T. Hitz, A. M. Nolan, E. D. Wachsman and Y. Mo, et al., Chem. Rev., 2020, 120, 4257–4300 CrossRef CAS PubMed.
- L. Xu, J. Li, W. Deng, H. Shuai, S. Li, Z. Xu, J. Li, H. Hou, H. Peng and G. Zou, et al., Adv. Energy Mater., 2021, 11, 2000648 CrossRef CAS.
- B. Kozinsky, S. A. Akhade, P. Hirel, A. Hashibon, C. Elsässer, P. Mehta, A. Logeat and U. Eisele, Phys. Rev. Lett., 2016, 116, 1–5 CrossRef PubMed.
- X. He, Q. Bai, Y. Liu, A. M. Nolan, C. Ling and Y. Mo, Adv. Energy Mater., 2019, 9, 1–12 Search PubMed.
- D. Di Stefano, A. Miglio, K. Robeyns, Y. Filinchuk, M. Lechartier, A. Senyshyn, H. Ishida, S. Spannenberger, D. Prutsch and S. Lunghammer, et al., Chem, 2019, 5, 2450–2460 CAS.
- B. Kozinsky, Handb. Mater. Model., 2018, 1–20 Search PubMed.
- S. Adams and R. P. Rao, J. Mater. Chem., 2012, 22, 1426–1434 RSC.
- R. Schlem, C. F. Burmeister, P. Michalowski, S. Ohno, G. F. Dewald, A. Kwade and W. G. Zeier, Adv. Energy Mater., 2021, 11, 2101022 CrossRef CAS.
- X. Liu, R. Garcia-Mendez, A. R. Lupini, Y. Cheng, Z. D. Hood, F. Han, A. Sharafi, J. C. Idrobo, N. J. Dudney, C. Wang, C. Ma, J. Sakamoto and M. Chi, Nat. Mater., 2021 DOI:10.1038/s41563-021-01019-x.
- R. Sudo, Y. Nakata, K. Ishiguro, M. Matsui, A. Hirano, Y. Takeda, O. Yamamoto and N. Imanishi, Solid State Ionics, 2014, 262, 151–154 CrossRef CAS.
- A. Wachter-Welzl, J. Kirowitz, R. Wagner, S. Smetaczek, G. C. Brunauer, M. Bonta, D. Rettenwander, S. Taibl, A. Limbeck and G. Amthauer, et al., Solid State Ionics, 2018, 319, 203–208 CrossRef CAS.
- J. Gai, E. Zhao, F. Ma, D. Sun, X. Ma, Y. Jin, Q. Wu and Y. Cui, J. Eur. Ceram. Soc., 2018, 38, 1673–1678 CrossRef CAS.
- H. Buschmann, S. Berendts, B. Mogwitz and J. Janek, J. Power Sources, 2012, 206, 236–244 CrossRef CAS.
- Y. Li, Z. Wang, Y. Cao, F. Du, C. Chen, Z. Cui and X. Guo, Electrochim. Acta, 2015, 180, 37–42 CrossRef CAS.
- R. Wagner, G. J. Redhammer, D. Rettenwander, A. Senyshyn, W. Schmidt, M. Wilkening and G. Amthauer, Chem. Mater., 2016, 28, 1861–1871 CrossRef CAS PubMed.
- R. Wagner, G. J. Redhammer, D. Rettenwander, G. Tippelt, A. Welzl, S. Taibl, J. Fleig, A. Franz, W. Lottermoser and G. Amthauer, Chem. Mater., 2016, 28, 5943–5951 CrossRef CAS PubMed.
- L. Robben, E. Merzlyakova, P. Heitjans and T. M. Gesing, Acta Crystallogr., Sect. E: Crystallogr. Commun., 2016, 72, 287–289 CrossRef CAS PubMed.
- M. Hoelzel, A. Senyshyn, N. Juenke, H. Boysen, W. Schmahl and H. Fuess, Nucl. Instrum. Methods Phys. Res., Sect. A, 2012, 667, 32–37 CrossRef CAS.
- J. Rodríguez-Carvajal, An Introduction to the Program FullProf, 1993 Search PubMed.
- A. C. Dippel, H. P. Liermann, J. T. Delitz, P. Walter, H. Schulte-Schrepping, O. H. Seeck and H. Franz, J. Synchrotron Radiat., 2015, 22, 675–687 CrossRef CAS PubMed.
- J. Filik, A. W. Ashton, P. C. Y. Chang, P. A. Chater, S. J. Day, M. Drakopoulos, M. W. Gerring, M. L. Hart, O. V Magdysyuk and S. Michalik, et al., J. Appl. Crystallogr., 2017, 50, 959–966 CrossRef CAS PubMed.
- P. Juhás, T. Davis, C. L. Farrow and S. J. L. Billinge, J. Appl. Crystallogr., 2013, 46, 560–566 CrossRef.
- C. L. Farrow, P. Juhas, J. W. Liu, D. Bryndin, E. S. Boin, J. Bloch, T. Proffen and S. J. L. Billinge, J. Phys.: Condens. Matter, 2007, 19, 335219 CrossRef CAS PubMed.
- A. Stukowski and K. Albe, Modell. Simul. Mater. Sci. Eng., 2010, 18, 085001 CrossRef.
- J. Awaka, A. Takashima, K. Kataoka, N. Kijima, Y. Idemoto and J. Akimoto, Chem. Lett., 2011, 40, 60–62 CrossRef CAS.
- H. Yamada, T. Ito, R. Hongahally Basappa, R. Bekarevich and K. Mitsuishi, J. Power Sources, 2017, 368, 97–106 CrossRef CAS.
- W. G. Zeier, S. Zhou, B. Lopez-Bermudez, K. Page and B. C. Melot, ACS Appl. Mater. Interfaces, 2014, 6, 10900–10907 CrossRef CAS PubMed.
- G. Larraz, A. Orera, J. Sanz, I. Sobrados, V. Diez-Gómez and M. L. Sanjuán, J. Mater. Chem. A, 2015, 3, 5683–5691 RSC.
- L. Van Wüllen, T. Echelmeyer, H. W. Meyer and D. Wilmer, Phys. Chem. Chem. Phys., 2007, 9, 3298–3303 RSC.
- J. Z. Hu, J. H. Kwak, Z. Yang, W. Osborn, T. Markmaitree and L. L. Shaw, J. Power Sources, 2008, 182, 278–283 CrossRef CAS.
- D. Rettenwander, J. Langer, W. Schmidt, C. Arrer, K. J. Harris, V. Terskikh, G. R. Goward, M. Wilkening and G. Amthauer, Chem. Mater., 2015, 27, 3135–3142 CrossRef CAS.
- H. Buschmann, J. Dölle, S. Berendts, A. Kuhn, P. Bottke, M. Wilkening, P. Heitjans, A. Senyshyn, H. Ehrenberg and A. Lotnyk, et al., Phys. Chem. Chem. Phys., 2011, 13, 19378–19392 RSC.
- G. de la Flor, D. Orobengoa, E. Tasci, J. M. Perez-Mato and M. I. Aroyo, J. Appl. Crystallogr., 2016, 49, 653–664 CrossRef CAS.
- G. Bergerhoff, M. Berndt, K. Brandenburg and T. Degen, Acta Crystallogr., Sect. B: Struct. Sci., 1999, 55, 147–156 CrossRef PubMed.
- P. Heitjans and S. Indris, J. Phys.: Condens. Matter, 2003, 15, R1257 CrossRef CAS.
- M. Kaus, H. Stöffler, M. Yavuz, T. Zinkevich, M. Knapp, H. Ehrenberg and S. Indris, J. Phys. Chem. C, 2017, 121, 23370–23376 CrossRef CAS.
- M. Kaus, M. Guin, M. Yavuz, M. Knapp, F. Tietz, O. Guillon, H. Ehrenberg and S. Indris, J. Phys. Chem. C, 2017, 121, 1449–1454 CrossRef CAS.
- A. Einstein, Ann. Phys., 1905, 322, 549–560 CrossRef.
- M. von Smoluchowski, Ann. Phys., 1906, 326, 756–780 CrossRef.
- J. R. Hendrickson and P. J. Bray, J. Magn. Reson., 1973, 9, 341–357 CAS.
- E. O. Stejskal and J. E. Tanner, J. Chem. Phys., 1965, 42, 288–292 CrossRef CAS.
- H. Stöffler, T. Zinkevich, M. Yavuz, A. Senyshyn, J. Kulisch, P. Hartmann, T. Adermann, S. Randau, F. H. Richter and J. Janek, et al., J. Phys. Chem. C, 2018, 122, 15954–15965 CrossRef.
- V. Thangadurai, H. Kaack and W. J. F. Weppner, J. Am. Ceram. Soc., 2003, 86, 437–440 CrossRef CAS.
Footnote |
| † Electronic supplementary information (ESI) available. See DOI: 10.1039/d1ra05961k |
| This journal is © The Royal Society of Chemistry 2021 |

