 Open Access Article
Electrochemical properties of La0.5Sr0.5Fe0.95Mo0.05O3−δ as cathode materials for IT-SOEC
Yunting Houab,
Yadun Wanga,
Lijun Wang *a,
Qifei Zhanga and
Kuo-chih Choub
aCollaborative Innovation Center of Steel Technology, University of Science and Technology Beijing, Beijing, 100083, China. E-mail: lijunwang@ustb.edu.cn
bState Key Laboratory of Advanced Metallurgy, University of Science and Technology Beijing, Beijing, 100083, China
First published on 28th September 2021
Abstract
Solid oxide electrolysis cells (SOECs) are a new type of high-efficiency energy conversion device that can electrolyze CO2 efficiently and convert electricity into chemical energy. However, the lack of efficient and stable cathodes hinders the practical application of CO2 electrolysis in SOECs. Herein, a novel perovskite oxide La0.5Sr0.5Fe0.95Mo0.05O3−δ (LSFMo) is synthesized and used as a cathode for SOECs. The introduction of Mo significantly improves the CO2 tolerance of the material in a reducing atmosphere and solves the problem of SrCO3 generation in the La0.5Sr0.5FeO3−δ material. Mo ion doping promotes the conductivity in a reducing atmosphere and increases the oxygen deficiencies of the material, which lowers the ohmic resistance (Rs) of the material and significantly improves the CO2 adsorption and dissociation in the middle-frequency of polarization resistance (Rp). For example, Rp decreases from 0.49 to 0.24 Ω cm2 at 800 °C under 1.2 V. Further, the reduction of Rs and Rp increases the performance improvement, and the current density is increased from 1.56 to 2.13 A cm−2 at 800 °C under 2 V. Furthermore, LSFMo shows reasonable short-term stability during the 60 h stability test.
Introduction
With the massive burning of fossil fuels, environmental problems caused by CO2 have become more serious. To mitigate the CO2 release, a large amount of CO2 catalysis research has been carried out, such as photocatalytic CO2 conversion of TiO2,1,2 and electrocatalysis of nanomaterials and perovskite material.3–5 Particularly, the solid oxide electrolysis cells (SOECs) exhibit good application prospects due to their excellent reaction rate and variety of products under high operating temperatures.5 The SOECs technology can not only reduce CO2 emission, but also promote the sustainable development of the economy. The ohmic resistance (Rs) of SOECs is affected by the conductivity of the electrolyte and the electrode, and the polarization resistance (Rp) is caused by the catalytic reaction of the cathode and anode. Compared with the anode, the polarization produced by the cathode is dominant during the entire electrolysis process. Thus, the cathode materials need excellent catalytic activity and good stability.6Conventional nickel-yttrium stabilized zirconia (Ni-YSZ) exhibits excellent performance for CO2 electrolysis due to the high electrical conductivity and catalytic activity.7–9 However, the electrode is instability in the long-term redox working process and easy to be oxidized by CO2 at high temperature. Moreover, the problems of particle agglomeration and carbon deposition also lead to the decline of electrolytic performance.9–12 Recently, perovskite materials have attracted wide attention due to excellent redox stability, flexible composition, sulfur resistance and carbon resistance. The perovskite materials could meet the needs of complex working conditions by selecting different elements at the A and B sites, respectively. The SOECs cathode are exposed in reducing environment, so the materials are basically selected from anode materials of solid oxide fuel cells, including Ti-, Fe- and Cr-based perovskite oxides,13,14 such as La0.75Sr0.25Cr0.5Mn0.5O3−δ, LaxSr1−xTiO3−δ, La0.8Sr0.2FeO3−δ, and Sr2Fe1.5Mo0.5O6−δ.15–17
Compared with Cr-based and Mn-based materials, Fe-based materials exhibit stronger catalytic activity due to their high oxygen vacancies and ionic conductivity, suggesting they are potential substitutes for Ni-YSZ.14,16 However, the poor stability in reducing atmosphere leads to the phase decomposition and SrCO3 generation when Fe-based materials are used as fuel electrode of solid oxide cells, which affect the cell performance and operation stability. The structure of perovskite could be stabilized by doping high-valent elements at the B site, which makes the Fe-based perovskite keep good reduction stability and CO2 tolerance so that it meets the requirements of SOECs cathode.17–20
In this work, a small quantity of Mo is introduced into the B site of La0.5Sr0.5FeO3−δ (LSF) to partly substitute Fe, and the La0.5Sr0.5Fe0.95Mo0.05O3−δ (LSFMo) material is synthesized by a solid-phase method. The crystal structure and electrical conductivity of LSFMo material in oxidizing and reducing atmosphere are tested and discussed by X-ray photoelectron spectroscopy (XPS) analysis. The electrochemical performance and stability of cells supported by La0.8Sr0.2Ga0.83Mg0.17O3−δ (LSGM) electrolyte are studied.
Experimental
Power synthesis
The LSF and LSFMo materials were synthesized by the solid-state reaction method with La2O3, SrCO3, Fe2O3, and MoO3 as the raw materials. Each of powders was weighed with stoichiometric amounts and mixed by ball-milling with ethanol for 10 h. After drying at 80 °C for 2 h, the mixture was pressed into pellets and roasted at 1250 °C for 10 h. Finally, the samples were crushed and ground into powder.The LSGM powder was synthesized by the same technological process. The dense electrolyte pellets were obtained by pressing powder and sintering at 1450 °C in air for 10 h.
Sample preparation
In the case of the conductivity test, the LSF and LSFM powders were mixed with polyvinyl alcohol (PVA) binder and pressed into rectangular samples. The dense bars were obtained by sintered at 1400 °C in air for 6 h. During the preparation of the electrolysis cells, the cathode slurries were made by mixing the powders with isopropyl alcohol, ethylene glycol and glycerin (10![[thin space (1/6-em)]](https://www.rsc.org/images/entities/char_2009.gif) :
:![[thin space (1/6-em)]](https://www.rsc.org/images/entities/char_2009.gif) 2
2![[thin space (1/6-em)]](https://www.rsc.org/images/entities/char_2009.gif) :
:![[thin space (1/6-em)]](https://www.rsc.org/images/entities/char_2009.gif) 1) for 1 h. Similarly, the La0.6Sr0.4Co0.2Fe0.8O3−δ (LSCF) and Gd0.2Ce0.8O2 (GDC) were mixed with 1
1) for 1 h. Similarly, the La0.6Sr0.4Co0.2Fe0.8O3−δ (LSCF) and Gd0.2Ce0.8O2 (GDC) were mixed with 1![[thin space (1/6-em)]](https://www.rsc.org/images/entities/char_2009.gif) :
:![[thin space (1/6-em)]](https://www.rsc.org/images/entities/char_2009.gif) 1 ratio to form anode slurry. The LSGM pellets with 300 μm thickness were used as the supporter, and the LSF(LSFMo) and LSCF-GDC slurries were sprayed on the two sides of electrolyte. The template with 0.26 cm2 area was used to keep the effective area of the electrode. The sprayed cells (LSF(LSFMo)|LSGM|LSCF-GDC) were calcined at 1000 °C for 2 h to make the electrodes appear loose and porous structure. The Ag paste was drawn on both sides of the electrode as collector to test performance.
1 ratio to form anode slurry. The LSGM pellets with 300 μm thickness were used as the supporter, and the LSF(LSFMo) and LSCF-GDC slurries were sprayed on the two sides of electrolyte. The template with 0.26 cm2 area was used to keep the effective area of the electrode. The sprayed cells (LSF(LSFMo)|LSGM|LSCF-GDC) were calcined at 1000 °C for 2 h to make the electrodes appear loose and porous structure. The Ag paste was drawn on both sides of the electrode as collector to test performance.
Characterization and test
The phase structure of the materials was characterized by X-ray diffraction (XRD) in the range of 20–80°. The LSF and LSFMo samples were placed in CO2![[thin space (1/6-em)]](https://www.rsc.org/images/entities/char_2009.gif) :
:![[thin space (1/6-em)]](https://www.rsc.org/images/entities/char_2009.gif) CO = 1
CO = 1![[thin space (1/6-em)]](https://www.rsc.org/images/entities/char_2009.gif) :
:![[thin space (1/6-em)]](https://www.rsc.org/images/entities/char_2009.gif) 1 at 800 °C for 20 h to study CO2 tolerance, and the treated powders was analyzed by XRD. In conductivity test, the Ag wire was fixed in the end of the sample as a current electrode, and the Ag wire in the middle of the sample is used as voltage electrode. The conductivity of the electrode bars was tested via a four-terminal method from 850 °C to 500 °C using Keithley 2460 Source Meter. The cooling rate was 5 °C min−1 and the temperature was stable for 30 min before test. In the reducing atmosphere, the flow rate of CO2 and CO were both 50 mL min−1. The valence state change of the elements in the electrode surface at oxidation state and reduction state were tested by XPS meth. The data of each element were fitted using Xpspeak41 software.
1 at 800 °C for 20 h to study CO2 tolerance, and the treated powders was analyzed by XRD. In conductivity test, the Ag wire was fixed in the end of the sample as a current electrode, and the Ag wire in the middle of the sample is used as voltage electrode. The conductivity of the electrode bars was tested via a four-terminal method from 850 °C to 500 °C using Keithley 2460 Source Meter. The cooling rate was 5 °C min−1 and the temperature was stable for 30 min before test. In the reducing atmosphere, the flow rate of CO2 and CO were both 50 mL min−1. The valence state change of the elements in the electrode surface at oxidation state and reduction state were tested by XPS meth. The data of each element were fitted using Xpspeak41 software.
The electrolytic cells were sealed on Al2O3 tubes and connected to PARSTAT2273 advanced electrochemical workstation for electrochemical test. The cathode was sealed inside the tube and fed with pure CO2. The anode is directly placed in air. The electrochemical performances were performed when open circuit voltage of cells was steady. The I–V curves from 0 V to 2 V were recorded via the linear voltage sweep. The electrochemical impedance spectra (EIS) at different voltages were measured with a frequency range of 100 kHz–10 mHz, and the data were treated by Zview to explain each step of the electrochemistry process under different voltages. The electrolytic stability under 1.2 V was measured by Keithley 2460 Source Meter at 800 °C. The micromorphology of the electrode and electrolyte were viewed by scanning electron microscope.
Results and discussion
Crystal structure and chemical compatibility
Fig. 1(a) and (b) display the XRD patterns of LSF and LSFMo powders after calcinating at 1250 °C for 10 h in air. A pure rhombohedral perovskite structure is formed after Mo element doping without any impurities, suggesting that 5% Mo could completely enter the LSF lattice. The main peaks of 30°–35° are magnified to further analyze the change in the two perovskite materials. After Mo is doped into the LSF structure, the peak is moved toward a small angle (from 32.6° to 32.5°), indicating an expansion of the lattice caused by charge compensation. Due to the addition of high-valence Mo5+/6+, the valence of Fe is reduced to compensate for charge deficiency. Although the Mo5+/6+ radius is smaller than that of Fe3+ and Fe2+, the Fe ionic radius gradually increases with the reduction of Fe ionic to the lower valence state, and the radius of Mo5+/6+ is also larger than that of Fe4+, which lead to an increase in the unit volume. This phenomenon could be verified by XPS results of the Fe element in the following section. This phenomenon could be verified by XPS of Fe element results in the following section. (ionic radius: Fe4+ = 58.5 pm, Fe3+ = 64.5 pm, Fe2+ = 78 pm, Mo6+ = 59 pm and Mo5+ = 61 pm).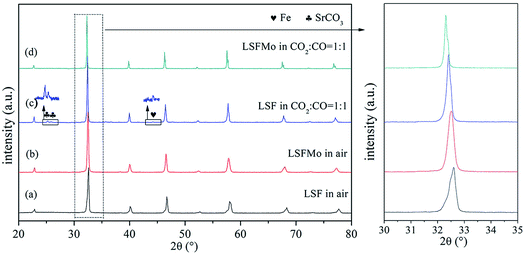 | ||
Fig. 1 XRD patterns of (a) LSF and (b) LSFMo0.05 in air; (c) LSF and (d) LSFMo0.05 treated in CO2![[thin space (1/6-em)]](https://www.rsc.org/images/entities/char_2009.gif) : :![[thin space (1/6-em)]](https://www.rsc.org/images/entities/char_2009.gif) CO = 1 CO = 1![[thin space (1/6-em)]](https://www.rsc.org/images/entities/char_2009.gif) : :![[thin space (1/6-em)]](https://www.rsc.org/images/entities/char_2009.gif) 1 at 800 °C for 20 h. 1 at 800 °C for 20 h. | ||
The stability of SOEC cathode materials is further investigated, and LSF and LSFMo materials were explored in CO2![[thin space (1/6-em)]](https://www.rsc.org/images/entities/char_2009.gif) :
:![[thin space (1/6-em)]](https://www.rsc.org/images/entities/char_2009.gif) CO = 1
CO = 1![[thin space (1/6-em)]](https://www.rsc.org/images/entities/char_2009.gif) :
:![[thin space (1/6-em)]](https://www.rsc.org/images/entities/char_2009.gif) 1 atmosphere at 800 °C for 20 h treatment. The XRD results of the treated powders are shown in Fig. 1(c) and (d). The SrCO3 phase and little Fe metal are generated after LSF is treated in CO2
1 atmosphere at 800 °C for 20 h treatment. The XRD results of the treated powders are shown in Fig. 1(c) and (d). The SrCO3 phase and little Fe metal are generated after LSF is treated in CO2![[thin space (1/6-em)]](https://www.rsc.org/images/entities/char_2009.gif) :
:![[thin space (1/6-em)]](https://www.rsc.org/images/entities/char_2009.gif) CO = 1
CO = 1![[thin space (1/6-em)]](https://www.rsc.org/images/entities/char_2009.gif) :
:![[thin space (1/6-em)]](https://www.rsc.org/images/entities/char_2009.gif) 1, whereas LSFMo maintains a pure phase of perovskite after treatment under the same condition, implying that Mo doping improves the CO2 tolerance and reduction stability of the electrode. Although a small amount of Fe metal has a catalytic effect on CO2, a large amount of SrCO3 affects the conductivity and covers active sites of LSF, which is harmful to the electrochemical performance.
1, whereas LSFMo maintains a pure phase of perovskite after treatment under the same condition, implying that Mo doping improves the CO2 tolerance and reduction stability of the electrode. Although a small amount of Fe metal has a catalytic effect on CO2, a large amount of SrCO3 affects the conductivity and covers active sites of LSF, which is harmful to the electrochemical performance.
Conductivity
To study the influence of conductivity after Mo doping in LSF material, the conductivity of the two materials in oxidizing and reducing atmosphere was tested, respectively. Fig. 2(a) demonstrates the electrical conductivity curves of the two materials in the air with the change in temperature from 500 °C to 850 °C. Conductivity first increases and subsequently decreases with an increase in temperature, which is similar to that of La0.8Sr0.2Co1−yFeyO3, Sr2Mg1−xCoxMoO6, and Nd0.7Sr0.3Fe1−xCoxO3 materials. The variation trend of LSF and LSFMo conductivity presents the small polar hopping conductivity mechanism.21 At 650 °C, the conductivity of LSF reaches the maximum value (301.5 S cm−1), whereas the value of LSFMo is only 109.2 S cm−1. The electrical conductivity of materials changes to metallic conductance with a further increase in temperature, thus, they possess the properties of a metallic conductor, i.e., the resistance increases and the electrical conductivity decreases as the temperature rises.22–24 For Fe-based perovskite, the conductivity of the materials is mainly determined by electrical conductivity,25,26 which is performed by the B–O–B bond form of the Zerner exchange mechanism, expressed as Fe4+–O2−–Fe3+ → Fe3+–O−–Fe4+ → Fe3+–O2−–Fe4+, so the higher concentration of Fe3+/Fe4+ redox couples make the higher conductivity for LSF. After doping of Mo in the LSF, the high-valence Fe is partially reduced, leading to the reduction of Fe3+/Fe4+ couples and decrease in conductivity.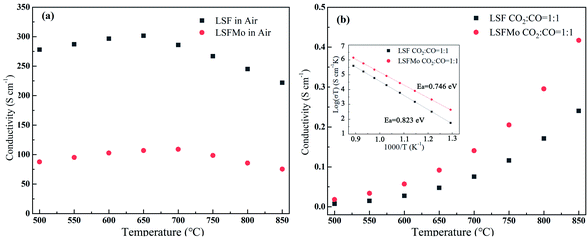 | ||
Fig. 2 The conductivity of LSF and LSFMo sample (a) in air, (b) in CO2![[thin space (1/6-em)]](https://www.rsc.org/images/entities/char_2009.gif) : :![[thin space (1/6-em)]](https://www.rsc.org/images/entities/char_2009.gif) CO = 1 CO = 1![[thin space (1/6-em)]](https://www.rsc.org/images/entities/char_2009.gif) : :![[thin space (1/6-em)]](https://www.rsc.org/images/entities/char_2009.gif) 1, Arrhenius plot of the conductivity values with various temperatures shown as an inset. 1, Arrhenius plot of the conductivity values with various temperatures shown as an inset. | ||
The LSF and LSFMo samples were placed in a CO2![[thin space (1/6-em)]](https://www.rsc.org/images/entities/char_2009.gif) :
:![[thin space (1/6-em)]](https://www.rsc.org/images/entities/char_2009.gif) CO = 1
CO = 1![[thin space (1/6-em)]](https://www.rsc.org/images/entities/char_2009.gif) :
:![[thin space (1/6-em)]](https://www.rsc.org/images/entities/char_2009.gif) 1 atmosphere to record the conductivity in the reducing atmosphere, as shown in Fig. 2(b). The conductivity of LSF and LSFM increases with the rise of temperature, which is similar to the trend of Sr2Fe1.5Mo0.5O6 and La0.3Sr0.7Fe0.9Ti0.1O3−δ materials.27,28 Compared with LSF material, the conductivity of LSFMo increased at the same temperatures. For example, it increased from 0.24 S cm−1 to 0.41 S cm−1 at 850 °C. This is because the electrode presents n-type conductance at low oxygen partial pressure, in which the conductivity is dominated by the free electrons.27,29 Fe4+ and Mo6+ are reduced to generate the oxygen vacancies during this condition, as shown in formulas (1)–(3),
1 atmosphere to record the conductivity in the reducing atmosphere, as shown in Fig. 2(b). The conductivity of LSF and LSFM increases with the rise of temperature, which is similar to the trend of Sr2Fe1.5Mo0.5O6 and La0.3Sr0.7Fe0.9Ti0.1O3−δ materials.27,28 Compared with LSF material, the conductivity of LSFMo increased at the same temperatures. For example, it increased from 0.24 S cm−1 to 0.41 S cm−1 at 850 °C. This is because the electrode presents n-type conductance at low oxygen partial pressure, in which the conductivity is dominated by the free electrons.27,29 Fe4+ and Mo6+ are reduced to generate the oxygen vacancies during this condition, as shown in formulas (1)–(3),
 | (1) |
 | (2) |
 | (3) |
 and
and  represent the ions of Fe4+ and Mo6+, respectively. The reduction of Fe4+ and Mo6+ is accompanied by the consumption of lattice oxygen, resulting in the formation of oxygen vacancies. The formation of oxygen vacancies increases free electrons, which leads to the increase of electrical conductivity. Meanwhile, the increase in oxygen vacancies also improves the rate of the oxygen reduction reaction.
As shown in Fig. 2(b), the corresponding Arrhenius curves and the activation energy (Ea) of LSF and LSFMo are calculated by the following equation:
Ea is related to the electron transfer of the electrode for the oxygen reduction reaction. The value of LSF is 0.823 eV, while that of LSFMo is reduced to 0.746 eV, suggesting that the introduction of Mo ions improves the electron transfer of material. From the stability and conductivity of two materials in the reducing atmosphere, it can be concluded that LSFMo is more suitable for SOEC cathode than LSF.
XPS
The element valence of the LSF and LSFMo powders was tested by XPS. Fig. 3 shows the XPS spectra of each sample in the oxidation and reduction states, respectively. The data were fitted by Xpspeak41, as shown in Table 1.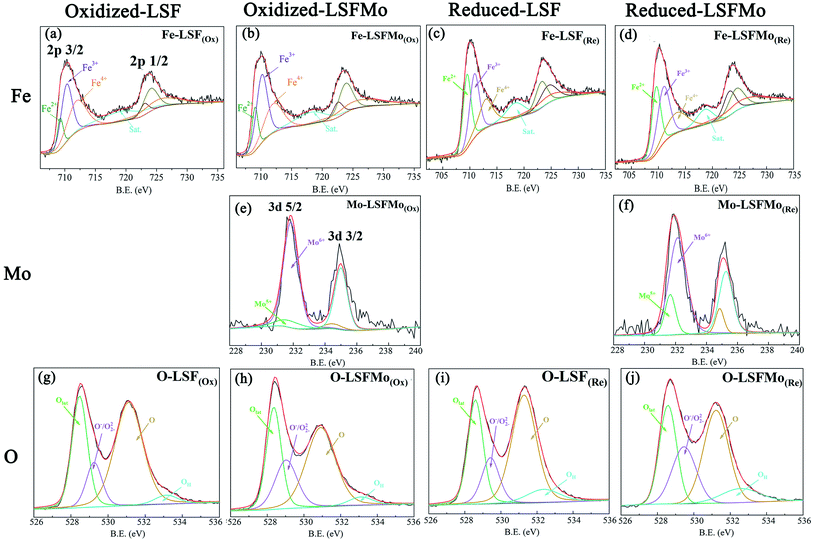 | ||
| Fig. 3 XPS spectra of Fe 2p, Mo 3d and O 1s in LSF(Ox) (a) and (g); LSFMo(Ox) (b), (e) and (h); LSF(Re) (c) and (i); LSFMo(Re) (d), (f) and (j). | ||
| Cond. | Samples | Fe 2p3/2 (%) | Mo 3d5/2 (%) | O 1s | Oads/Olat | Average | ||||||
|---|---|---|---|---|---|---|---|---|---|---|---|---|
| Fe2+ | Fe3+ | Fe4+ | Mo5+ | Mo6+ | Olat | Oads | OH | Fen+ | ||||
| O−/O22− | O | |||||||||||
| Ox | LSF | 13 | 45.1 | 41.9 | 30.72 | 12.93 | 51.80 | 4.55 | 2.10 | 3.29 | ||
| LSFMo | 17 | 48.2 | 34.8 | 10.58 | 89.42 | 28.18 | 20.77 | 45.51 | 5.54 | 2.35 | 3.18 | |
| Re | LSF | 34.28 | 35.66 | 30.66 | 29.66 | 13.72 | 52.09 | 4.54 | 2.22 | 2.98 | ||
| LSFMo | 33.83 | 39.87 | 26.30 | 20.03 | 79.97 | 27.39 | 21.44 | 44.86 | 6.30 | 2.42 | 2.92 | |
There are three peaks in the Fe 2p spectrum, which correspond to Fe 2p3/2, Fe 2p1/2 and Fe satellite, respectively. For the Fe 2p3/2 spectra of LSF oxidation (denoted as LSF(Ox)) and LSFMo oxidation (denoted as LSFMo(Ox)), three interval fixed peaks of Fe element are further analyzed. The binding energy of approximately 709.2, 710.3 and 711.9 eV correspond to Fe2+, Fe3+ and Fe4+ peaks, respectively.30,31 In the oxidized LSF sample (Fig. 3(a)), Fe2+, Fe3+ and Fe4+ account for 13%, 45.1% and 41.9%, respectively, while these values change to 17%, 48.2%, and 34.8% in LSFMo(Ox) (Fig. 3(b)). The content of Fe4+ in LSFMo(Ox) is significantly decreased, verifying the above XRD and conductivity results. The fitting results show that the average valence state of Fe in oxidized LSF is 3.29, whereas the value of LSFMo decreases to 3.18. It is evident that in the charge compensation mechanism, partial replacement of high-valence Mo could reduce the Fe valence state. Fe4+/Fe3+ electron pairs play a crucial role in the process of electron transport. The decrease in Fe4+/Fe3+ electron pairs blocks the electron transition channel in LSFMo, reducing the conductivity of the electrons.32,33 After the samples are treated in the reducing atmosphere, the ratios of Fe2+/Fe3+/Fe4+ are changed to 34.28%/35.66%/30.66% in LSF and 33.83%/39.87%/26.30% in LSFMo. The reduction of Fe ions leads to the formation of oxygen vacancies, so few Fe4+ in LSFMo would make it possess more oxygen vacancies than LSF.
The spectra of Mo 3d in LSFMo(Ox) and LSFMo(Re) are shown in Fig. 3(e) and (f). The orbital spin splitting peak of Mo 3d shows two wide peaks, one is 3d5/2 with low energy and the other is 3d3/2 with high energy. Both of them consist of Mo5+ and Mo6+ peaks.34–36 The fitting results manifest that many Mo6+ ions (89.42%) existed in LSFMo(Ox), whereas some Mo6+ ions are converted into Mo5+ after reduction, which further promotes the formation of oxygen vacancies and increases of conductivity in a reducing atmosphere.
Fig. 3(g), (h), (i) and (j) present the O 1s spectra in LSF(Ox), LSFMo(Ox), LSF(Re),and LSFMo(Re) samples, respectively. According to the binding energy intensity, the spectrum can be divided into four peaks. The first peak at 528.5 eV is attributed to the lattice oxygen (Olat). The second peak is O−/O22− species in the form of highly oxidized oxygen at 529.7 eV, and the third peak at O represents adsorbed oxygen or hydroxyl groups at 531.2 eV. The fourth peak at approximately 532.2 eV is related to the molecular water adsorbed on the surface (OH).37–39 In the O 1s spectrum, both O−/O22− and O constitute adsorbed oxygen (Oads), representing the oxygen defect concentration. As shown in Table 1, the relative content of Oads increases after Mo doping, indicating that O−/O22− will be generated as a charge compensation when Fe4+ is replaced by higher valence Mo6+, which increases the concentration of oxygen defects.
The ratio of Oads/Olat can be reflected as the content of oxygen vacancy in materials, and the ratio values of LSF (Ox) and LSFMo(Ox) are 2.10 and 2.17, respectively, indicating that Mo doping can effectively increase the oxygen vacancy concentration of electrode materials. In the reduction state, due to the reduction of Fe and Mo, the values are changed to 2.22 and 2.42, respectively. Compared with LSF, LSFMo shows more oxygen vacancies in both oxidation and reduction states, which would provide more active sites and higher oxygen ion conduction in the reaction process.
Electrochemical performance
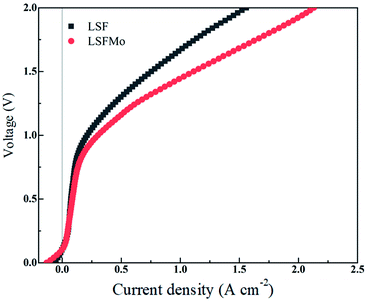
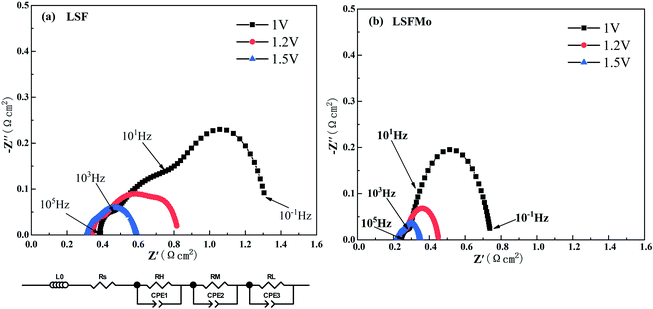
Fig. 4 exhibits the variation of the current density of LSF(LSFMo)/LSGM/LSCF-GDC electrolysis cells with voltage ranging from 0 to 2 V for pure CO2 electrolysis. The measured OCV of the cells is approximately 0.1 V, suggesting good airtightness. The current density increases as the voltage increases during the entire voltage range. In addition, the electrolytic current density of the LSFMo cell is higher than that of the LSF cell under the same applied voltage, showing that the catalytic performance of Mo-doped material is improved. The current density of the LSF cell is 1.56 A cm−2 when voltage reaches 2 V, while the value of LSFMo cell is increased to 2.13 A cm−2 with 36.5% promotion. The performance of LSFMo cell at 1.5 V (1.07 A cm−2) is also higher than other Fe-based materials, such as La0.5Sr0.5Fe0.95V0.05O3−δ (0.53 A cm−2 at 1.5 V),33 La0.6Sr0.4Fe0.8Ni0.2O3−δ (0.57 A cm−2 at 1.5 V) and La0.6Ca0.4Fe0.8Ni0.2O3−δ (0.75 A cm−2 at 1.5 V),40 suggesting the excellent electrolysis performance.To analyze the difference in the electrolysis performance between LSF and LSFMo electrolytic cells, the EIS for CO2 electrolysis were tested under different voltages at 800 °C, as shown in Fig. 5. The intercept between the impedance spectrum and the X-axis represents Rs, and the value gradually decreases as the voltage increases, which is caused by the thermal effect of electric current under high voltage. Meanwhile, Rp also diminishes due to the reduction activation of the electrode. Under the same voltage, LSFMo shows lower Rs and Rp. For example, the Rs and Rp of LSF are 0.33 Ω cm2 and 0.49 Ω cm2 at 1.2 V, respectively, whereas those of LSFMo are decreased to 0.22 Ω cm2 and 0.24 Ω cm2, respectively. The diminution of Rs and Rp together promotes the electrochemical performance of LSFMo. Since CO is produced in the fuel electrode during the electrolysis process and the conductivity of the LSF electrode is low in the reducing atmosphere, the decrease in Rs is mainly caused by the increase of conductivity in the LSFMo electrode, while the change in Rp may be due to the promotion of catalytic activity caused by oxygen defects. The Rp is further decreased to 0.13 Ω cm2 when the voltage is increased to 1.5 V, which is significantly lower than La0.65Sr0.3Ce0.05Cr0.5Fe0.5O3−δ (0.211 Ω cm2 at 2 V),41 La0.6Sr0.4Fe0.8Ni0.2O3−δ (0.2 Ω cm2 at 1.6 V)40 and Sr2Fe1.5Mo0.5O6−δ-SDC (0.19 Ω cm2 at 1.5 V)28 reported in the literature, demonstrating excellent catalytic activity. To further explain the Rp change, EIS are fitted by Zview with the model L0 − Rs − (RH//CPE1) − (RM//CPE2) − (RL//CPE3), where L0 represents the inductance coefficient, which is related to the equipment and connecting cables; RS is the total ohmic resistance generated by the electrolyte, electrode and lead wires; and RH, RM and RL represents polarization resistances in high-frequency, middle-frequency and low-frequency, respectively. For CO2 electrolysis, RH is related to the charge transfer process, and the middle-frequency RM is attributed to the adsorption and dissociation of CO2 at the porous electrode, while RL is ascribed to the process of CO2 diffusion. The fitting results at 1.2 V are listed in Table 2. Compared with LSF, RM and RL of LSFMo are significantly decreased, indicating that LSFMo has better CO2 adsorption and dissociation, which is attributed to more oxygen vacancy concentrations. Moreover, SrCO3 is produced in reduction atmosphere for LSF, which will cover the active sites on the surface of material and affects the electrolysis performance.42 The Mo doping suppresses the formation of SrCO3, which may be another reason of performance improvement.
| Samples | RH (Ω cm2) | RM (Ω cm2) | RL (Ω cm2) | Rp (Ω cm2) |
|---|---|---|---|---|
| LSF | 0.049 | 0.35 | 0.091 | 0.49 |
| LSFMo | 0.047 | 0.177 | 0.018 | 0.242 |
The electrolysis stability of the LSFMo cell was measured at 800 °C and 1.2 V constant voltage, as shown in Fig. 6(a). The attenuation rate is 0.044 mA cm−2 min−1 (0.008% A cm−2 min−1), which is lower than that of LSF (0.022% A cm−2 min−1), La0.5 Sr0.5Fe0.95V0.05O3−δ (0.022% A cm−2 min−1)33 and La0.75Sr0.25Cr0.5Mn0.5O3−δ (4 mA cm−2 min−1),43 implying that LSFMo cell has reasonable stability. Fig. 6(b) exhibits the microstructures of LSFMo|LSGM|LSCF-GDC cells after the stability test. The thickness of the LSGM electrolyte and LSFMo electrode is approximately 300 μm and 15 μm, respectively. The LSFMo electrode has a porous structure, whereas the LSGM electrolyte shows a dense structure. The electrode and electrolyte maintain good contact without obvious cracks, indicating good thermal compatibility during operation. In addition, the cathode after the test is detected by XRD as shown in Fig. 6(c). The result that no SrCO3 and Fe are generated verifies the excellent CO2 tolerance and reduction stability of the LSFMo electrode.
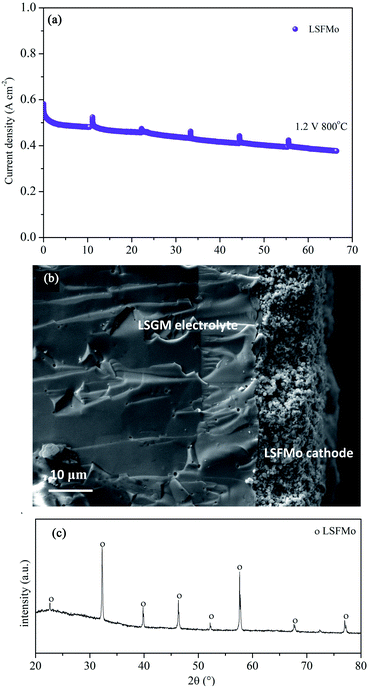 | ||
| Fig. 6 (a)The stability of LSFMo cell at 1.2 V, (b) SEM of cross-section of cathode after stability test, (c) XRD of cathode after stability test. | ||
Conclusion
In summary, a new Mo-doped LSF perovskite material was synthesized using a solid-phase method, and the electrochemical properties of SOECs as cathode materials were studied. Mo doping significantly improves the CO2 tolerance of LSF materials and solves the problem of SrCO3 generation. 5% Mo addition increases the oxygen defects of the material surface, which improves the conductivity in the reducing atmosphere and the catalytic activity of cathode material. Compared with LSF, LSFMo exhibits smaller Rs and Rp as the SOEC cathode, which makes the LSFMo electrolytic cell possess higher electrolytic performance. For example, the current densities increase from 1.56 A cm−2 to 2.13 A cm−2 under 2 V. The LSFMo cell shows excellent stability in the 60 h electrolysis test. Therefore, LSFMo can be considered as a promising cathode material for SOECs at intermediate temperatures.Conflicts of interest
There are no conflicts to declare.Acknowledgements
This work was supported by the Beijing Natural Science Foundation (Grant No: 2192033).References
- B. Fang, Y. Xing, A. Bonakdarpour, S. Zhang and D. P. Wilkinson, ACS Sustainable Chem. Eng., 2015, 3, 2381–2388 CrossRef CAS.
- Z. Xiong, H. Wang, N. Xu, H. Li, B. Fang, Y. Zhao, J. Zhang and C. Zheng, Int. J. Hydrogen Energy, 2015, 40, 10049–11006 CrossRef CAS.
- X. Yang, J. Cheng, B. Fang, X. Xuan, N. Liu, X. Yang and J. Zhou, Nanoscale, 2020, 12, 18437–18445 RSC.
- G. Liao, J. Fang, Q. Li, S. Li, Z. Xu and B. Fang, Nanoscale, 2019, 11, 7062–7096 RSC.
- Y. Zheng, W. Zhang, Y. Li, J. Chen, B. Yu, J. Wang, L. Zhang and J. Zhang, Nano Energy, 2017, 40, 512–539 CrossRef CAS.
- Y. Li, J. Zhou, D. Dong, Y. Wang, J. Z. Jiang, H. Xiang and K. Xie, Phys. Chem. Chem. Phys., 2012, 14, 15547–15553 RSC.
- J. Yan, H. Chen, E. Dogdibegovic, J. W. Stevenson, M. Cheng and X. D. Zhou, J. Power Sources, 2014, 252, 79–84 CrossRef CAS.
- Z. Zhan and L. Zhao, J. Power Sources, 2010, 195, 7250–7254 CrossRef CAS.
- M. Keane, H. Fan, M. Han and P. Singh, Int. J. Hydrogen Energy, 2014, 39, 18718–18726 CrossRef CAS.
- E. S. Raj, J. A. Kilner and J. T. S. Irvine, Solid State Ionics, 2006, 177, 1747–1752 CrossRef CAS.
- M. L. Toebes, J. H. Bitter, A. J. Dillen and K. P. Jong, Catal. Today, 2002, 76, 33–42 CrossRef CAS.
- M. Cassidy, G. Lindsay and K. Kendall, J. Power Sources, 1996, 61, 189–192 CrossRef CAS.
- T. H. Shin, J. H. Myung, M. Verbraeken, G. Kim and J. T. S. Irvine, Faraday Discuss., 2015, 182, 227–239 RSC.
- S. Wang, H. Tsuruta, M. Asanuma and T. Ishihara, Adv. Energy Mater., 2015, 5, 1401003 CrossRef.
- X. Yue and J. T. S. Irvine, Solid State Ionics, 2012, 225, 131–135 CrossRef CAS.
- B. Molero-Sánchez, P. Addo, A. Buyukaksoy, S. Paulson and V. Birss, Faraday Discuss., 2015, 182, 159–175 RSC.
- S. Hu, L. Zhang, H. Liu, Z. Cao, W. Yu, X. Zhu and W. Yang, J. Power Sources, 2019, 443, 227268 CrossRef CAS.
- X. Lu, Y. Yang, Y. Ding, Y. Chen, Q. Gu, D. Tian, W. Yu and B. Lin, Electrochim. Acta, 2017, 227, 33–40 CrossRef CAS.
- F. Liu, L. Zhang, G. Huang, B. Niu, X. Li, L. Wang, J. Zhao and Y. Jin, Electrochim. Acta, 2017, 255, 118–126 CrossRef CAS.
- L. Liu, X. Zhou, Y. Wang, S. Li, R. Yin, P. Guo, J. Zhao, X. Zhao and B. Li, Int. J. Hydrogen Energy, 2017, 42, 14905–14915 CrossRef CAS.
- J. Mizusaki, T. Sasamoto, W. R. Cannon and H. K. Bowen, J. Am. Ceram. Soc., 1983, 66, 247–252 CrossRef CAS.
- E. V. Bongio, H. Black, F. C. Raszewski, D. Edwards, C. J. McConville and V. R. W. Amarakoon, J. Electroceram., 2005, 14, 193–198 CrossRef CAS.
- S. Pang, W. Wang, T. Chen, X. Shen, Y. Wang, K. Xu and X. Xi, J. Power Sources, 2016, 326, 176–181 CrossRef CAS.
- V. V. Kharton, A. V. Kovalevsky, M. V. Patrakeev, E. V. Tsipis, A. P. Viskup, V. A. Kolotygin, A. A. Yaremchenko, A. L. Shaula, E. A. Kiselev and J. C. Waerenborgh, Chem. Mater., 2008, 20, 6457–6467 CrossRef CAS.
- Y. Niu, J. Sunarso, W. Zhou, F. Liang, L. Ge, Z. Zhu and Z. Shao, Int. J. Hydrogen Energy, 2011, 36, 3179–3186 CrossRef CAS.
- Z. Du, H. Zhao, S. Li, Y. Zhang, X. Chang, Q. Xia, N. Chen, L. Gu, K. Świerczek, Y. Li, T. Yang and K. An, Adv. Energy Mater., 2018, 8, 1800062 CrossRef.
- Y. Hou, L. Wang, L. Bian, Y. Wang, K. C. Chou and R. V. Kumar, Electrochim. Acta, 2020, 342, 136026 CrossRef CAS.
- Y. Li, X. Chen, Y. Yang, Y. Jiang and C. Xia, ACS Sustainable Chem. Eng., 2017, 5, 11403–11412 CrossRef CAS.
- Y. Gan, Q. Qin, S. Chen, Y. Wang, D. Dong, K. Xie and Y. Wu, J. Power Sources, 2014, 245, 245–255 CrossRef CAS.
- P. Zhang, G. Guan, D. S. Khaerudini, X. Hao, C. Xue, M. Han, Y. Kasai and A. Abudula, J. Power Sources, 2015, 276, 347–356 CrossRef CAS.
- M. Ghaffari, M. Shannon, H. Hui, O. K. Tan and A. Irannejad, Surf. Sci., 2012, 606, 670–677 CrossRef CAS.
- J. Sunarso, S. S. Hashim, N. Zhu and W. Zhou, Prog. Energy Combust. Sci., 2017, 61, 57–77 CrossRef.
- Y. Zhou, Z. Zhou, Y. Song, X. Zhang, F. Guan, H. Lv, Q. Liu, S. Miao, G. Wang and X. Bao, Nano Energy, 2018, 50, 43–51 CrossRef CAS.
- H. Cai, L. Zhang, J. Xu, J. Huang, X. Wei, L. Wang, Z. Song and W. Long, Electrochim. Acta, 2019, 320, 134642 CrossRef CAS.
- L. Fu, J. Zhou, J. Yang, Z. Lian, J. Wang, Y. Cheng and K. Wu, Appl. Surf. Sci., 2020, 511, 145525 CrossRef CAS.
- L. Bian, C. Liu, S. Li, J. Peng, X. Li, L. Guan, Y. Liu, J. Peng, S. An and X. Song, Int. J. Hydrogen Energy, 2020, 45, 19813–19822 CrossRef CAS.
- G. Cheng, T. Kou, J. Zhang, C. Si, H. Gao and Z. Zhang, Nano Energy, 2017, 38, 155–166 CrossRef CAS.
- C. Yao, J. Meng, X. Liu, X. Zhang, F. Meng, X. Wu and J. Meng, Electrochim. Acta, 2017, 229, 429–437 CrossRef CAS.
- J. Miao, J. Sunarso, C. Su, W. Zhou, S. Wang and Z. Shao, Sci. Rep., 2017, 7, 44215 CrossRef PubMed.
- Y. Tian, L. Zhang, Y. Liu, L. Jia, J. Yang, B. Chi, J. Pu and J. L. Luo, J. Mater. Chem. A, 2019, 7, 6395–6400 RSC.
- Y. Q. Zhang, J. H. Li, Y. F. Sun, B. Hua and J. L. Luo, ACS Appl. Mater. Interfaces, 2016, 8, 6457–6463 CrossRef CAS PubMed.
- D. Oh, D. Gostovic and E. D. Wachsman, J. Mater. Res., 2012, 27, 1992–1999 CrossRef CAS.
- S. Xu, S. Li, W. Yao, D. Dong and K. Xie, J. Power Sources, 2013, 230, 115–121 CrossRef CAS.
| This journal is © The Royal Society of Chemistry 2021 |


