 Open Access Article
Lithium-ion transport in inorganic active fillers used in PEO-based composite solid electrolyte sheets†
Young-Woong Songab,
Kookjin Heoab,
Jongkwan Leea,
Dahee Hwangab,
Min-Young Kima,
Su-Jin Kim a,
Jaekook Kimb and
Jinsub Lim
 *a
*a
aKorea Institute of Industrial Technology (KITECH), 6, Cheomdan-gwagiro 208-gil, Buk-gu, Gwangju 61012, Republic of Korea. E-mail: jinsub@kitech.re.kr
bDepartment of Materials Science and Engineering, Chonnam National University, 300 Yongbongdong, Bukgu, Gwangju 61186, Republic of Korea
First published on 27th September 2021
Abstract
In this study, we evaluated the properties exhibited by a composite solid electrolyte (CSE) prepared via tailoring the particle size of an active filler, Li6.4La3Zr1.4Ta0.6O12 (LLZTO). The average particle size was reduced to 2.53 μm via ball milling and exhibited a specific surface area of 3.013 m2 g−1. Various CSEs were prepared by combining PEO and LLZTO/BM-LLZTO. The calculated lithium ionic conductivity of the BM-LLZTO CSE was 6.0 × 10⁻⁵ S cm−1, which was higher than that exhibited by the LLZTO CSE (4.6 × 10⁻⁵ S cm−1). This result was confirmed via 7Li nuclear magnetic resonance (NMR) analysis, during which lithium-ion transport pathways varied as a function of the particle size. NMR analysis showed that when BM-LLZTO was used, the migration of Li ions through the interface occurred at a fast rate owing to the small size of the constituent particles. During the Li/CSEs/Li symmetric cell experiment, the BM-LLZTO CSE exhibited lower overvoltage characteristics than the LLZTO CSE. A comparison of the characteristics exhibited by the LFP/CSEs/Li cells confirmed that the cells using BM-LLZTO exhibited high discharge capacity, rate performance, and cycling stability irrespective of the CSE thickness.
Introduction
The development of liquid electrolyte-based lithium metal, Ni-rich cathode materials and lithium–sulfur batteries can effectively increase energy density.1–3 However, liquid electrolytes containing highly volatile and flammable organic solvents exhibit significant stability problems.4 In contrast, all-solid-state lithium batteries exhibit an inherent resistance to both ignition and explosion, while exhibiting high electrochemical stability and increased power and energy densities.5 Solid polymer electrolytes (SPEs), which are used as an all-solid-state battery material, allow strong interfacial contact with electrodes and possess excellent mechanical properties, including significant flexibility.6,7 Among the reported SPEs, polyethylene oxide (PEO) has gained considerable research attention because its transport mechanism involves the dissolution of various salts through the interaction of ether oxygen and cations, facilitating fast Li+ transport through the segmentation motion of polymers.8–10 However, PEO-based SPEs exhibit low ionic conductivity and Li transference values because of the nature of their crystal domain at room temperature.11 In an attempt to mitigate this problem, research efforts have been devoted toward the introduction of inorganic nanofillers, which exhibit large specific surface areas and Lewis acid concentrations, into the polymer matrix.12 These inorganic fillers can be divided into two distinct categories: inert fillers such as Al2O3, ZrO2, and SiO2 (ref. 13–15) and active fillers such as LLZO, LLTO, and LATP.16–18 Inert fillers act as a solid plasticizer within the polymer matrix and lower the crystallinity of the polymer to increase the ionic conductivity; however, they alone do not provide conductive lithium ions. In contrast, active fillers facilitate Li-ion transport by incorporating conductive ions to enhance the conduction process.19–21 Among the active fillers, garnet-structured LLZO has received considerable research attention because it has numerous advantages including high ionic conductivity (10−4 to 10−3 S cm−1) at room temperature and high electrochemical stability with lithium metal.22In the case of a composite solid electrolyte (CSE) prepared using polymer and LLZO-based fillers, the ionic conductivity is related to the LLZO particle size and filler content. Zhang et al.23 reported that the addition of LLZO particles (in limited concentrations (12.7%) and having diameters of ∼40 nm, ∼400 nm, and 10 μm) increased the ionic conductivity through their integration within the PEO matrix. A filler of 40 nm imparted an ionic conductivity of 2.1 × 10⁻⁴ S cm−1, whereas a conductivity of 3.8 × 10⁻⁶ S cm−1 was imparted by a 10 μm filler at 30 °C. In the case of the ‘ceramic-in-polymer’ structure, in which a low volume of LLZO is incorporated into the PEO matrix, Li+ is primarily transported through the PEO matrix as the fillers alone are not sufficient to form an Li+ conductive pathway. As the number of LLZO fillers increases, the internal structure evolves to a ‘polymer-in-ceramic’ structure, and the overall Li+ conductivity is primarily governed by the conductivity of the LLZO ceramic.24 However, the Li-ion transport pathway according to the particle size within the polymer-in-ceramic structures has not yet been investigated.
In this study, a CSE was fabricated using Li6.4La3Zr1.4Ta0.6O12 (LLZTO) and PEO and its properties were evaluated. The particle size of LLZTO was controlled via ball milling. The effect of LLZTO particle size on the Li-ion transport pathway was investigated through Li-nuclear magnetic resonance (NMR) analysis. The migration of Li ions was observed to proceed more rapidly through an interface consisting of relatively small particles compared to that consisting of larger particles. In addition, CSEs with various particle sizes and thicknesses were prepared, and the performance exhibited by LiFePO4 (LFP)/CSEs/Li based all-solid-state batteries was compared.
Experimental
CSE fabrication
The particle size exhibited by LLZTO (Toshima) was controlled through planetary ball milling (FRISTCH, PULVERISETTE 6). Ball milling was performed at 400 rpm for 40 min using zirconia balls having diameters of 1.0 and 0.5 mm. PEO-based CSEs were prepared via the solution casting method. PEO (Mv: 200![[thin space (1/6-em)]](https://www.rsc.org/images/entities/char_2009.gif) 000, Sigma Aldrich), LiClO4 (Sigma Aldrich), LiFSI (ENCHEM), and ball-milled LLZTO (BM-LLZTO) were dried at 60 °C for 1 d. Initially, LiClO4 and LiFSI were mixed in a 4
000, Sigma Aldrich), LiClO4 (Sigma Aldrich), LiFSI (ENCHEM), and ball-milled LLZTO (BM-LLZTO) were dried at 60 °C for 1 d. Initially, LiClO4 and LiFSI were mixed in a 4![[thin space (1/6-em)]](https://www.rsc.org/images/entities/char_2009.gif) :
:![[thin space (1/6-em)]](https://www.rsc.org/images/entities/char_2009.gif) 1 ratio and stirred in acetonitrile (ACN) at room temperature. Next, PEO and lithium salts were mixed in a 13
1 ratio and stirred in acetonitrile (ACN) at room temperature. Next, PEO and lithium salts were mixed in a 13![[thin space (1/6-em)]](https://www.rsc.org/images/entities/char_2009.gif) :
:![[thin space (1/6-em)]](https://www.rsc.org/images/entities/char_2009.gif) 1 ratio to prepare the PEO binder solution. A slurry was prepared via mixing of the LLZTO powder and PEO binder solution in a 7
1 ratio to prepare the PEO binder solution. A slurry was prepared via mixing of the LLZTO powder and PEO binder solution in a 7![[thin space (1/6-em)]](https://www.rsc.org/images/entities/char_2009.gif) :
:![[thin space (1/6-em)]](https://www.rsc.org/images/entities/char_2009.gif) 3 ratio using a Thinky mixer at 1800 rpm for 15 min. Finally, the homogeneous slurry was cast as a PET film and then placed in dry air in order to volatilize the solvent. CSEs with thicknesses of 80 and 60 μm were prepared via roll pressing. All procedures were performed in a dry room under moisture-free conditions.
3 ratio using a Thinky mixer at 1800 rpm for 15 min. Finally, the homogeneous slurry was cast as a PET film and then placed in dry air in order to volatilize the solvent. CSEs with thicknesses of 80 and 60 μm were prepared via roll pressing. All procedures were performed in a dry room under moisture-free conditions.
Electrode materials
LiFePO4 (LFP) cathode materials with a carbon content of 1.5 wt% were fabricated via an advanced sol–gel method at Energy Materials Co., Ltd's pilot plant. For battery tests, LFP electrodes were prepared by mixing LFP, Al-doped LLZO25 that acts as an ionic conductor, Super-P (IMERYS) that acts as a conductive material, and PEO that acts as a binder in the weight ratio of 70![[thin space (1/6-em)]](https://www.rsc.org/images/entities/char_2009.gif) :
:![[thin space (1/6-em)]](https://www.rsc.org/images/entities/char_2009.gif) 5
5![[thin space (1/6-em)]](https://www.rsc.org/images/entities/char_2009.gif) :
:![[thin space (1/6-em)]](https://www.rsc.org/images/entities/char_2009.gif) 5
5![[thin space (1/6-em)]](https://www.rsc.org/images/entities/char_2009.gif) :
:![[thin space (1/6-em)]](https://www.rsc.org/images/entities/char_2009.gif) 20. Al-doped LLZO was manufactured using a Couette-Taylor reactor. The resultant slurry was then cast onto Al foil and dried at room temperature to form the cathode. The loading level of the electrode was maintained at ∼5.0 mg cm−2.
20. Al-doped LLZO was manufactured using a Couette-Taylor reactor. The resultant slurry was then cast onto Al foil and dried at room temperature to form the cathode. The loading level of the electrode was maintained at ∼5.0 mg cm−2.
Material characterization
| σtotal = L/(R × S) | (1) |
| TLi+ = Iss(ΔV − IoRo)/Io(ΔV − IssRss) | (2) |
Electrochemical characterization
The cells used for electrochemical characterization were assembled in a dry room in a CR2032 coin-type cell configuration. To track the Li-ion transport pathway in the CSEs, the 6Li–7Li replacement method was used. A 6Li/CSEs/6Li symmetric cell was prepared at a current density of 50 μA cm−2 and 55 °C. Linear sweep voltammetry (LSV) and symmetric cell tests were performed to assess the electrochemical stability exhibited by Li metal. LSV was conducted by assembling 2032 coin cells using a CSE sheet as the solid electrolyte, an Au-coated SUS plate as the working electrode, and Li metal as the counter electrode. LSV was performed using a potentiostat (Bio-Logic, SP-240) between 2.5 and 6.0 V in the case of the oxidation reaction and between −0.1 and 2.5 V in the case of the reduction reaction. The measurements were performed at 70 °C at a scan rate of 2 mV s−1. The Li symmetric cell consisted of Li/CSEs/Li, arranged to form 2032 coin cells, and was evaluated via deposition-stripping for 1 h at 70 °C at a current density of 0.1 mA cm−2. A 2032-coin-type cell, consisting of the LFP cathode and lithium metal anode separated by the CSEs, was prepared in a dry room as described above, and aged for 10 h prior to the electrochemical experiment. The charge–discharge measurements obtained from the as-prepared coin cell were performed over the potential range between 2.5 and 4.0 V at varying current densities generated using a battery cycler system (Wonatech, WBC-3000L).Results and discussion
Fig. 1a and b show the particle sizes of LLZTO and BM-LLZTO obtained via PSA. In the case of LLZTO, it was observed that a single peak appeared at approximately 8 μm, whereas a triple peak was observed in the case of BM-LLZTO. The formation of the triple peak can be attributed to the agglomeration of nano-sized and micro-sized particles during the ball-milling process.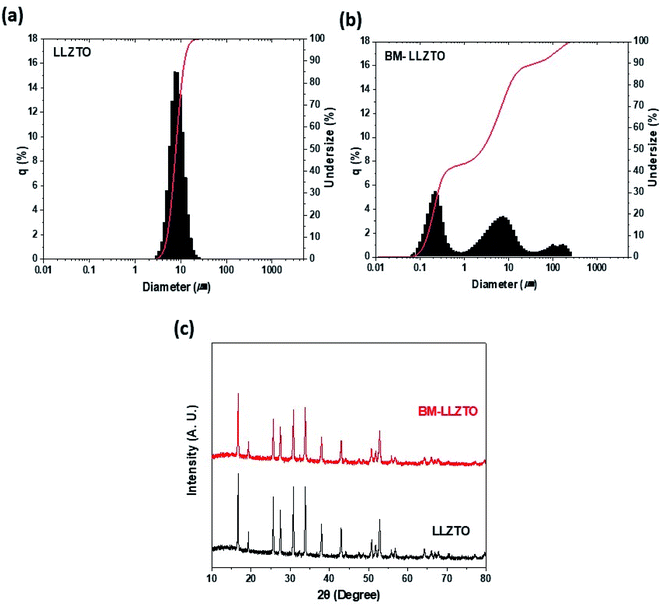 | ||
| Fig. 1 Particle size distribution exhibited by LLZTO and BM-LLZTO (a) and (b), respectively, and their XRD spectra (c). | ||
The specific surface areas and D50 values were 7.83 μm and 0.558 m2 g−1, respectively, for LLZTO and 2.53 μm and 3.013 m2 g−1, respectively, for BM-LLZTO. These values are listed in Table 1.
| Sample | Specific surface area (m2 g−1) | D50 (μm) |
|---|---|---|
| LLZTO | 0.558 | 7.83 |
| BM-LLZTO | 3.013 | 2.53 |
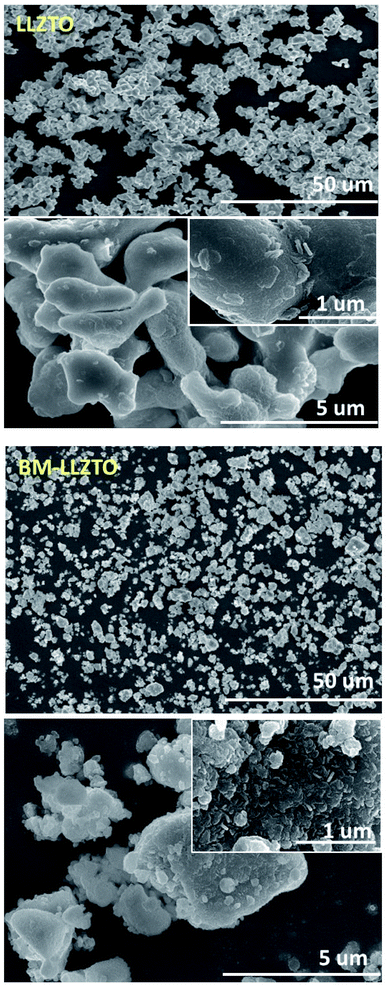
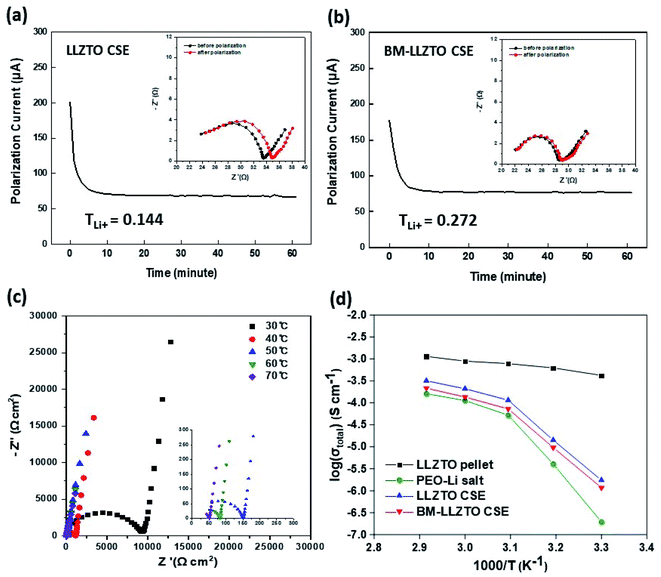
The reduced particle size and high specific surface area exhibited by BM-LLZTO facilitate a homogeneous distribution of the solid electrolyte particles in the sheet and increase the contact between particles to facilitate Li-ion transport through the solid electrolyte. Fig. 1c shows the XRD spectra of LLZTO and BM-LLZTO. In both samples, peaks corresponding to the cubic LLZO structure were observed, and no significant dependence on the particle size was observed. It was deduced that the ball-milling process did not affect the particle structure adopted by the solid electrolyte. Fig. 2 shows the FE-SEM images of the LLZTO and BM-LLZTO samples. In the case of BM-LLZTO, it was observed that the LLZTO primary particles agglomerate with nano-sized particles to form secondary particles. Fig. S1† shows the FE-SEM image and PSA results according to the milling time of LLZTO particles. In the case of the sample that was milled for 30 minutes, the average particle size was 5.75 μm, which was smaller than the LLZTO particles. However, the average particle size of the sample milled for 80 minutes was 9.96 μm, which was larger than that of the LLZTO particles due to excessive particle agglomeration. CSEs were prepared using LLZTO/BM-LLZTO, PEO, LiClO4, and LiFSI. Fig. S2† shows the FE-SEM and EDX mapping images of LLZTO CSE and BM-LLZTO CSE. It can be seen that BM-LLZTO CSE has smaller particles dispersed in the sheet than LLZTO CSE. Also, LLZTO particles are relatively aggregated in LLZTO CSE compared to BM-LLZTO CSE. Fig. S3† shows the stress–strain curves of the PEO-Li salt sheet and BM-LLZTO CSE. The tensile strength of the PEO-Li salt sheet and BM-LLZTO CSE were 5.44 and 3.54 MPa, respectively. These results indicate that the incorporation of LLZO ceramic filler into the PEO-salt-based polymer electrolyte can improve the mechanical strength of the sheet. Fig. 3a and b show the results of the AC impedance and DC polarization measurements performed using Li/CSEs/Li symmetric cells. The TLi+ values exhibited by the electrolytes are listed in Table 2.
| Sample | Io (mA) | Iss (mA) | Ro (Ω) | Rss (Ω) | TLi+ | σLi (S cm−1) |
|---|---|---|---|---|---|---|
| LLZTO CSE | 0.201 | 0.068 | 33.59 | 35.06 | 0.144 | 4.6 × 10⁻⁵ |
| BM-LLZTO CSE | 0.177 | 0.076 | 28.63 | 29.01 | 0.272 | 6.0 × 10⁻⁵ |
The TLi+ value exhibited by the LLZTO CSE was 0.144, while that by the BM-LLZTO CSE was 0.272. A typical spectrum obtained through AC impedance spectroscopy of the BM-LLZTO CSE is shown in Fig. 3c. At high and intermediate frequencies, the semicircle generated was ascribed to the bulk material, whereas the spike observed at low frequencies was attributed to the double layer capacitance exhibited between the electrode and the electrolyte.26 The total ionic conductivity was determined based on the resistance obtained through the AC impedance analysis and is shown in Fig. 3d.
As a result of measuring the total ionic conductivity by manufacturing the LLZTO pellet through the sintering process, it can be seen that the total ionic conductivity is higher than that of PEO-Li salt or CSEs. BM-LLZTO CSE and LLZTO CSE was higher total ionic conductivity than PEO-Li salt due to the addition of filler at all temperature. The total ionic conductivity exhibited by BM-LLZTO CSE was slightly lower than that by LLZTO CSE at all temperatures but showed a similar trend. The ionic conductivity (σLi) exhibited by Li calculated using the following equation:26
| σLi = σtotalTLi+ | (3) |
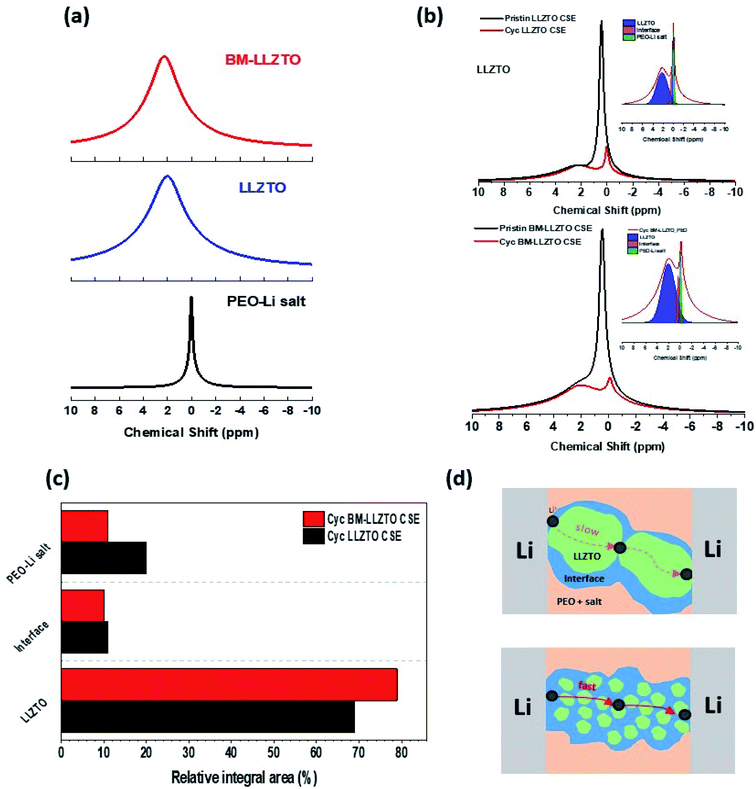
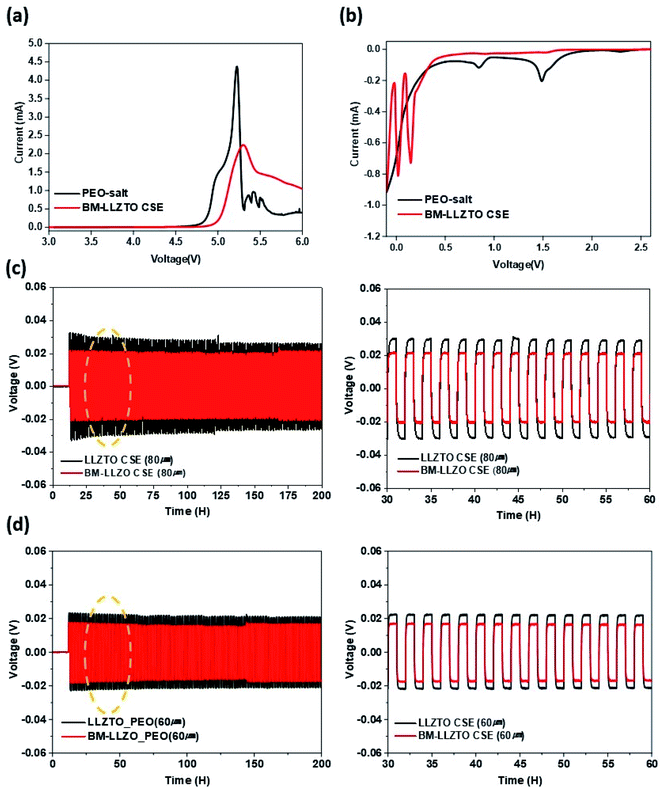
6Li prefers to replace 7Li in the CSE as it moves through the CSE to the counter electrode. Therefore, the Li-ion pathway can be identified through residual 7Li analysis.28 A significant discrepancy in intensity was observed between the pristine CSE and the CSE analyzed after cycling. This is believed to be attributed to the replacement of 7Li with 6Li within the CSE during cycling. Fig. 4c shows the integral area of the NMR spectra of the CSEs after cycling. In comparison to the LLZTO CSE, the BM-LLZTO CSE exhibits a larger volume of residual 7Li; however, it was observed that the volumes of 7Li at the interface and in the PEO-Li salt are both reduced. This appears to favor the transport of Li ions through the PEO matrix and interfaces as the solid electrolyte particles become smaller. Generally, it is reported that in the “Polymer-in-ceramic” structure, heterogeneous dispersion occurs due to the high LLZO content, and aggregation occurs due to the surface energy gap between LLZO and PEO, thereby limiting the chain mobility and ion conduction pathway of the polymer.29,30 In Fig S2.†, it can be seen that LLZTO CSE has relatively agglomerated LLZTO particles compared to BM-LLZTO CSE. This means that when BM-LLZTO with a relatively large specific surface area is used, a uniformly dispersed sheet can be prepared, and the conduction path of the polymer can be made easier. As a result, a larger number of particles are in contact with the PEO matrix, and Li-ion transport through the interface and PEO matrix is preferred over that through the solid electrolyte. Therefore, the relatively high lithium transference number exhibited by BM-LLZTO facilitates a more rapid transport of Li ions through BM-LLZTO compared to LLZTO, which exhibits a larger particle size. Fig. 4d details the Li-ion transport mechanism. Fig. 5a and b show the LSV results in both the oxidation and reduction potential regions of the BM-LLZTO CSE. The results of the oxidation potential stability shown in Fig. 5a were obtained in the range between OCV and 6.0 V (vs. Li/Li+) at 70 °C. The results of the reduction potential stability shown in Fig. 5b were obtained between OCV and −0.1 V at 70 °C. The PEO salt exhibits an onset of the oxidation initiation potential at 4.6 V, while the BM-LLZTO CSE exhibits a corresponding onset of the oxidation initiation potential at ∼5.0 V.
In the reduction region, it was observed that the onset of the reduction initiation potential occurred from 1.5 V in the case of the PEO salt, whereas for the BM-LLZTO CSE, it initiated at 0.3 V. This discrepancy can be attributed to the effect of the LLZTO filler exhibiting high electrochemical stability.31,32 Fig. 5c and d show the symmetric cell test results for the CSEs having various thicknesses. The voltage fluctuations are a result of the resistance exhibited by the Li metal and CSE interface, while dendrite formation owing to lithium stripping/deposition can be observed within the symmetrical cell. As a result of conducting the experiment at a current density of 0.1 mA cm−2, it was observed that the overvoltage characteristic exhibited by the BM-LLZTO CSE remains low. The reduced overvoltage characteristics are attributed to the fact that Li ions can move more freely when solid electrolytes exhibiting a smaller particle size are used. In addition, when the thickness of both samples was reduced from 80 to 60 μm, the overvoltage characteristics exhibited a decrease. This was attributed to the fact that, as the electrolyte thickness is reduced, the resistance imparted during ion migration from the electrode to the counter electrode through the electrolyte is reduced.
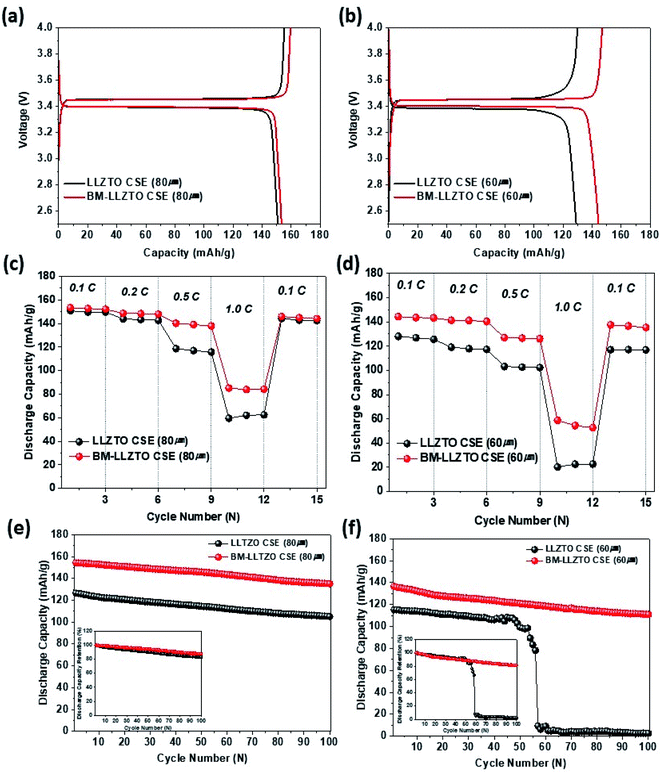
Fig. 6a and b show the initial charge–discharge curves obtained for the LFP/CSEs/Li coin cells at 0.1C and 70 °C across the voltage range of 2.5–4.0 V. The initial discharge capacities exhibited by the LLZTO and BM-LLZTO CSEs were 150.8 and 153.3 mA h g−1 for the 80 μm-thick samples, respectively, and 139.3 and 144.4 mA h g−1 for the 60 μm-thick samples, respectively. The BM-LLZTO CSE exhibits high Li-ion conductivity and, therefore, exhibits higher discharge capacity than the LLZTO CSE. These results indicate that it shows good performance even at a thin thickness compared to the composite solid electrolyte with a ‘polymer-in-ceramic’ structure shown in Fig. S5.† Fig. 6c and d show the cycling characteristics exhibited at various c rates (0.1–1.0C) at 70 °C. At lower current densities of 0.1 and 0.2C, there were no significant differences observed between the LLZTO and BM-LLZTO CSEs. However, as the current density exceeded 0.5C, a detectable discrepancy in capacity retention was observed between the two samples. In the 80 μm-thick samples, the discharge capacity retention rates exhibited by LLZTO at 0.5 and 1.0C were 79% and 40% and those by BM-LLZTO were 91% and 55%, respectively. At 60 μm thickness, the discharge capacity retention rates at 0.5 and 1.0C were 81% and 16% for LLZTO and 88% and 41% for BM-LLZTO, respectively. Fig. 6e and f show the cyclability exhibited by the LLZTO and BM-LLZTO CSEs at various thicknesses, determined over 100 cycles at a rate of 0.33C across the potential window between 2.5 and 4.0 V at 70 °C. At 80 μm thickness, the LLZTO and BM-LLZTO CSEs exhibited discharge capacity retention rates of 83.1% and 87.6%, respectively. In the case of the LLZTO CSE at a thickness of 60 μm, the capacity tended to decrease rapidly after 50 cycles. In contrast, in the case of the BM-LLZTO CSE, it was observed that the discharge capacity retention rate remained high at 81.1% over 100 cycles. These results confirmed that the BM-LLZTO CSE exhibited stable cycling characteristics and high discharge capacity as a result of the strong Li-ion transfer capability.
Conclusions
We investigated the properties exhibited by an electrolyte sheet as a function of the LLZTO particle size, which functioned as an active filler in CSEs. Through controlling the particle size via the ball-milling process, a CSE exhibiting twice the lithium transference number was fabricated. The variations in the Li-ion transport pathways as a result of a change in the particle size were investigated through Li NMR analysis. Finally, the analysis of the characteristics exhibited by the LFP/CSEs/Li coin cell confirmed that the discharge capacity, capacity retention rate, and c-rate characteristics were high when the particle size was controlled via ball milling. In addition, as the thickness of the electrolyte was reduced to increase the energy density, it was confirmed that the capacity retention rate over 100 cycles was 81.1% higher when using BM-LLZTO in comparison to the rapid capacity decrease exhibited by LLZTO during cycling. These results show that tailoring the particle size can accelerate the migration of Li ions through the interface of the PEO-based solid electrolyte sheet.Conflicts of interest
There are no conflicts to declare.Acknowledgements
This research was conducted by the Ministry of Trade, Industry & Energy (MOTIE) and the Korea Institute for Advancement of Technology (KIAT) through the Encouragement Program for National Innovation and Convergence Complex to promote socioeconomic effects by efficiently utilizing the infrastructure within these regions.Notes and references
- S. Choudhury, R. Mangal, A. Agrawal and L. A. Archer, Nat. Commun., 2015, 6, 10101, DOI:10.1038/ncomms10101.
- A. Manthiram, Y. Fu, S.-H. Chung, C. Zu and Y.-S. Su, Chem. Rev., 2014, 114, 11751–11787, DOI:10.1021/cr500062v.
- Y. Xia, J. Zheng, C. Wang and M. Gu, Nano Energy, 2018, 49, 434–452, DOI:10.1016/j.nanoen.2018.04.062.
- M. Forsyth, L. Porcarelli, X. Wang, N. Goujon and D. Mecerreyes, Acc. Chem. Res., 2019, 52, 686–694, DOI:10.1021/acs.accounts.8b00566.
- A. Manthiram, X. Yu and S. Wang, Nat. Rev. Mater., 2017, 2, 1–16, DOI:10.1038/natrevmats.2016.103.
- K. Xu, Chem. Rev., 2014, 114, 11503–11618, DOI:10.1021/cr500003w.
- K. Xu, Chem. Rev., 2004, 104, 4303–4417, DOI:10.1021/cr030203g.
- C. W. Nan, L. Z. Fan, Y. H. Lin and Q. Cai, Phys. Rev. Lett., 2003, 91, 266104, DOI:10.1103/PhysRevLett.91.266104.
- F. M. Gray, Polymer Electrolytes, Royal Society of Chemistry, 1997 Search PubMed.
- B. Scrosati, Applications of Electroactive Polymers, Springer, 1993 Search PubMed.
- J. Nunes-Pereira, C. M. Costa and S. Lanceros-Mendez, J. Power Sources, 2015, 281, 378–398, DOI:10.1016/j.jpowsour.2015.02.010.
- Y. Sun, J. Wang, D. Fu, F. Zhang, Z. Wang, X. Chen, J. Xu, J. Hu and X. Wu, ACS Sustainable Chem. Eng., 2021, 9, 2237–2245, DOI:10.1021/acssuschemeng.0c08008.
- M. A. K. L. Dissanayakem, P. A. R. D. Jayathilaka, R. S. P. Bolkalawala, L. Albinsson and B.-E. Mellander, J. Power Sources, 2003, 119–121, 409–414, DOI:10.1016/S0378-7753(03)00262-3.
- W. Liu, D. Lin, J. Sun, G. Zhou and Y. Cui, ACS Nano, 2016, 10, 11407–11413, DOI:10.1021/acsnano.6b06797.
- C. Niu, J. Liu, G. Chen, C. Liu, T. Qian, J. Zhang, B. Cao, W. Shang, Y. Chen, J. Han, J. Du and Y. Chen, J. Power Sources, 2019, 417, 70–75, DOI:10.1016/j.jpowsour.2019.02.004.
- Q. Liu, Z. Geng, C. Han, Y. Fu, S. Li, Y. B. He, F. Kang and B. Li, J. Power Sources, 2018, 389, 120–134, DOI:10.1016/j.jpowsour.2018.04.019.
- L. Zhu, P. Zhu, S. Yao, X. Shen and F. Tu, Int. J. Energy Res., 2019, 43, 4854–4866, DOI:10.1002/er.4638.
- H. Zhai, P. Xu, M. Ning, Q. Cheng, J. Mandal and Y. Yang, Nano Lett., 2017, 17, 3182–3187, DOI:10.1021/acs.nanolett.7b00715.
- K. K. Fu, Y. Gong, J. Dai, A. Gong, X. Han, Y. Yao, C. Wang, Y. Wang, Y. Chen, C. Yan, Y. Li, E. D. Wachsman and L. Hu, Proc. Natl. Acad. Sci. U. S. A., 2016, 113, 7094–7099, DOI:10.1073/pnas.1600422113.
- X. Zhang, T. Liu, S. Zhang, X. Huang, B. Xu, Y. Lin, B. Xu, L. Li, C. W. Nan and Y. Shen, J. Am. Chem. Soc., 2017, 139, 13779–13785, DOI:10.1021/jacs.7b06364.
- W. Zhou, S. Wang, Y. Li, S. Xin, A. Manthiram and J. B. Goodenough, J. Am. Chem. Soc., 2016, 138, 9385–9388, DOI:10.1021/jacs.6b05341.
- T. Famprikis, P. Canepa, J. A. Dawson, M. S. Islam and C. Masquelier, Nat. Mater., 2019, 18, 1278–1291, DOI:10.1038/s41563-019-0431-3.
- J. Zhang, N. Zhao, M. Zhang, Y. Li, P. K. Chu, X. Guo, Z. Di, X. Wang and H. Li, Nano Energy, 2016, 28, 447–454, DOI:10.1016/j.nanoen.2016.09.002.
- L. Chen, Y. Li, S.-P. Li, L.-Z. Fan, C.-W. Nan and J. B. Goodenough, Nano Energy, 2018, 46, 176–184, DOI:10.1016/j.nanoen.2017.12.037.
- S. H. Yang, M. Y. Kim, D. H. Kim, H. Y. Jung, H. M. Ryu, J. H. Han, M. S. Lee and H.-S. Kim, J. Ind. Eng. Chem., 2017, 56, 422–427, DOI:10.1016/j.jiec.2017.07.041.
- Z. Li, H.-M. Huang, J.-K. Zhu, J.-F. Wu, H. Yang, L. Wei and X. Guo, ACS Appl. Mater. Interfaces, 2019, 11, 784–791, DOI:10.1021/acsami.8b17279.
- J. Zheng, M. Tang and Y.-Y. Hu, Angew. Chem., 2016, 128, 12726–12730, DOI:10.1002/ange.201607539.
- M. J. Lee, D. O. Shin, J. Y. Kim, J. Oh, S. H Kang, J. Kim, K. M. Kim, Y. M. Lee, S. O. Kim and Y.-G. Lee, Energy Storage Mater, 2021, 37, 306–314, DOI:10.1016/j.ensm.2021.02.013.
- Z. Huang, W. Pang, P. Liang, Z. Jin, N. Grundish, Y. Li and C. Wang, J. Mater. Chem. A, 2019, 7, 16425–16436, 10.1039/c9ta03395e.
- J. Zagórski, J. M. López del Amo, M. J. Cordill, F. Aguesse, L. Buannic and A. Llordés, ACS Appl. Energy Mater, 2019, 2, 1734–1746, DOI:10.1021/acsaem.8b01850.
- X. Zhang, B.-Q. Xu, Y.-H. Lin, Y. Shen, L. Li and C.-W. Nan, Solid State Ionics, 2018, 327, 32–38, DOI:10.1016/j.ssi.2018.10.023.
- Y. Li, W. Zhang, Q. Dou, K. W. Wong and K. M. Ng, J. Mater. Chem. A, 2019, 7, 3391–3398, 10.1039/c8ta11449h.
Footnote |
| † Electronic supplementary information (ESI) available. See DOI: 10.1039/d1ra06210g |
| This journal is © The Royal Society of Chemistry 2021 |

