 Open Access Article
Rheological behavior, crystallization properties, and foaming performance of chain-extended poly (lactic acid) by functionalized epoxy
Ming Li ab,
Shengnan Lib,
Bujin Liu
 ab,
Tuanhui Jiangab,
Di Zhangab,
Lushuai Caoab,
Li He*ab and
Wei Gong*c
aThe Institute of Materials and Metallurgy of Guizhou University, Guiyang, China
bNational Engineering Research Center for Compounding and Modification of Polymer Materials, Guiyang, China
cThe Institute of Materials and Construction of Guizhou Normal University, Guiyang, China. E-mail: gongw@gznu.edu.cn; lihe@gzu.edu.cn
First published on 5th October 2021
Abstract
The inherently linear poly (lactic acid) suffers unsatisfying foaming behavior due to its low melt strength and poor crystallization properties. To overcome this drawback, a random terpolymer of ethylene, acrylic ester and glycidyl methacrylate (EGMA) was employed to improve the rheological behavior, crystallization properties, and foaming performance of poly (lactic acid) (PLA) through a chain extension reaction. The branched/micro-crosslinked structure formed by the chain extension reaction between EGMA and PLA effectively improved the dynamic rheological properties of PLA. As the content of EGMA increased from 0 wt% to 20 wt%, the crystal nucleation and crystal growth rate of various PLA samples have been significantly accelerated, resulting in a larger number and smaller size of spherulites, and the crystallinity of various PLA samples increased from 7.9% to 38.54%. The cell size of various PLA foams decreased from 53.5 to 22.0 μm and the cell density increased from 3.5 × 10⁶ cells per cm3 to 2.5 × 10⁷ cells per cm3, meanwhile, the cellular morphology of PLA foam was obviously improved. Moreover, the actual weight loss of PLA foams reached 26.1%, which is higher than the theoretical weight loss.
1. Introduction
In recent years, due to the increasingly serious resource crisis and environmental pollution caused by traditional fossil-based non-degradable polymers, bio-based and biodegradable polymers have attracted more and more attention as green materials.1,2 As a renewable resource-based aliphatic semicrystalline polyester, poly (lactic acid) (PLA) can be biodegraded and composted under favorable conditions.3,4 Being a thermoplastic with properties that are comparable to some commodity polymers, it is viewed as a viable alternative to petroleum-sourced plastics. As part of the drive for renewable-source based products, thermoplastic foams made out of PLA have attracted considerable attention in sectors such as packaging, cushioning and thermal and sound insulation.5,6 However, as a biodegradable aliphatic thermoplastic polyester, PLA exhibits some defects such as a linear molecular structure, low molecular weight, weak crystallization ability and low melt strength, which hinder its further application, especially in the foaming field.7 Therefore, in order to obtain PLA foams with better foaming performance, PLA is usually necessary to be modified. Among many modification methods (chain extension, blending, filling, etc.) which had been widely used in actual production, chain extension was one of the most effective methods.8–13Wang X. et al.5 employed poly (ethylene octene) grafted with glycidyl methacrylate (POE-g-GMA) to improve the rheological, thermal properties, toughness and foaming behaviors of poly (lactic acid) (PLA) through a chain extension effect, and prepared PLA foams with more regular cell morphology by supercritical CO2 foaming. However, the cell size of the foams had not been reduced effectively and was still too large. Ying wei Di et al.8 used 1,4-butane diisocyanate as a chain extender to increase the molecular weight of PLA through coupling and chain extension reactions to form a branched structure, and prepared PLA foam with small cell size and high cell density. Wei Liu et al.14 prepared high foamability PLA resin by inducing chain extender through grafting octa(epox-ycyclohexyl) polyhedral oligomeric silsesquioxanes (POSS) on carbon nanotubes (CNT). In fact, chain extension can modify the crystallization behaviors of PLA, which improves the foaming behaviors of PLA by two aspects.15 On the one hand, the generated crystals can be acted as physical cross-linking points, which is conducive to improve the melt strength and foamability of PLA as well as restrict the blowing agent gas loss and cell coalescence during the foaming process.16 On the other hand, the interfaces between crystalline region and amorphous region can be treated as the heterogeneous nucleation sites for the cell nucleation to enhance cell density.17 At the same time, chain extension can enhance the foamability of PLA by improving the viscoelasticity of PLA. Owing to foaming occur in the molten state, the melt strength of the resin is the main factor controlling the cell size.18 The high melt viscosity is helpful to restrict the cell coalescence and rupture during cell growth stage, leading to the smaller cells.19 The increase in melt viscoelasticity is beneficial to improve the foaming performance of PLA and increase the volume expansion rate (VER) of foamed PLA.20 As explained above, chain extension is an effective way to improve the foaming performance of PLA.
At present, there is a little literature reported about the preparation of PLA foams by chemical injection foaming molding. Compared with autoclave foaming which is widely studied nowadays, chemical injection foaming molding is closer to actual production and application. However, some defects of PLA mentioned above usually cause poor foaming quality of PLA foams prepared by chemical injection foaming molding. Therefore, we selected ethylene-acrylic ester-glycidyl methacrylate terpolymer (EGMA) as an effective chain extender to modify the molecular weight and molecular chain structure of PLA, and prepared PLA foams containing different EGMA contents by chemical injection foaming molding. The effect of the addition of EGMA on the crystallization properties, rheological behavior and foaming performance of PLA was systematically studied. Besides, we analyzed the influence of EGMA on the foaming quality and weight loss of various PLA samples, and prepared PLA foams with uniform cell size and high cell density, which could provide guidance for the development of PLA industrialized foam products.
2. Experiment
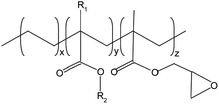
2.1 Materials
Poly (lactic acid) (PLA), injection molding grade, was supplied by Anhui Fengyuan Futailai Polylactic Acid Co. Ltd. Ethylene-methyl acrylate-glycidyl methacrylate random terpolymer (EGMA, Lotader AX8900) with 8% glycidyl methacrylate ester (GMA) content was supplied by French Arkema company. The chemical structures and characteristics of the two materials are shown in Table 1. Azodicarbonamide (AC, gas emission 220 ml g−1) was supplied by Wuhan Hanhong Chemical Plant. Zinc stearate (Zn(st)2) was supplied by Wenzhou Jia Da Plastic Additives Co., Ltd. Zinc oxide (ZnO) was supplied by Xiangyun County Hongxiang Co., Ltd. LDPE (2426H) was supplied by Lanzhou Petrochemical Co. China, with the MFR of 1.8 g/10 min.2.2 Sample preparation
![[thin space (1/6-em)]](https://www.rsc.org/images/entities/char_2009.gif) :
:![[thin space (1/6-em)]](https://www.rsc.org/images/entities/char_2009.gif) 3, then added to 90 parts of PLA evenly mixed.21 The foaming auxiliary masterbatch was prepared by twin screw extruder (CTE35, it was the same as that used in the foaming masterbatch preparation) to extrude granulation. The temperature of each section of the extruder from hopper to the die was set from 155 °C to 170 °C. The screw rotation speed was 150 rpm and the feeding speed was 10 rpm. ZnO/Zn(St)2 is a conventional activator of AC foaming agent, and the complexation between ZnO/Zn(St)2 and AC foaming agent can effectively promote the activation and decomposition of foaming agent.
3, then added to 90 parts of PLA evenly mixed.21 The foaming auxiliary masterbatch was prepared by twin screw extruder (CTE35, it was the same as that used in the foaming masterbatch preparation) to extrude granulation. The temperature of each section of the extruder from hopper to the die was set from 155 °C to 170 °C. The screw rotation speed was 150 rpm and the feeding speed was 10 rpm. ZnO/Zn(St)2 is a conventional activator of AC foaming agent, and the complexation between ZnO/Zn(St)2 and AC foaming agent can effectively promote the activation and decomposition of foaming agent.![[thin space (1/6-em)]](https://www.rsc.org/images/entities/char_2009.gif) :
:![[thin space (1/6-em)]](https://www.rsc.org/images/entities/char_2009.gif) 10
10![[thin space (1/6-em)]](https://www.rsc.org/images/entities/char_2009.gif) :
:![[thin space (1/6-em)]](https://www.rsc.org/images/entities/char_2009.gif) 5 mass fraction ratio. The standard tensile samples were prepared by the microcellular injection-foaming molding machine (EM120-V, Zhen de plastic machinery Co., Ltd. Through the mold design, our research group modified the ordinary EM120-V injection molding machine and formed a characteristic microcellular injection-foaming molding machine for foaming.) using a core-back foam injection molding (FIM) technique. The temperature of each section of the injection machine from hopper to the die was set from 165 °C to 180 °C. The core-back distance was from 3.2 mm to 4.0 mm with the distance of micro-opening being 0.8 mm.
5 mass fraction ratio. The standard tensile samples were prepared by the microcellular injection-foaming molding machine (EM120-V, Zhen de plastic machinery Co., Ltd. Through the mold design, our research group modified the ordinary EM120-V injection molding machine and formed a characteristic microcellular injection-foaming molding machine for foaming.) using a core-back foam injection molding (FIM) technique. The temperature of each section of the injection machine from hopper to the die was set from 165 °C to 180 °C. The core-back distance was from 3.2 mm to 4.0 mm with the distance of micro-opening being 0.8 mm.2.3 Characterizations
![[thin space (1/6-em)]](https://www.rsc.org/images/entities/char_2009.gif) :
:![[thin space (1/6-em)]](https://www.rsc.org/images/entities/char_2009.gif) 2. The mixed powder was pressed into a thin sheet with a diameter of 1 cm using a sampler. The infrared spectrometer (Nexus-6700, Nicolet, USA) was adopted to characterize the reaction between EGMA and PLA in the range of 4000–400 cm−1.
2. The mixed powder was pressed into a thin sheet with a diameter of 1 cm using a sampler. The infrared spectrometer (Nexus-6700, Nicolet, USA) was adopted to characterize the reaction between EGMA and PLA in the range of 4000–400 cm−1.Uniaxial elongation rheological characterization was tested on a HAAKE Mars60 Rotational Rheometer (Thermo Fisher Scientific, USA) using the SER tool at 180 °C under a nitrogen atmosphere. The strain rate was 0.05 s−1 in this test. The mold cavity volume was adjusted by core-back to prepare a 1.0 mm thick spline, and then a small cuboid with a length of 25 mm, a width of 10 mm, and a thickness of 1.0 mm was taken for the uniaxial elongational viscosity tests. Before the rheological tests, all the samples were placed in the rheometer and heat to 180 °C and keep for 2 min to completely melt the sample.
 | (1) |
 | (2) |
 | (3) |
 | (4) |
 | (5) |
In the above formula, W0 and W1 (%) were theoretical and actual weight loss respectively, ΔH and H1 (mm) were the distance of micro-opening and thickness of the foam sample respectively. where ρ0 and ρf (g cm−3) were the apparent densities of samples before and after foaming process.
3. Results and discussion
3.1 Structure analysis of chain-extended poly (lactic acid) (CPLA)
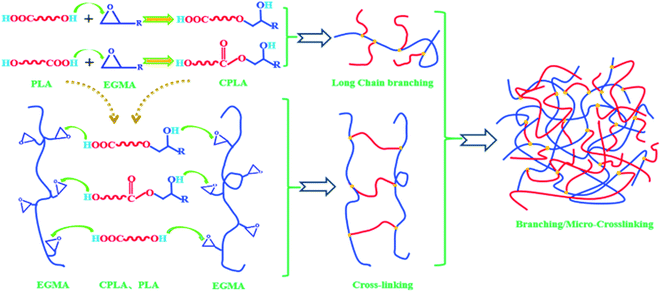
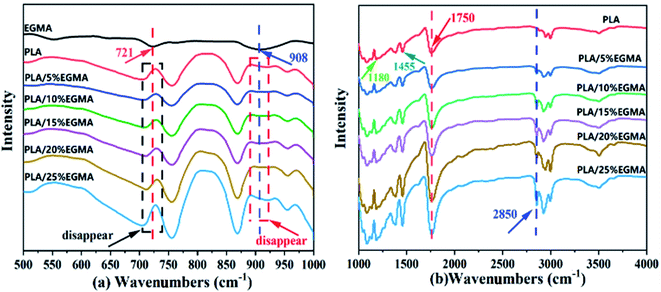
PLA has terminal hydroxyl and terminal carboxyl groups. EGMA is a ternary random copolymer of ethylene, acrylate and glycidyl methacrylate. The epoxy groups on the EGMA side groups are reactive with –COOH and –OH in PLA. For this reason, adding a multifunctional epoxy compound for chain extension/branching reaction is conducive to obtaining chain-extended poly (lactic acid) (CPLA) with a long-chain branched structure. The reaction diagram between the terminal hydroxyl, terminal carboxyl and epoxy groups is shown in Fig. 1. When one end group of the PLA molecular chain reacts with EGMA, the other end group can also continue to participate in the reaction. In addition, whether the epoxy group reacts with the terminal hydroxyl group or the terminal carboxyl group, a new hydroxyl group will be generated. Therefore, the new group formed by the ring-opening reaction of PLA and the epoxy group still contains two active functional groups (one hydroxyl group and one carboxyl group or two hydroxyl groups), which can continue to react with the epoxy group on the EGMA. And the similar ring-opening reaction repeats constantly, which contributes to forming PLA with a branched/micro-crosslinked structure finally.Fig. 2 shows the FTIR spectra of EGMA, pure PLA and CPLA. In Fig. 2(a), the characteristic absorption peaks of epoxy groups at 721 cm−1 and 908 cm−1 could be observed for EGMA. Both characteristic peaks disappeared when EGMA was added to PLA, which indicated that the PLA/EGMA blend could undergo a series of reactions during the melt blending process, and the epoxy groups were consumed in the chain extension reaction between EGMA and PLA.5,20 In Fig. 2(b), some characteristic peaks of PLA could be observed in the FTIR spectra of various PLA samples, which were the C![[double bond, length as m-dash]](https://www.rsc.org/images/entities/char_e001.gif) O vibration peak in the ester group at 1180 cm−1, the C–H deformation vibration peak at 1455 cm−1, and tensile vibration peak of C
O vibration peak in the ester group at 1180 cm−1, the C–H deformation vibration peak at 1455 cm−1, and tensile vibration peak of C![[double bond, length as m-dash]](https://www.rsc.org/images/entities/char_e001.gif) O in ester group at 1750 cm−1.22 The C
O in ester group at 1750 cm−1.22 The C![[double bond, length as m-dash]](https://www.rsc.org/images/entities/char_e001.gif) O absorption peak of CPLA gradually enhanced with the increase of EGMA content, this could be attributed to more ester carbonyl groups (C
O absorption peak of CPLA gradually enhanced with the increase of EGMA content, this could be attributed to more ester carbonyl groups (C![[double bond, length as m-dash]](https://www.rsc.org/images/entities/char_e001.gif) O) which were formed for the further intensification of the ring-opening chain extension reaction. In addition, only the chain-extended PLA had a characteristic peak at 2850 cm−1 that was related to the out-of-plane bending vibration of CH2 in the ethylene segment of EGMA. It could be inferred that the reaction between PLA and EGMA had occurred successfully, and the modified PLA had formed branched/crosslinked molecular structure.23
O) which were formed for the further intensification of the ring-opening chain extension reaction. In addition, only the chain-extended PLA had a characteristic peak at 2850 cm−1 that was related to the out-of-plane bending vibration of CH2 in the ethylene segment of EGMA. It could be inferred that the reaction between PLA and EGMA had occurred successfully, and the modified PLA had formed branched/crosslinked molecular structure.23
3.2 Rheological behaviour
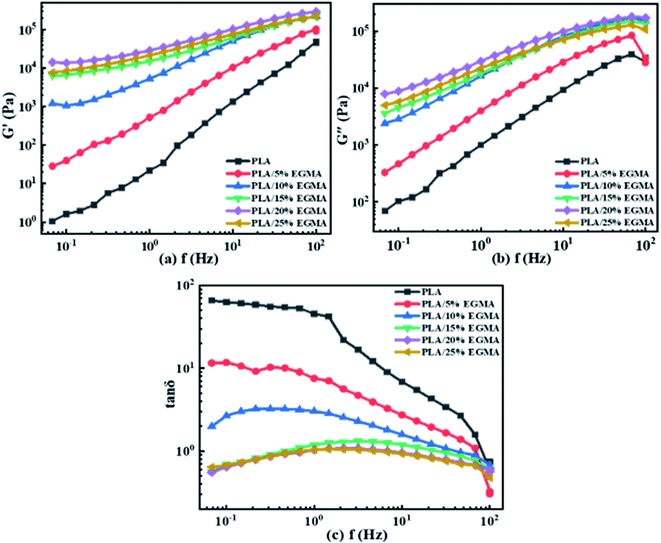
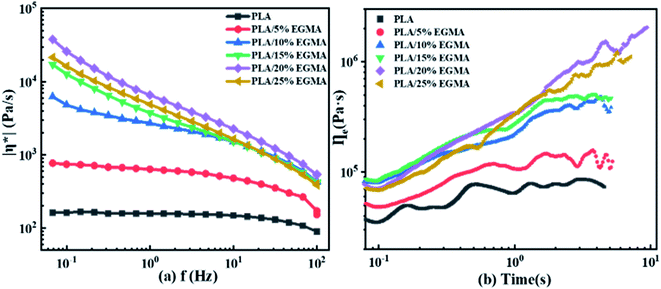
![[thin space (1/6-em)]](https://www.rsc.org/images/entities/char_2009.gif) δ) on f for diverse PLA specimens. The change in the elastic response of PLA/EGMA melt was represented by tan
δ) on f for diverse PLA specimens. The change in the elastic response of PLA/EGMA melt was represented by tan![[thin space (1/6-em)]](https://www.rsc.org/images/entities/char_2009.gif) δ, which was defined as the ratio of G′′/G′. The larger the tan
δ, which was defined as the ratio of G′′/G′. The larger the tan![[thin space (1/6-em)]](https://www.rsc.org/images/entities/char_2009.gif) δ, the greater the viscidity, and on the contrary the smaller the tan
δ, the greater the viscidity, and on the contrary the smaller the tan![[thin space (1/6-em)]](https://www.rsc.org/images/entities/char_2009.gif) δ, the greater the elasticity.24 Compared with G′, tan
δ, the greater the elasticity.24 Compared with G′, tan![[thin space (1/6-em)]](https://www.rsc.org/images/entities/char_2009.gif) δ value accurately reflected the factor of melt elastic response rather than the magnitude of melt elasticity.25 With increasing EGMA concentration, the tan
δ value accurately reflected the factor of melt elastic response rather than the magnitude of melt elasticity.25 With increasing EGMA concentration, the tan![[thin space (1/6-em)]](https://www.rsc.org/images/entities/char_2009.gif) δ of various PLA samples gradually decreased at the entire measured f range. This phenomenon indicated that the elastic response of various PLA samples became faster, and their viscous dissipation gradually decreased, which caused their foamability could be enhanced effectively. This was owing to the increment in number of entanglement points for various PLA samples after chain extension, and those entanglement points could be acted as the physical network sites to enhance the melt elasticity of PLA/EGMA blend.26
δ of various PLA samples gradually decreased at the entire measured f range. This phenomenon indicated that the elastic response of various PLA samples became faster, and their viscous dissipation gradually decreased, which caused their foamability could be enhanced effectively. This was owing to the increment in number of entanglement points for various PLA samples after chain extension, and those entanglement points could be acted as the physical network sites to enhance the melt elasticity of PLA/EGMA blend.26
3.3 Crystallization properties
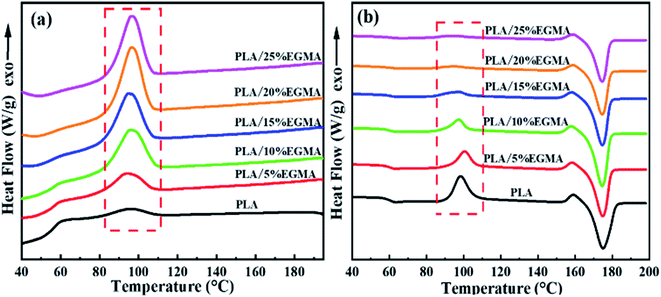
The DSC curves and thermal parameters of various PLA samples are plotted in Fig. 5 as well as compared in Table 2, respectively. Fig. 5 revealed that the cooling crystallization peak of various PLA samples gradually increased with the increase of EGMA, and the cold crystallization peak of heating curves gradually decreased, as a result, the crystallinity of various PLA samples gradually increased from 7.90% to 38.54%. This is because pure PLA is a semi-crystalline polymer with poor crystallization ability and slow crystallization rate. As for CPLA, the branching degree of CPLA increased as the chain extension reaction intensified, and a large number of branch points could be treated as heterogeneous nucleation sites of CPLA crystals. The branched structure enhanced the nucleation ability of CPLA crystals and improved the crystallinity.5 However, as the EGMA content continued to increase from 20% to 25%, the XC (crystallinity) of the CPLA samples dropped from 38.54% to 37.67%. This was owing to the excessive gel formed in the CPLA sample, which restricted the nucleation and growth of CPLA crystals.7 The improvement of crystallization properties could ameliorate the foaming performance of PLA from two aspects: on the one hand, the generated crystals could be acted as physical cross-linking points, which was conducive to improve the melt strength and foamability of CPLA as well as restricted the blowing agent gas loss and cell coalescence during the foaming process.16 On the other hand, the interfaces between crystalline region and amorphous region could be treated as the heterogeneous nucleation sites for the cell nucleation to enhance cell density.17| Sample | Tg (°C) | Tc (°C) | Tm (°C) | ΔHc (J g−1) | ΔHm (J g−1) | XC (%) |
|---|---|---|---|---|---|---|
| PLA | 59.40 | 98.42 | 175.04 | 35.38 | 42.77 | 7.90 |
| PLA/5%EGMA | 59.23 | 100.70 | 174.85 | 23.07 | 37.33 | 16.04 |
| PLA/10%EGMA | 58.92 | 98.05 | 174.34 | 18.47 | 38.89 | 24.24 |
| PLA/15%EGMA | 60.34 | 97.66 | 174.74 | 9.75 | 36.56 | 33.70 |
| PLA/20%EGMA | 60.34 | 95.07 | 174.66 | 4.43 | 33.29 | 38.54 |
| PLA/25%EGMA | 60.41 | 94.43 | 174.65 | 4.89 | 31.34 | 37.67 |
3.4 POM observation
POM was utilized to check the spherulite growth rate and morphology of diverse PLA specimens isothermally crystallized at 120 °C and the corresponding POM micrographs were exhibited in Fig. 6. Well-defined spherulites with representative Maltese cross were observed in the POM images of diverse PLA specimens, revealing a typical homogeneous crystallization nucleation.28 It was noteworthy that the crystallite structure and crystallization kinetics of the pure PLA and CPLA were quite different. In the pure PLA, several minutes were required for the nucleation with only a small number of crystals, and these crystals grew very slowly. With the EGMA presence, both the crystal nucleation and the crystal growth rates dramatically accelerated, thus, a greater number of crystals, which were smaller, were created in the CPLA. This was attributed to the formation of branching structures which could be acted as the points of crystallization nucleation to enhance the number of spherocrystals after chain extension.29 Meanwhile, the mobility of PLA molecular chains was reduced by the formation of branching structures, which would hinder PLA molecular chains moving into the crystal lattice and limit spherocrystal growth.30 In summary, the generation of branching structure had double effects on the crystallization of PLA. The formation of branching structures in CPLA was favorable for crystallization nucleation and disadvantageous for crystallization growth, resulting in the generation of a large number of small spherocrystals in CPLA.31 The cross-linked network formed by many small and dense crystals as physical cross-linking points could effectively improve the melt strength of PLA. It could be also found that the changes in crystallization properties observed by POM were consistent with the DSC test results.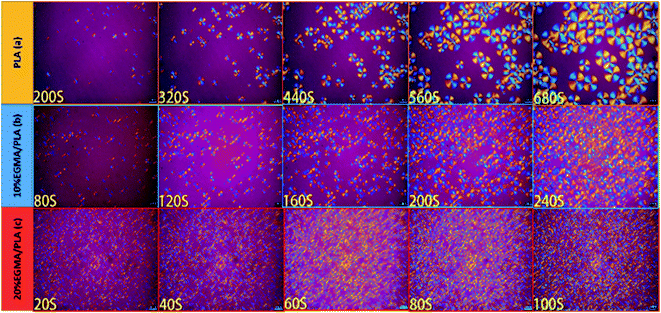 | ||
| Fig. 6 POM images of various PLA samples isothermally crystallized at 120 °C: (a) pure PLA, (b) PLA/10%EGMA, (c) PLA/20%EGMA. | ||
3.5 Foaming performance of various PLA foams
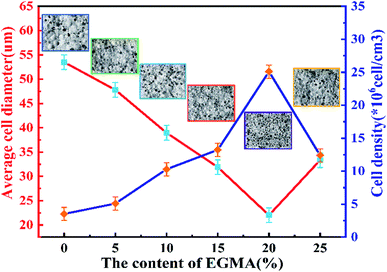
Fig. 7 shows the cell structure and cell diameter distribution of various PLA foams with different EGMA contents. The corresponding average diameter and cell density are shown in Fig. 8. It could be found that the cells of pure PLA foam were larger and deformed seriously with the average cell size of about 53.5 μm, the cell density about 3.1 × 10⁶ cells per cm3, and wider the cell size distribution (Fig. 7(a)).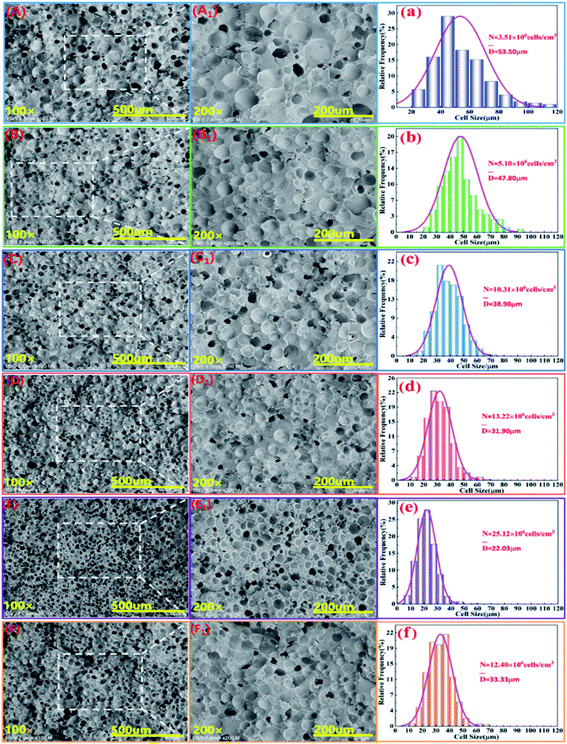 | ||
| Fig. 7 SEM micrographs (A–F: ×100, A1–F1: ×200) and cell size distribution (a–f) of various PLA foams, EGMA mass fraction: (A) 0 wt%; (B) 5 wt%; (C) 10 wt%; (D) 15 wt%; (E) 20 wt%; (F) 25 wt%. | ||
These findings could be attributed to the low melt strength and poor crystallization properties of pure PLA. The normal distribution curve of cell diameter of various PLA foams gradually shifted to the low value area of the X axis when the mass fraction of EGMA increased from 0% to 20%, which responded the average cell diameter of various PLA foams gradually decreased from 53.5 μm to 22.03 μm, meanwhile, the cell density increased from 3.51 × 10⁶ cells per cm3 to 25.12 × 10⁶ cells per cm3 and the cell distribution became more uniform. Compared with the pure PLA, CPLA significantly improved the foam morphology with smaller cell size to provide regular cells. At the same time, the density of the cell increased and the distribution narrowed (Fig. 7(b–f)), especially when the addition amount of EGMA was 20 wt%. After which the EGMA content continued to increase excessively, the average cell size increased and the cell density decreased greatly with the foaming quality beginning to deteriorate (see Fig. 7F1). This was mainly due to the fact that the addition of EGMA not only improved the crystallization properties of PLA, but also made a large number of heterogeneous nucleation sites form between the crystalline region and the amorphous region to effectively increase the cell density. Meanwhile, EGMA enhanced greatly the melt strength of CPLA (see the analysis and discussion part of Fig. 3 and 4), so that the bubble core could expand to form cells, and larger stress was generated on the cell wall during the cell growth stage, which could inhibit the rapid growth of the cells and reduce the phenomenon of cell deformation, rupture and coalescence.32 As a result, we could obtain PLA foams with uniform cell size and high cell density.
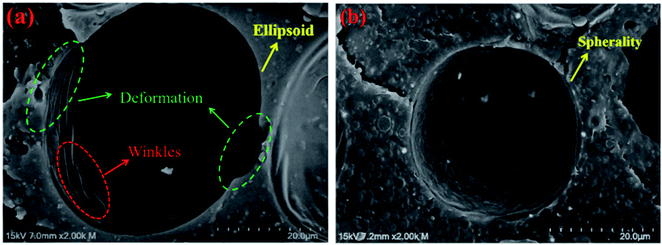
Fig. 9 shows single cell structures (×2K) of pure PLA foam and PLA/20%EGMA foam. It could be observed from Fig. 9 that the cell of pure PLA foam had undergone obvious deformation which was like ellipsoid, and there were a lot of rough wrinkles on the cell wall, while the cell morphology of PLA/20%EGMA foam tended to be more regular spheres, and the cell wall was smoother and flatter. On the one hand, melt elasticity was the key factor to control cellular morphology during the growth of cells. High melt elasticity could withstand the stretching force during cell growing process, and ensured that the gas in the bubble expanded evenly around, while avoiding cell rupture or serious cell collapse during cell growing process, so that the cellular morphology became more regular.33 On the other hand, the poor crystallization performance of pure PLA resulted in slow formation and uneven distribution of crystal regions, which would cause uneven shrinkage of the resin on the cell wall during the foam cooling and molding process, resulting in the formation of a large number of wrinkles on the cell wall and deformed cells. However, the rapid formation of dense and uniform crystal regions in the PLA/20%EGMA composites could make the bubble stable quickly and prevent the cells from deforming significantly, thereby forming a more regular cell morphology that tends to be spheres.
3.6 Weight loss behavior of various PLA foams
In our previous studies, we had found that there were two cell forming processes, “foam during filling” process and “foam after filling” process, in microcellular injection-molding process, and the melt pressure in the filling stage was the dominant factor affecting the cell forming processes. In filling stage, the melt near the flow front with a pressure lower than a critical pressure value would foam during filling. But the melt near the gate with a pressure higher than the critical pressure value would not foam during filling, and it foamed in cooling stage after filling stage.34 “Foam during filling” would lead to excessive weight loss. These two kinds of cell forming processes in microcellular injection molding were shown in Fig. 10.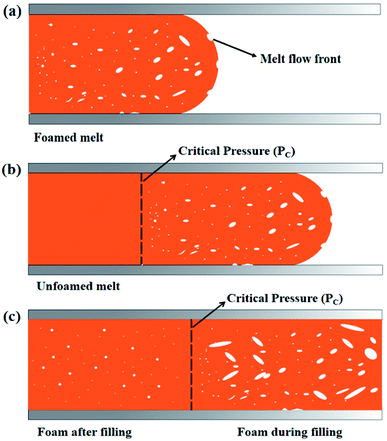 | ||
| Fig. 10 Cell-forming processes in microcellular injection molding: (a) early filling stage; (b) mid filling stage; (c) after micro opening. | ||
The average densities of various PLA foams and its weight loss range are shown in Fig. 11. From Fig. 11(a), it could be seen that the densities of the various PLA foams gradually decreased with the increase of EGMA. It was because the densities of pure PLA and EGMA were 1.252 g cm−3 and 0.94 g cm−3 respectively, and the density of EGMA was less than pure PLA. Therefore, the densities of various PLA samples decreased in an orderly manner as the EGMA content gradient increased, and the downward trend was almost a slope fixed straight line. The densities of CPLA foams decreased to 0.876 g cm−3 with the EGMA content increasing from 0% to 20%, after which the densities of CPLA foams increased with the EGMA content continuing to rise. This was because the densities of CPLA foams were not only affected by the relative content of PLA and EGMA, but also by the foaming quality. The melt strength of PLA/EGMA blend increased as the content of EGMA raised, which could effectively restrict the overgrowth, merging and rupture of cells and reduced gas escape during the foaming process,27 and foaming quality was significantly improved, thereby the densities of CPLA foams was further reduced. However, the foaming quality of CPLA foams would decrease and the densities the CPLA foams increased when EGMA was overmuch.
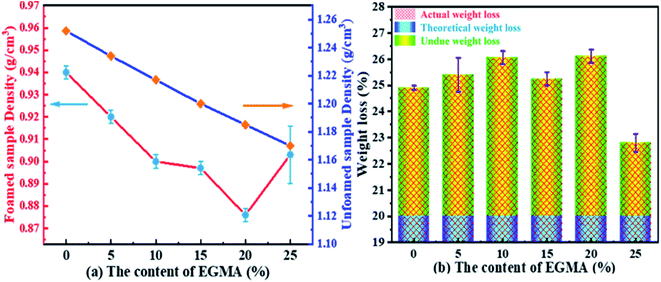 | ||
| Fig. 11 Average densities and weight loss of various PLA foams: (a) sample density (g cm−3), (b) weight loss (%). | ||
Fig. 11(b) indicated that the actual weight loss of all PLA foams were greater than the theoretical weight loss. This was due to the fact that there would be in the formation of cells when the melt was in the process of filling the cavity (Fig. 10(a and b), “foam during filling” process, which caused the melt filled into the cavity was not dense before the micro-molding, but partially foamed resin.35 The actual injection volume of the injection molding machine was less than the theoretical injection volume, which resulted in the actual weight loss generally greater than the theoretical weight loss. Fig. 11(b) also indicated that the actual weight loss of the various PLA foams increased from 24.9% to 26.1% as the content of EGMA increased from 0% to 20%, after that, the weight loss decreased with the EGMA content continuing to increase. This attributed to the fact that the melt pressure would gradually increase during the filling process, and the lower melt strength of the resin would bring about the lower ability to confine gas, which caused the generated cells were more likely to deform, merge, rupture and finally gas escaped. As a result, resin injected in the filling stage was denser and injection volume of the injection machine increased, so that the weight loss of the foamed sample was reduced. However, increasing melt strength of PLA could make the phenomenon of cell rupture and gas escape during the filling stage improved by addition of EGMA, so that the number of cells and gas content in the resin was greater and the actual injection volume of the injection molding machine was less, which caused the weight loss of various PLA foams were greater finally. But the melt strength of PLA/EGMA blend would decrease when EGMA was overmuch, and the number of cells and gas content in the resin during the filling stage would also decrease, which resulted in an increase in the injection volume and a decrease in weight loss.
4. Conclusions
In this paper, PLA/EGMA blending foams were prepared by the melt blending and chemical injection foaming. Due to the branched/micro-crosslinked structure between PLA and EGMA, the viscoelasticity and complex viscosities of various PLA samples were significantly improved, and this structure imparted conspicuous strain-hardening behavior to the PLA melts. At the same time, a large number of branching sites in PLA after chain extension could be acted as nucleation sites for crystallization, which significantly increased the crystallization rate and spherulite density of PLA, while reducing spherulite size. The obvious improvement of rheological behavior and crystallization properties of PLA provided a great environment for the growth and shaping of cells, which helped to form the cell structure with smaller size, greater density and more regular morphology, thus achieving the purpose of improving the foaming performance. In addition, the weight loss behavior of PLA foams was affected by foaming performance, and excellent foaming performance would lead to greater weight loss. Based on the above research, we obtained a simple and effective method to improve PLA foaming quality, which would provide some guidance for the development of PLA injection foaming molding products.Conflicts of interest
There are no conflicts to declare.Acknowledgements
This research was funded by Research Institute Service Enterprise Action Plan Project of Guizhou Province (NO. [2018]4010), National Natural Science Foundation of China (NO. 51863003, NO. 52063008) and the Hundred Talents Project of Guizhou Province, Grant Number (NO. [2016]5673); Key Projects of Guizhou Provincial Fund (N0. ZK [2021]050, No. [2019]1176), The Science and Technology Program of Guiyang City, Guizhou Province (No. [2019]14).References
- B. Qi, Z. M. Xu, T. Liu and L. Zhao, Polym. Mater. Sci. Eng., 2010, 26, 138–141 CAS.
- H. Tsuji and I. Fukui, Polymer, 2003, 44, 2891–2896 CrossRef CAS.
- J. R. Rocca-Smith, R. Pasquarelli, A. Lagorce-Tachon, J. Rousseau, S. Fontaine, V. Aguié-Béghin and T. Karbowiak, ACS Sustainable Chem. Eng., 2019, 7, 3759–3771 CrossRef CAS.
- L. T. Lim, R. Auras and M. Rubino, Prog. Polym. Sci., 2008, 33, 820–852 CrossRef CAS.
- X. Wang, J. Mi, J. Wang, H. Zhou and X. Wang, RSC Adv., 2018, 8, 34418–34427 RSC.
- M. Nofar and C. B. Park, Prog. Polym. Sci., 2014, 39, 1721–1741 CrossRef CAS.
- H. Zhou, M. Zhao, Z. Qu, J. Mi, X. Wang and Y. Deng, J. Polym. Environ., 2018, 26, 3564–3573 CrossRef CAS.
- Y. Di, S. Iannace, E. Di Maio and L. Nicolais, Macromol. Mater. Eng., 2005, 290, 1083–1090 CrossRef CAS.
- S. Pilla, A. Kramschuster, J. Lee, C. Clemons, S. Gong and L. S. Turng, J. Mater. Sci., 2010, 45, 2732–2746 CrossRef CAS.
- K. Li, Z. Cui, X. Sun, L. S. Turng and H. Huang, J. Biobased Mater. Bioenergy, 2011, 5, 442–451 CrossRef CAS.
- H. Zhao, G. Zhao, L. S. Turng and X. Peng, Ind. Eng. Chem. Res., 2015, 54, 7122–7130 CrossRef CAS.
- S. Pilla, A. Kramschuster, S. Gong, A. Chandra and L. S. Turng, Int. Polym. Process., 2007, 22, 418–428 CrossRef CAS.
- M. Mihai, M. A. Huneault and B. D. Favis, Polym. Eng. Sci., 2010, 50, 629–642 CrossRef CAS.
- W. Liu, X. Zhu, H. Gao, X. Su and X. Wu, Cell. Polym., 2020, 39, 117–138 CrossRef CAS.
- M. Mihai, M. A. Huneault and B. D. Favis, J. Appl. Polym. Sci., 2009, 113, 2920–2932 CrossRef CAS.
- J. Wang, W. Zhu, H. Zhang and C. B. Park, Chem. Eng. Sci., 2012, 75, 390–399 CrossRef CAS.
- K. Taki, D. Kitano and M. Ohshima, Ind. Eng. Chem. Res., 2011, 50, 3247–3252 CrossRef CAS.
- P. Tiwary, C. B. Park and M. Kontopoulou, Eur. Polym. J., 2017, 91, 283–296 CrossRef CAS.
- T. R. Kuang, H. Y. Mi, D. J. Fu, X. Jing, B. Y. Chen, W. J. Mou and X. F. Peng, Ind. Eng. Chem. Res., 2015, 54, 758–768 CrossRef CAS.
- J. Song, J. Mi, H. Zhou, X. Wang and Y. Zhang, Polym. Degrad. Stab., 2018, 157, 143–152 CrossRef CAS.
- B. Liu, T. Jiang, X. Zeng, R. Deng, J. Gu, W. Gong and L. He, Polym. Adv. Technol., 2021, 32, 2102–2117 CrossRef CAS.
- S. Milovanovic, D. Markovic, A. Mrakovic, R. Kuska, I. Zizovic, S. Frerich and J. Ivanovic, Mater. Sci. Eng., C, 2019, 99, 394–404 CrossRef CAS PubMed.
- B. Xue, H. He, Z. Zhu, J. Li, Z. Huang, G. Wang and Z. Zhan, Polymers, 2018, 10, 1401 CrossRef PubMed.
- C. Wang, H. Duan, C. Zhang, T. Jiang, H. Li and G. Wei, Polym. Mater. Sci. Eng., 2016, 32, 131–136 CAS.
- W. Liu, X. Wu, Y. Ou, H. Liu and C. Zhang, E-Polymers, 2021, 21, 96–107 CrossRef CAS.
- Y. Li, J. Mi, H. Fu, H. Zhou and X. Wang, ACS Omega, 2019, 4, 12512–12523 CrossRef CAS PubMed.
- N. Najafi, M. C. Heuzey, P. J. Carreau, D. Therriault and C. B. Park, Rheol. Acta, 2014, 53, 779–790 CrossRef CAS.
- J. Ramontja, S. S. Ray, S. K. Pillai and A. S. Luyt, Macromol. Mater. Eng., 2009, 294, 839–846 CrossRef CAS.
- Y. Yang, X. Li, Q. Zhang, C. Xia, C. Chen, X. Chen and P. Yu, J. Supercrit. Fluids, 2019, 145, 122–132 CrossRef CAS.
- M. Buccella, A. Dorigato, E. Pasqualini, M. Caldara and L. Fambri, Polym. Eng. Sci., 2014, 54, 158–165 CrossRef CAS.
- L. Wei, H. Shicheng and Z. Hongfu, J. Appl. Polym. Sci., 2018, 135, 46399 CrossRef.
- G. Wang, J. Zhao, K. Yu, L. H. Mark, G. Wang, P. Gong and G. Zhao, Polymer, 2017, 119, 28–39 CrossRef CAS.
- W. Liu, S. He and Y. Yang, Polym. Int., 2019, 68, 516–526 CrossRef CAS.
- G. Dong, G. Zhao, Y. Guan, G. Wang and X. Wang, J. Appl. Polym. Sci., 2014, 131, 383–390 Search PubMed.
- G. Dong, G. Zhao, Y. Guan, S. Li and X. Wang, J. Cell. Plast., 2016, 52, 419–439 CrossRef CAS.
| This journal is © The Royal Society of Chemistry 2021 |


