DOI:
10.1039/D1RA06535A
(Paper)
RSC Adv., 2021,
11, 34988-34995
Al-doped H2TiO3 ion sieve with enhanced Li+ adsorption performance†
Received
31st August 2021
, Accepted 18th October 2021
First published on 28th October 2021
Abstract
H2TiO3 (HTO) is considered to be one of the most promising adsorbents for lithium recovery from aqueous lithium resources duo to its highest theoretical adsorption capacity. However, its actual adsorption capacity is much lower owing to its unknown structure and incomplete leaching of lithium. After Al is doped into H2TiO3 (HTO-Al), the adsorption capacity of HTO-Al is 32.12 mg g−1 and the dissolution of Ti is 2.53%. HTO-Al has good adsorption selectivity, and all the separation factors α are ≫1. Furthermore, HTO-Al also exhibits good cyclic stability and solubility resistance. After 5 cycles, the adsorption capacity remains 29.3 mg g−1 and the dissolution rate is 1.7%. Therefore, HTO-Al has potential application value for recovering Li+ from aqueous lithium resources.
1. Introduction
Lithium is considered as the energy metal driving progress in the world because of its many excellent properties (such as strong metallicity, high charge density and so on).1 Lithium and its compounds are widely used in metallurgy, ceramics, glass, aerospace, batteries and other fields.1–8 With the rapid development of the above industries, the demand for lithium has grown remarkably, while the production capacity of lithium has increased slowly. Therefore, research on lithium extraction technology is indispensable and has great application prospects. The global lithium resources mainly exist in lithium ore, salt lake brine and seawater.9 In comparison, the lithium resources present in aqueous solution are more abundant, which can be exploited at a lower cost.1,10,11 Hence, extracting lithium from aqueous solution is very promising and worthy of further research. The technologies of extracting lithium from aqueous solution mainly include precipitation, solvent extraction and adsorption.12–14 Among these technologies, the adsorption method is fairly suitable for extracting lithium from aqueous solution and has the advantages of simple process, high recovery rate, good selectivity and environmental friendliness.15
The lithium adsorbents are mainly divided into manganese oxides, LiCl·Al(OH)3·nH2O and titanium oxides.16 Although manganese oxides have been received widespread attention due to their high adsorption capacity and selectivity, the poor solubility and cycle performance of manganese ions hinder their industrial application. In contrast, titanium oxides, especially H2TiO3 (HTO), have a higher theoretic adsorption capacity and a more stable structure which are considered to be particularly promising materials. Yan et al. calcined lithium hydroxide and rutile type titanium dioxide, and then eluted with hydrochloric acid to obtain lithium adsorbent with a lithium adsorption capacity of 10.55 mg g−1.17 Chitrakar et al. prepared ion sieve precursor Li2TiO3 by hydrochloric acid modified high temperature solid state method, and the prepared adsorbent has a lithium absorption capacity of 4.7 mmol g−1 for brine with pH = 6.5.18 Gu et al. used CH3COOLi and TiO2 as raw materials for the first time to synthesize Li2TiO3 by an improved solid-state method. After pickling, H2TiO3 adsorbent adsorbed West Taijinel Salt Lake, the lithium and magnesium separation factor reached 5441.17, and the adsorption capacity was 24.5 mg g−1 after 5 cycles.19 Zhou et al. prepared ion sieve precursor Li2TiO3 by sol–gel method using CH3COOLi and Ti(OC4H9)4 as raw materials. After elution with hydrochloric acid, the extraction rate of lithium was 50.2%, and the saturated adsorption capacity of lithium was 21.0 mg g−1.20 In order to increase the adsorption capacity of Li+ adsorbents, doping is usually employed as an effective method. Chitrakar et al. acquired Fe-doped Li4FexMn5−xO12, which has lower loss rate of Mn and higher adsorption capacity of Li+.21 Qian et al. synthesized Al-doped and Na-doped Li1.6Mn1.6O4 with better solubility loss resistance and adsorption capacity.22,23 For Li2TiO3, Wang et al. received Fe-doped and Mo-doped Li2TiO3, which possessed higher adsorption capacities.16,24 Based on the above researches, it can be predicted that the doping method is an effective and available way to improve the LTO adsorption performance. Al3+ own higher electronegativity than Ti4+ and layered Al3+ compounds (LiCl·Al(OH)3·nH2O) also have Li+ adsorption performance, but there are few reports on Al-doped HTO.23,27
In this work, Al-doped LTO with various doped amounts were prepared by improved solid-phase method. The obtained samples were characterized by XRD, SEM, TEM, XPS, FT-IR and BET, and the batch adsorption experiments (such as pH, environment temperature, lithium concentrations, adsorption selectivity and recycle stability) were systematically investigated.
2. Experimental
2.1 Preparation of Al-doped titanium lithium-ion sieves
Al-doped Li2TiO3 (LTO) precursor was synthesized by a modified solid state reaction method according to previous literature.18 In a typical procedure, TiO2, LiOH·H2O and AlCl3·6H2O were blent and milled with anhydrous alcohol according to stoichiometric molar ratio (Li![[thin space (1/6-em)]](https://www.rsc.org/images/entities/char_2009.gif) :
:![[thin space (1/6-em)]](https://www.rsc.org/images/entities/char_2009.gif) Ti
Ti![[thin space (1/6-em)]](https://www.rsc.org/images/entities/char_2009.gif) :
:![[thin space (1/6-em)]](https://www.rsc.org/images/entities/char_2009.gif) Al = (2 + x)
Al = (2 + x)![[thin space (1/6-em)]](https://www.rsc.org/images/entities/char_2009.gif) :
:![[thin space (1/6-em)]](https://www.rsc.org/images/entities/char_2009.gif) 1
1![[thin space (1/6-em)]](https://www.rsc.org/images/entities/char_2009.gif) :
:![[thin space (1/6-em)]](https://www.rsc.org/images/entities/char_2009.gif) x, x = 2%, 5%, 8%, 10%), and then dried at 60 °C. The white mixtures were calcined at 700 °C for 8 h at a certain heating rate and cooled in air subsequently, and then Al-doped LTO was obtained. The prepared Al-doped LTO (1 g) was treated with 200 mL HCl (0.2 mol L−1) at room temperature under magnetic stirring for 12 h, and the Al-doped HTO adsorbent was obtained after the wash and dry process. In this work, the different Al-doped Li2TiO3 and H2TiO3 are designated as LTO-Al-x and HTO-Al-x (x = 2%, 5%, 8%, 10%).
x, x = 2%, 5%, 8%, 10%), and then dried at 60 °C. The white mixtures were calcined at 700 °C for 8 h at a certain heating rate and cooled in air subsequently, and then Al-doped LTO was obtained. The prepared Al-doped LTO (1 g) was treated with 200 mL HCl (0.2 mol L−1) at room temperature under magnetic stirring for 12 h, and the Al-doped HTO adsorbent was obtained after the wash and dry process. In this work, the different Al-doped Li2TiO3 and H2TiO3 are designated as LTO-Al-x and HTO-Al-x (x = 2%, 5%, 8%, 10%).
2.2 Materials characterization
The crystalline structures and morphologies of the obtained materials were determined by powder X-ray diffraction (XRD) with Cu-Kα radiation and scanning electron microscope (SEM, SU8000), respectively. The concentrations of Ti4+ and Li+ were tested by inductively coupled plasma (ICP, Optima 7000DV). N2 adsorption–desorption isotherms were used to investigate the BET surface area and pore size distributions. The surface chemical composition of doped samples was analyzed by the X-ray photoelectron spectroscopy. FT-IR spectra were collected to investigate the functional group in a range from 400 cm−1 to 4000 cm−1 on a Bruker Tensor 27 spectrometer.
2.3 Adsorption experiments
The batch adsorption experiments were carried out by adding 0.1 g HTO-Al-2% into 50 mL LiCl solutions (pH = 12). The influence factors (such as pH, temperature, initial solution concentration) on the adsorption capacity of the adsorbent were investigated. In the single factor experiments, the solution pH values were adjusted by HCl (0.6 mol L−1) and KOH (10 mol L−1), the initial Li+ concentration was 12, 24, 36, 48, 96 mmol L−1, respectively, the environmental temperature range was 25 °C, 35 °C, 45 °C, respectively. The adsorption capacity of Li+ was calculated by eqn (1):| |
 | (1) |
where qe represents the saturated Li+ adsorption capacity (mg g−1); Co (mg L−1) and Ce (mg L−1) are the initial and equilibrium Li+ concentration; m and V are the weight of the HTO-Al (g) and solution volume (L), respectively.
The adsorption selectivity of HTO-Al-2% was performed by adding 0.1 g adsorbents into the MCl single and mixed solution (where M+ = Li+, Na+, K+, Rb+ or Cs+) for 8 hours. To explore the ionic selectivity for di-valence and the practicability, the relevant practicable experiments were performed on adding 0.1 g HTO-Al-2% to the Lagoco brine (50 mL). The Kd and αLi M were confirmed by eqn (3) and (4):
| |
 | (2) |
| |
 | (3) |
where
Kd refers distribution coefficient,
KLi shows distribution coefficient of Li
+,
αLi M denotes separation factors.
The cycle performance of HTO-Al-2% was achieved by continuous adsorption–desorption experiments and the adsorbent was regenerated by 0.2 mol L−1 HCl for 12 h. The contents of Li+ and Ti4+ were measured by ICP-OES. The dissolution of Ti4+ was based on eqn (4):
where
r refers to the rate of dissolved Li
+ or Ti
4+;
Ci represents the content of Li
+ or Ti
4+ in the solution;
S is the concentration of Li
+ or Ti
4+ in the solid sample.
3. Results and discussion
3.1 Materials characterization
Fig. 1(a) shows the XRD patterns of undoped and Al-doped precursors with Al/Ti mole ratios from 0 to 10%. All diffraction peaks of LTO-Al-x correspond to the layer-structured monoclinic β-Li2TiO3 phase (JCPDS card no. 33-0831) in C2/c space group.25 The increase of Al3+ doping ratio has almost no effect on the structure of LTO precursor, which is still pure Li2TiO3. After pickling by HCl, the XRD patterns of HTO-Al-2% changes significantly compared with its precursor. The intensity of the diffraction peaks of HTO-Al-2% decrease obviously. The diffraction peaks of (002) and (−131) shift to the right slightly, and (−133) peak disappears which means Li+ exchanges with H+ adequately.26 Consistent with LTO, the XRD patterns of HTO have little change with the increase of Al3+ doping ratio (Fig. S1†). The amount of doping is an important factor which has a significant effect on the adsorption performance of the adsorbents. As shown in Fig. 1(b), as the doping amount increases, the adsorption capacities increase initially and decrease afterwards, which is contrary to the Ti dissolution. The uptake of HTO-Al-2% (32.12 mg g−1) has the highest adsorption capacity and the Ti dissolution of HTO-Al-2% (2.5%) is slightly lower than that of undoped HTO. Hence, the doping amount of 2% is the optimal doping ratio for further investigation.
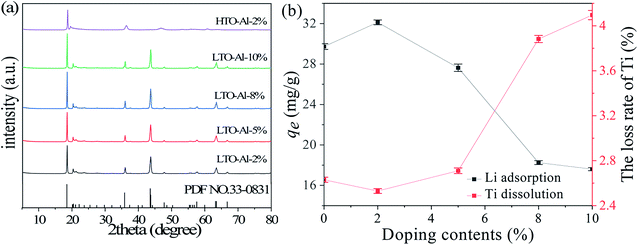 |
| | Fig. 1 (a) XRD patterns of LTO-Al-x and HTO-Al-2%; (b) the effect of different Al-doped content on Li+ adsorption and Ti dissolution (CLi+: 36 mmol L−1, CHCl: 0.2 mol L−1). | |
The morphologies of LTO-Al-2% and HTO-Al-2% are revealed by SEM (Fig. 2(a) and (b)). It can be found that the pickling process has little effect on the particle morphologies and sizes of these materials. The crystal structure of HTO-Al-2% is further characterized by TEM and the results are shown in Fig. 2(c–f). The high-resolution TEM patterns of HTO-Al-2% are used to further verify the HTO-Al-2% structure (Fig. 2(d) and (f)). The lattice spacings of HTO-Al-2% are 0.21 nm and 0.38 nm, corresponding to (−133) and (111). The clear lattice fringes indicate HTO-Al-2% has well crystallinity which is consistent with XRD results.
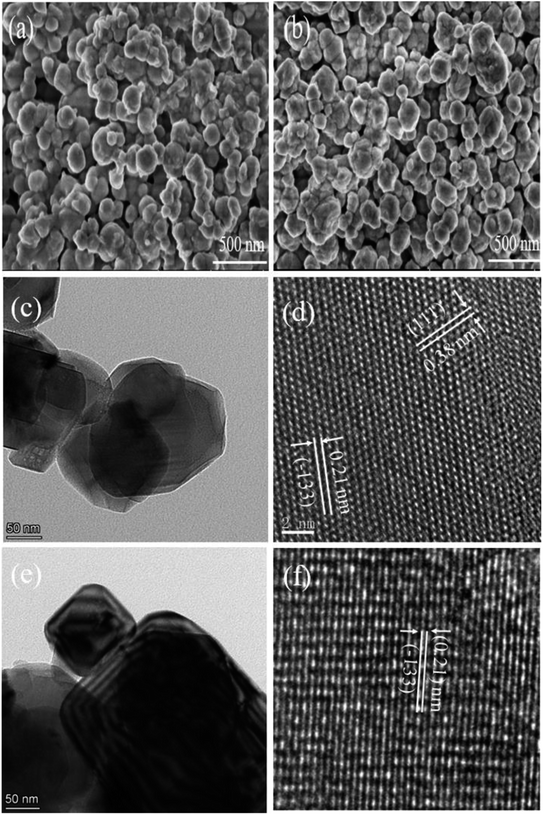 |
| | Fig. 2 SEM images of (a) LTO-Al-2% and (b) HTO-Al-2%; (c) and (e) TEM and (d) and (f) high-magnification TEM images of HTO-Al-2%. | |
Fig. 3 illustrates the FT-IR patterns of Al doped LTO-Al-2% and HTO-Al-2%. The peaks at 3469.37 cm−1 and 3477.0 cm−1 are the O–H vibrations of the adsorbed H2O. In the spectra of HTO-Al-2%, the peaks at 3136.65 cm−1 can be assigned to the O–H stretching vibration associated with H+/Li+ exchange.18 The band at 636.39 cm−1 is attributed to TiO6 octahedron vibrations. Most peaks can also be observed in the spectra of HTO-Al-2%. The characteristic peaks of TiO6 both exist in LTO-Al-2% and HTO-Al-2%, which indicate that the skeleton of TiO6 octahedron is quite stable after elution with hydrochloric acid.
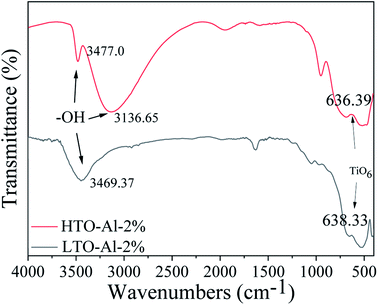 |
| | Fig. 3 The FT-IR spectra of LTO-Al-2% and HTO-Al-2%. | |
The XPS patterns of fitting curving for Al doped LTO and HTO are depicted in Fig. 4. The strong peaks of O 1s and Ti 2p can be easily identified, and the peak of Li 1s disappears after pickling, which is illustrated that the transformation from Li–O to H–O after the acid treatment. Fig. 4(b) shows the peak of Al 2p at 74.2 eV, which is indicated that Al is doped into the adsorbent successfully and stabilized after pickling. Fig. 4(c) presents the peak of Ti 2p correspond to Ti 2p1/2 and Ti 2p3/2, which is proved the chemical state of Ti is Ti(IV).27 Basing on these, the valence states do not change in the adsorption process, and the Li+ adsorption behavior is an ion exchange process.28 The nitrogen adsorption/desorption and the pore size distributions are revealed in Fig. S2.† The BET surface area of HTO-Al-2% is calculated to be 12.87 m2 g−1. While for undoped HTO is 4.39 m2 g−1. The results indicate that the BET surface area was improved by doped with Al, which may result in the increase of adsorption capacity.29,30
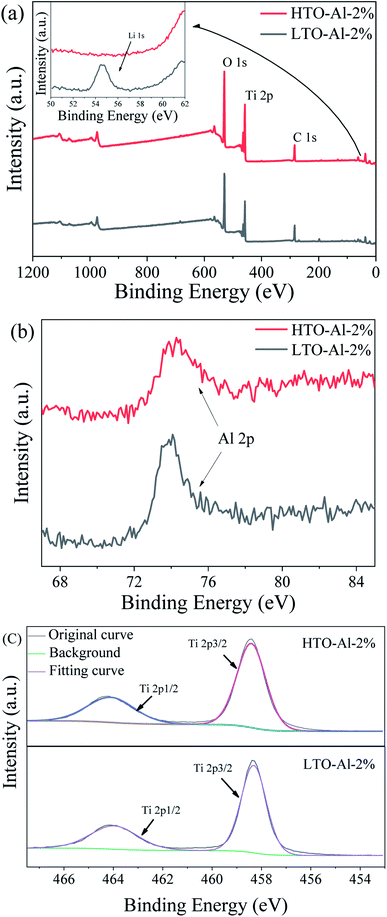 |
| | Fig. 4 XPS of LTO-Al-2% and HTO-Al-2%: (a) XPS spectra for full region; (b) XPS spectra for Al 3d; (c) XPS spectra for Ti 2p. | |
3.2 Li+ adsorption
3.2.1 Effect of pH on adsorption capacity. As shown in Fig. 5, the pH of the solution has a significant effect on the adsorption capacity. The adsorption capacity is 0.02 mg g−1 at pH = 4 and increases slowly until pH = 11. When pH = 12, the adsorption capacity dramatically increases to 32.12 mg g−1. In a word, the alkaline environments are favorable for ion exchange between Li+/H+, as shown in eqn (5).| | |
H2TiO3 + Li+ → Li2TiO3 + H+
| (5) |
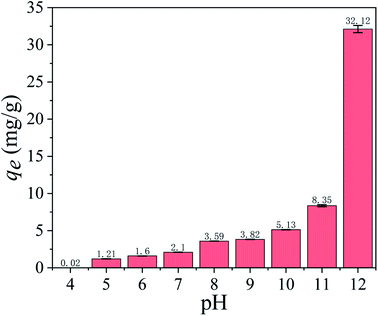 |
| | Fig. 5 Effect of pH on Li+ adsorption capacity (Co: 36 mmol L−1, T: 25 °C, t: 8 h). | |
3.2.2 Adsorption isotherms. To illustrate the Li+ adsorption behaviors, the Langmuir and Freundlich models are used to fit the adsorption process:| |
 | (6) |
| |
 | (7) |
Ce (mg L−1) denotes the equilibrium Li+ concentration, qe and qm (mg g−1) mean the empirical and theoretical maximal adsorption capacity, b indicates the Langmuir constant (L mg−1), kF and n signify the Freundlich constant.The fitting curves are displayed in Fig. 6 and the relevant parameters are listed in Table 1. The results indicate the adsorption processes fit better by the Langmuir isotherm according to the R2, showing that the Li+ is only adsorbed in a single layer.
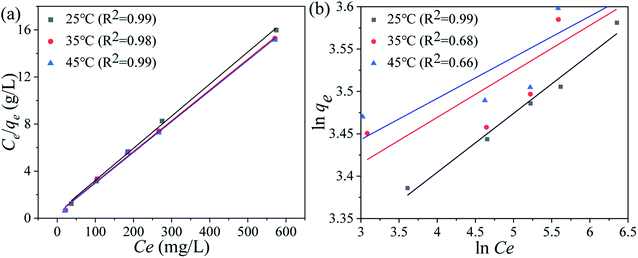 |
| | Fig. 6 (a) Langmuir and (b) Freundlich isotherm models of the Li+ uptake processes. | |
Table 1 The fitting results of the Langmuir and Freundlich isotherms models for Li+ adsorbed on HTO-Al-2% at different reaction temperature
| T (°C) |
Langmuir |
Freundlich |
| qm (mg g−1) |
b (g L−1) |
R2 |
kF (mg g−1) |
1/n |
R2 |
| 25 °C |
34.67 |
0.14 |
0.99 |
22.65 |
0.07 |
0.97 |
| 35 °C |
35.27 |
0.32 |
0.98 |
25.47 |
0.06 |
0.68 |
| 45 °C |
35.67 |
0.38 |
0.99 |
26.74 |
0.05 |
0.66 |
3.2.3 Adsorption kinetics. The Li+ adsorption process of HTO-Al-2% was fitted by the pseudo-first-order and pseudo-second-order models for further investigation. The equations are as follows:| |
ln(qe − qt) = ln![[thin space (1/6-em)]](https://www.rsc.org/images/entities/char_2009.gif) qe − k1t qe − k1t
| (8) |
| |
 | (9) |
where qe and qt indicate the adsorption capacities at equilibrium or a certain time t (min), k1 and k2 denote the pseudo-first-order and pseudo-second-order coefficients.The fitting results of the adsorption kinetics are given in Fig. 7 and Table 2. At different concentrations of Li+, all the R2 values of the pseudo-second-order model are higher than that of the pseudo-first-order model. This result means the adsorption behavior is more consistent with the pseudo-second-order model and the Li+ adsorption process is a chemical adsorption.31 The influence of different concentrations on the adsorption capacity of Li+, as shown in Fig. S3,† indicates that the adsorption capacity of Li+ increases with the increase of the initial concentration.
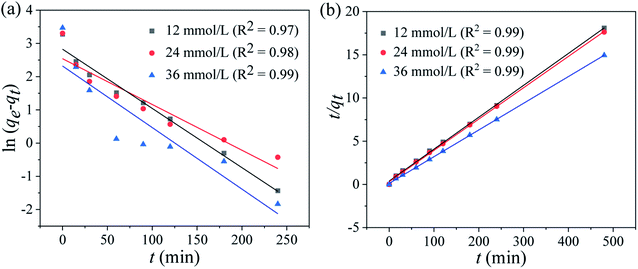 |
| | Fig. 7 (a) Pseudo-first-order and (b) pseudo-second-order kinetics models for Li+ adsorption on HTO-Al-2% at different Li+ concentrations (adsorbent: 0.1 g, volume: 50 mL, shaking speed: 180 rpm, temperature: 25 °C). | |
Table 2 The pseudo-first-order and pseudo-second-order kinetics models for Li+ adsorption on HTO-Al-2% at different Li+ concentrations
| Co (mg g−1) |
Pseudo-first-order |
Pseudo-second-order |
| qe,exp (mg g−1) |
qe,cal (mg g−1) |
K1 (min−1) |
R2 |
qe,cal (mg g−1) |
K1 (min−1) |
R2 |
| 12 |
26.52 |
25.04 |
0.05 |
0.97 |
27.28 |
0.07 |
0.99 |
| 24 |
27.23 |
25.63 |
0.06 |
0.98 |
27.53 |
0.1 |
0.99 |
| 36 |
32.12 |
31.48 |
0.08 |
0.99 |
33.09 |
0.15 |
0.99 |
3.2.4 Adsorption selectivity. Since coexisting ions affect the Li+ adsorption process in the solutions, it is essential to investigate the ion selectivity of HTO-Al-2% in a single solution and a mixed solution. As shown in Fig. 8, the Li+ adsorption capacity in the mixed solution is 4.59 mmol g−1, which is almost the same as that in the single LiCl solution (4.63 mmol g−1). Besides, the adsorption capacities of other ions are quite low in the two solutions. The distribution coefficients (Kd) and separation factors (αLi M) of various cations are shown in Table S1.† The αLi M of Na+, K+, Rb+, Cs+ are ≫1, which is indicated HTO-Al-2% has good selectivity. This may be owing to the radius of Li+ (0.059 nm) is close to the cavities of the adsorbents while the radiuses of Na+, K+, Rb+, Cs+ are too large to enter the tunnel of adsorbents.
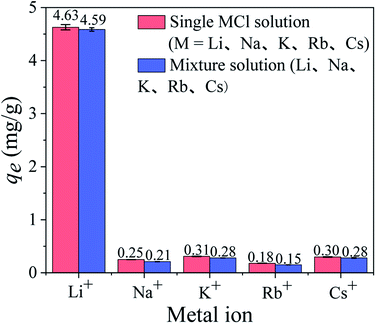 |
| | Fig. 8 The equilibrium adsorption capacities of HTO-Al-2% in the single MCl solutions and mixture solution. | |
To assess the ionic selectivity for di-valence ions such as Mg2+ and Ca2+, the relevant adsorption experiments were carried out in brine water from the Lagoco salt lake containing Mg2+ and Ca2+. The adsorption capacities of different ion and the resulting Kd values shown in Table 3 indicate that the prepared HMO-Al-2% adsorbent possess high Li+ selectivity, implying that material has the ability to separate Li+ from solutions containing Mg2+ and Ca2+ which may have promising applications for Li+ recovery.
Table 3 Relevant selectivity parameters of HTO-Al-2% in Lagoco salt lake
| Metal ions |
qe (mmol g−1) |
Kd (mL g−1) |
αLi M |
| Li+ |
3.8 |
108.93 |
1 |
| Na+ |
0.51 |
0.69 |
157.75 |
| K+ |
0.17 |
2.61 |
41.71 |
| Mg2+ |
0.07 |
2.25 |
48.49 |
| Ca2+ |
0.001 |
5.26 |
20.7 |
3.2.5 Cycle performance. Fig. 9 shows the Li+ adsorption uptake and loss rate of Ti in 5 cycle processes. It can be clearly seen the Li+ uptake and the loss of Ti reduced slowly in each cycle. In addition, the uptake of the fifth cycle remains 91.3% of the first time and the loss rate of Ti (1.7%) is less than 2%. Compared with HTO, HTO-Al-2% reveals better adsorption property and chemical stability (Fig. S4†).
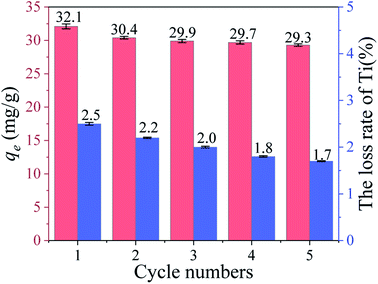 |
| | Fig. 9 The adsorption capacity and Ti dissolution of HTO-Al-2% in each regeneration process. | |
4. Conclusions
In this work, an effective method to improve the adsorption performances and the structure stability of the HTO adsorbent by Al doping is established. The Li+ adsorption capacity of HTO-Al (32.12 mg g−1) is enhanced contrast with undoped HTO (29.73 mg g−1). The adsorbents possess good Li+ selectivity in a mixed solution containing Li+, Na+, K+, Rb+, Cs+ and Lagoco salt lake. The adsorption isotherms and kinetics indicate that the Li+ adsorption behavior of HTO-Al is an endothermic process and belongs to the monolayer adsorption and chemical adsorption. In general, the HTO-Al-2% is a potential candidate as a Li+ adsorbent for industrial application.
Conflicts of interest
There are no conflicts to declare.
Acknowledgements
This work was supported by the NSFC (No. U20A20141, No. U1607105 and No. 51302280), Thousand Talents Plan in Qinghai, Natural Science Foundation in Qinghai Province (No. 2018-GX-101, No. 2019-HZ-808 and No. 2020-ZJ-901) and Youth Innovation Promotion Association, CAS (2016377).
References
- Y. Wang, H. Liu, J. Fan, X. Liu, Y. Hu, Y. Hu, Z. Zhou and Z. Ren, ACS Sustainable Chem. Eng., 2018, 7(3), 3062–3072 CrossRef.
- M. A. Delgado, M. C. Sánchez, C. Valencia, J. M. Franco and C. Gallegos, Chem. Eng. Res. Des., 2005, 83(9), 1085–1092 CrossRef CAS.
- W. Qi, J. G. Shapter, Q. Wu, T. Yin, G. Gao and D. Cui, J. Mater. Chem. A, 2017, 5(37), 19521–19540 RSC.
- K. Ni, X. Wang, Z. Tao, J. Yang, N. Shu, J. Ye, F. Pan, J. Xie, Z. Tan, X. Sun, J. Liu, Z. Qi, Y. Chen, X. Wu and Y. Zhu, Adv. Mater., 2019, 31(23), e1808091 CrossRef PubMed.
- X. Cheng, F. Xian, Z. Hu, C. Wang, X. Du, H. Zhang, S. Chen, S. Dong and G. Cui, Angew. Chem., Int. Ed. Engl., 2019, 58(18), 5936–5940 CrossRef CAS PubMed.
- G. Zubi, R. Dufo-López, M. Carvalho and G. Pasaoglu, Renewable Sustainable Energy Rev., 2018, 89, 292–308 CrossRef.
- L. Shan, Y. Wang, S. Liang, B. Tang, Y. Yang, Z. Wang, B. Lu and J. Zhou, InfoMat, 2021, 3(9), 1028–1036 CrossRef.
- H. Ding, J. Zhou, A. M. Rao and B. Lu, Natl. Sci. Rev., 2021, 8, nwaa276 CrossRef PubMed.
- P. W. Gruber, P. A. Medina, G. A. Keoleian, S. E. Kesler, M. P. Everson and T. J. Wallington, J. Ind. Ecol., 2011, 15(5), 760–775 CrossRef.
- S. E. Kesler, P. W. Gruber, P. A. Medina, G. A. Keoleian, M. P. Everson and T. J. Wallington, Ore Geol. Rev., 2012, 48, 55–69 CrossRef.
- X. Xu, Y. Chen, P. Wan, K. Gasem, K. Wang, T. He, H. Adidharma and M. Fan, Prog. Mater. Sci., 2016, 84, 276–313 CrossRef CAS.
- L. Gu, X.-L. Sun, W. Zhou, D.-H. Ren, D. Qiu, Z.-G. Gu and Z. Li, J. Radioanal. Nucl. Chem., 2015, 307(2), 973–983 CrossRef.
- D. Sun, M. Meng, Y. Qiao, Y. Zhao, Y. Yan and C. Li, Sep. Purif. Technol., 2018, 194, 64–72 CrossRef CAS.
- H. Ge, L. Chen, W. Yuan, Y. Zhang, Q. Fan, H. Osgood, D. Matera, X.-M. Song and G. Wu, J. Power Sources, 2015, 297, 436–441 CrossRef CAS.
- W.-J. Chung, R. E. C. Torrejos, M. J. Park, E. L. Vivas, L. A. Limjuco, C. P. Lawagon, K. J. Parohinog, S.-P. Lee, H. K. Shon, H. Kim and G. M. Nisola, Chem. Eng. J., 2017, 309, 49–62 CrossRef CAS.
- S. Wang, X. Chen, Y. Zhang, Y. Zhang and S. Zheng, Particuology, 2018, 41, 40–47 CrossRef CAS.
- S. W. Yan and H. Zhong, Ion Exch. Adsorpt., 1992, 8(3), 222–228 CAS.
- R. Chitrakar, Y. Makita, K. Ooi and A. Sonoda, Dalton Trans., 2014, 43(23), 8933–8939 RSC.
- D. L. Gu, W. J. Sun, G. F. Han, Q. Cui and H. Y. Wang, Chem. Eng. J., 2018, 350, 474–483 CrossRef CAS.
- L. Y. Zhang, D. L. Zhou, Q. Q. Yao and J. B. Zhou, Appl. Surf. Sci., 2016, 368, 82–87 CrossRef CAS.
- R. Chitrakar, Y. Makita, K. Ooi and A. Sonoda, Ind. Eng. Chem. Res., 2014, 53(9), 3682–3688 CrossRef CAS.
- F. Qian, B. Zhao, M. Guo, Z. Wu, W. Zhou and Z. Liu, Sep. Purif. Technol., 2021, 256, 117583 CrossRef CAS.
- F. Qian, M. Guo, Z. Qian, B. Zhao, J. Li, Z. Wu and Z. Liu, Sep. Purif. Technol., 2021, 264, 118433 CrossRef CAS.
- S. Wang, M. Zhang, Y. Zhang, Y. Zhang, S. Qiao and S. Zheng, Hydrometallurgy, 2019, 187, 30–37 CrossRef CAS.
- K. Kataoka, Y. Takahashi, N. Kijima, H. Nagai, J. Akimoto, Y. Idemoto and K. Ohshima, Mater. Res. Bull., 2009, 44(1), 168–172 CrossRef CAS.
- C. L. Yu, F. Wang, S. Y. Cao, D. P. Gao, H. B. Hui, Y. Y. Guo and D. Y. Wang, Dalton Trans., 2015, 44(35), 15721–15724 RSC.
- H. Li, L. Shen, X. Zhang, J. Wang, P. Nie, Q. Che and B. Ding, J. Power Sources, 2013, 221, 122–127 CrossRef CAS.
- B. Zhao, M. Guo, Z. Qian, J. Li, Z. Wu and Z. Liu, Dalton Trans., 2020, 49(40), 14180–14190 RSC.
- F. Qian, B. Zhao, M. Guo, Z. Qian, N. Xu, Z. Wu and Z. Liu, Hydrometallurgy, 2020, 193, 105291 CrossRef CAS.
- F. Qian, M. Guo, Z. Qian, Q. Li, Z. Wu and Z. Liu, Chemistryselect, 2019, 4(34), 10157–10163 CrossRef CAS.
- B. Zhao, Z. Qian, M. Guo, Z. Wu and Z. Liu, Chem. Eng. J., 2021, 414, 128729 CrossRef CAS.
Footnote |
| † Electronic supplementary information (ESI) available. See DOI: 10.1039/d1ra06535a |
|
| This journal is © The Royal Society of Chemistry 2021 |
Click here to see how this site uses Cookies. View our privacy policy here.  Open Access Article
 *ab and
Zhijian Wuab
![[thin space (1/6-em)]](https://www.rsc.org/images/entities/char_2009.gif) :
:![[thin space (1/6-em)]](https://www.rsc.org/images/entities/char_2009.gif) Ti
Ti![[thin space (1/6-em)]](https://www.rsc.org/images/entities/char_2009.gif) :
:![[thin space (1/6-em)]](https://www.rsc.org/images/entities/char_2009.gif) Al = (2 + x)
Al = (2 + x)![[thin space (1/6-em)]](https://www.rsc.org/images/entities/char_2009.gif) :
:![[thin space (1/6-em)]](https://www.rsc.org/images/entities/char_2009.gif) 1
1![[thin space (1/6-em)]](https://www.rsc.org/images/entities/char_2009.gif) :
:![[thin space (1/6-em)]](https://www.rsc.org/images/entities/char_2009.gif) x, x = 2%, 5%, 8%, 10%), and then dried at 60 °C. The white mixtures were calcined at 700 °C for 8 h at a certain heating rate and cooled in air subsequently, and then Al-doped LTO was obtained. The prepared Al-doped LTO (1 g) was treated with 200 mL HCl (0.2 mol L−1) at room temperature under magnetic stirring for 12 h, and the Al-doped HTO adsorbent was obtained after the wash and dry process. In this work, the different Al-doped Li2TiO3 and H2TiO3 are designated as LTO-Al-x and HTO-Al-x (x = 2%, 5%, 8%, 10%).
x, x = 2%, 5%, 8%, 10%), and then dried at 60 °C. The white mixtures were calcined at 700 °C for 8 h at a certain heating rate and cooled in air subsequently, and then Al-doped LTO was obtained. The prepared Al-doped LTO (1 g) was treated with 200 mL HCl (0.2 mol L−1) at room temperature under magnetic stirring for 12 h, and the Al-doped HTO adsorbent was obtained after the wash and dry process. In this work, the different Al-doped Li2TiO3 and H2TiO3 are designated as LTO-Al-x and HTO-Al-x (x = 2%, 5%, 8%, 10%).


![[thin space (1/6-em)]](https://www.rsc.org/images/entities/char_2009.gif) qe − k1t
qe − k1t


