 Open Access Article
Femtosecond-scale all-optical switching in oxyfluorogallate glass induced by nonlinear multiphoton absorption
Qisong Li ab,
Xinqiang Yuanb,
Xiongwei Jiangb,
Jun Wang
 b,
Yi Liu*ac and
Long Zhang
 *bc
*bc
aShanghai Key Lab of Modern Optical System, University of Shanghai for Science and Technology, Shanghai, 200093, China. E-mail: yi.liu@usst.edu.cn
bKey Laboratory of Materials for High Power Laser, Shanghai Institute of Optics and Fine Mechanics, Chinese Academy of Sciences, Shanghai, 201800, China. E-mail: lzhang@siom.ac.cn
cCAS Center for Excellence in Ultra-Intense Laser Science, Shanghai, 201800, China
First published on 1st October 2021
Abstract
Herein, all-optical switching based on a new type of oxyfluorogallate glass with high switching efficiency and ultrafast response time was reported in the near-infrared wavelength range, which is of great importance for applications in optical telecommunication. The structural and optical properties, as well as the nonlinear optical effects, of the oxyfluorogallate glass were investigated, demonstrating a good figure of merit applicable to nonlinear optical devices. Using pump–probe experiments, we found that the switching time in the oxyfluorogallate glass due to nonlinear multiphoton absorption was approximately 350 fs, which was limited by the pulse duration of the near-infrared probe pulse. Additionally, the largest on–off amplitude of this optical switching device could reach ∼12%, which is in sharp contrast to that of quartz glass. Thus, this study provides a suitable material for the manufacture of integrated photonic devices, which are crucial for promoting the application of glass on-chip photonics.
Introduction
Ultrafast optical communication, wherein photons are used as information carriers, is an important field of information research.1,2 It is based on the core concept of realizing the modulation of the states of signal light by using a controlled means, which builds the foundation of optical communication networks, such as 5 G wireless interconnects, telecomm enterprises, or datacenter communications in iCloud and servers. Ultrafast all-optical switching, which possesses the unique function of light controlling light, is an important component of on-chip ultrafast optical communication3 as well as integrated photonic technology.4 Therefore, the fabrication of high-performance optical switching devices with an ultrafast response time has attracted considerable attention owing to its potential applications. To date, many types of all-optical switching devices with different mechanisms have been proposed, such as photonic crystals,5–7 artificial nonlinear materials,8 Kerr nonlinear effects,9 dielectric ring nanocavities,10 nonlinear plasmonic nanostructures,11,12 waveguide structures,13,14 nonlinear Mach–Zehnder interferometers,15 and metal grating structures.16 Nonlinear switching media, including inorganic and organic materials, have been widely investigated. These materials include semiconductor materials,17–19 chalcogenide glasses,20–22 and polymer materials.23–25 Special structures with nonlinear effects or photonic crystals typically exhibit highly controlled switching features with ultrafast response times. However, these features are dependent on their complex micro/nanoscale structures and these devices are limited by their high-cost fabrication, which impedes their practical application. As for the nonlinear switching media, organic and thin film materials exhibit a high optical polarizability and low absorption loss. However, they are generally disregarded in technical applications because of their fragile and unstable nature. Therefore, bulk materials with a high damage threshold and easy to be fabricated are suitable for practical chip-integration applications. Bulk semiconductor materials18,19 can achieve the ultrafast response time and modulation depth, whereas it is only reported in the visible spectrum range. On the other hand, glasses have advantages over other materials, including a high damage threshold, compatibility with existing fiber technology, suitable matrix materials doped by various rare earth ions, and low optical losses, which provide wider choice on them suitable candidates for practical applications.Chalcogenide glasses with Ge–As–Se (selenide), Ge–As–S–Se (sulfoselenide), As–S–Se and Ge–Sn–Se glass systems,20,22,26,27 barium borate glasses,28,29 niobium–borotellurite glasses30 and soda–lime glasses31 have larger nonlinearity and figure of merit (FOM) than those of conventional silica glass. These materials have been recommended for application in all-optical switching devices. Furthermore, the glass materials with doping of the nanoparticles and heavy metal ions can represent larger and tunable optical nonlinearity.32–34 However, the optical switching performance and the response time at femtosecond laser scale for glass materials has not been reported until now. In our previous work,35–37 oxyfluorogallate glass, which exhibits good chemical and mechanical stability, low OH− content and optical absorption rate, acceptable thermal properties, high laser damage threshold, and relatively low cost, has been considered as another candidate material for ultrafast optical switching.
In this study, we investigated the visible and near-infrared transmittance and bandgap of oxyfluorogallate glass, which was found to vary with the sample thickness. The nonlinear optical properties were measured using the femtosecond z-scan technique to analyze the nonlinear mechanism induced by the femtosecond laser. On this basis, the FOM was calculated according to the third-order nonlinear coefficients, demonstrating its application potential for nonlinear optical devices. In subsequent experiments, ultrafast optical switching features of oxyfluorogallate glass with an ultrafast response time (∼350 fs) limited by laser duration were confirmed using a femtosecond pump–probe setup. The on–off amplitude of the all-optical switching could reach ∼12% in the experiment, which was dependent on the energy of the pump and probe lasers. Thus, this work provides a novel material for the manufacture of ultrafast optical switching devices, extending the applications of oxyfluorogallate glass material in on-chip integrated photonics.
Experimental
Oxyfluorogallate glasses with major compositions of 10BaF2–60CaO–30Ga2O3–xSr2O3, referred to as FGa glasses, were produced using conventional melting and quenching methods. Here, x represents a small amount. The three high-purity dominated ingredients, Ga2O3, GaCO3, and BaF2, and trace amounts of Sr2O3 were baked for 8 h at 200 °C in vacuum. After charging, melting, and stirring, the combined ingredients were quenched in a covered platinum crucible under a nitrogen atmosphere. Following sufficient melting, the preformed glass was discharged, demolded, and molded by pouring into a preheated platinum mold. Coarse and precious annealing were performed in a furnace around the glass transition temperature. The annealed samples were cut to a suitable size and polished for optical applications. The optical transmission spectra of the samples were measured in the range of 0.2–2.5 μm using a PerkinElmer Lambda 750 UV/VIS/NIR spectrophotometer. The elements of the samples were measured using a field emission-scanning electron microscope (FE-SEM, ZEISS, Germany) with energy dispersive spectroscopy (EDS). The chemical compositions of the samples were analyzed using X-ray photoelectron spectroscopy (XPS) (Microlab 310F) and Raman spectroscopy (LabRAM HR Evolution, Horiba). The home-built z-scan and pump–probe experiments were conducted by employing an ultrafast femtosecond laser amplifier (Spectra-Physics) with a laser wavelength of 1040 nm and pulse duration of 350 fs.Results and discussion
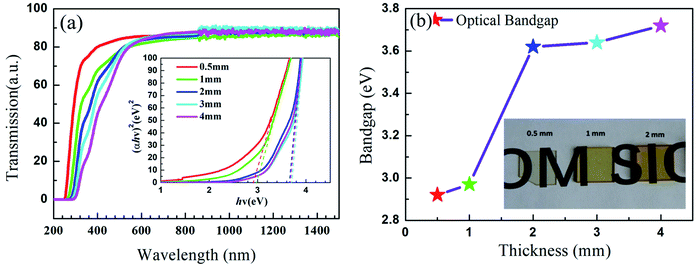
The properties of the FGa glass samples for potential optical applications, transmission spectra, and bandgap as a function of thickness are depicted in Fig. 1. The FGa glasses with different thicknesses all exhibited transmittances of ∼82–84% in the wavelength range of 600–1500 nm, indicating that the intrinsic absorption was negligible and the transmission loss was mainly due to the scattering and surface Fresnel reflection. A subtle distinction appeared as the thickness increased in the ultraviolet range. The ultraviolet cutoff regions of the FGa glass samples are depicted in the inset of Fig. 1(a), which demonstrate an increasing trend with the thickness. The optical bandgap (Eg) can be calculated from the absorption cutoff edge of the Urbach plot expressed as an (αhν)2–hν diagram, using the following relationship:38
 | (1) |
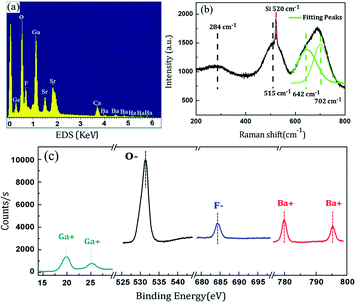 | ||
| Fig. 2 Chemical elements and structure analyses: (a) EDS, (b) Raman spectra, and (c) XPS for the oxyfluorogallate glass samples with the thickness ∼ 1 mm. | ||
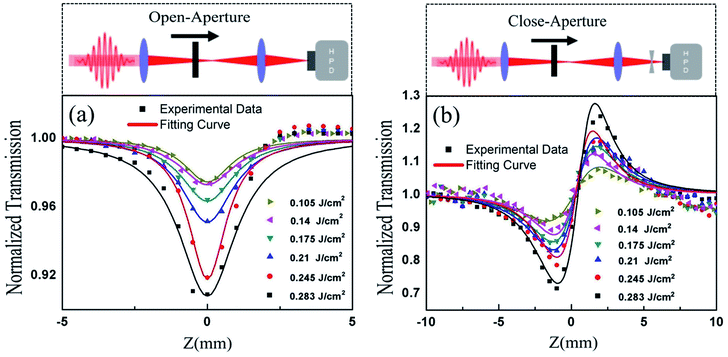
To study the nonlinear properties of FGa glass, we utilized the femtosecond z-scan method with open and closed apertures to measure the nonlinear absorption and refractive index.44 The results of FGa glass with the thickness ∼0.5 mm are depicted in Fig. 3. In the experiment, the maximum single-pulse energy of 12 μJ and repetition rate of 100 Hz obtained by the chopper were employed. The beam waist at the focal point was approximately 27 μm. The Rayleigh range was calculated to be ∼2.2 mm, which was larger than the thickness of the FGa glass. The femtosecond z-scan setup is depicted in the inset of Fig. 3. In the open-aperture measurement, the linear transmittance S is defined by S = 1 − exp(−2ra2/wa2), with S = 1. In this formula, ra and wa denote the aperture radius and beam radius, respectively. In Fig. 3(a), the open-aperture z-scan measurements for different input single-pulse energies were fitted with the standard z-scan theory:45
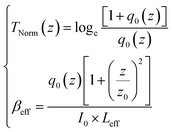 | (2) |
 | (3) |
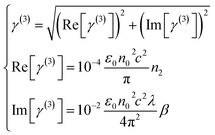 | (4) |
The nonlinear absorption and refractive coefficients of some selected glass materials are listed in Table 1. From the comparison, it can be seen that the nonlinear refractive index of FGa glass is smaller than other glass materials and the nonlinear absorption coefficient is also smaller. Small nonlinear absorption coefficient is beneficial for the nonlinear device application. The suitability of the FGa glass for optical switching can be assessed by the nonlinearity per unit nonlinear absorption, as indicated by the FOM. The FOM for the optical switching phenomenon is given as FOM = λβ/n2, and was calculated to be ∼0.74 for FGa glass. This value of the FOM can be deemed to meet the standards of nonlinear optics.22,48,49 Thus, FGa glass may be regarded as a candidate material for nonlinear devices. A femtosecond laser pump–probe setup was built to examine the optical switching effect, as depicted in Fig. 4. The femtosecond laser with a wavelength of 1040 nm was divided into two parts in the ratio 10![[thin space (1/6-em)]](https://www.rsc.org/images/entities/char_2009.gif) :
:![[thin space (1/6-em)]](https://www.rsc.org/images/entities/char_2009.gif) 1, with a strong beam as the pump laser and a weak beam as the probe beam. The pump and probe beams were focused on the same position of the sample using two lenses with focal lengths of 250 mm and 100 mm, respectively. The width of the two beams in the sample plane were measured to be ∼250 μm and 56 μm, respectively. The repetition rate of the pump light was set to 500 Hz by the chopper. We changed the polarization state of the probe light to be perpendicular to the pump light such that the detector could only receive the probe light by placing a polarizer. The probe pulse energy was measured as the time decay between the pump and probe pulses, representing the optical switching properties induced by nonlinear multiphoton absorption.
1, with a strong beam as the pump laser and a weak beam as the probe beam. The pump and probe beams were focused on the same position of the sample using two lenses with focal lengths of 250 mm and 100 mm, respectively. The width of the two beams in the sample plane were measured to be ∼250 μm and 56 μm, respectively. The repetition rate of the pump light was set to 500 Hz by the chopper. We changed the polarization state of the probe light to be perpendicular to the pump light such that the detector could only receive the probe light by placing a polarizer. The probe pulse energy was measured as the time decay between the pump and probe pulses, representing the optical switching properties induced by nonlinear multiphoton absorption.
| Glass materials | Laser wavelength and pulse width | Nonlinear absorption coefficient βeff (cm GW−1) | Nonlinear refractive index n2 (m2 W−1) |
|---|---|---|---|
| Ag–As–Se glass20 | 1050 nm | 20 | 40.3 × 10⁻¹⁷ |
| 300 ps | |||
| 33Ge–12As–55Se glasses22 | 1540 nm | 0.4 | 1.5 × 10⁻¹⁷ |
| 150 fs | |||
| Ge–Sn–Se glass27 | 3000 nm | — | 3.1 × 10⁻¹⁸ |
| 100 fs | |||
| 60B2O3–40BaO glasses28 | 1040 nm | — | 5 × 10⁻²⁰ |
| 120 fs | |||
| 10CaO–35Bi2O3–55B2O3 (ref. 29) | 800 nm | 0.028 | |
| 100 fs | |||
| 45Bi2O3–3ZnO–25B2O3 (ref. 29) | 800 nm | 1.04 | 1.5 × 10⁻¹⁹ |
| 110 fs | |||
| Fused silica29 | 1064 nm | — | 2.7 × 10⁻²⁰ |
| 75TeO2–15B2O3–10Nb2O5 (ref. 30) | 900 nm | — | 4 × 10⁻¹⁹ |
| 150 fs | |||
| 10La2O3–50PbO/Bi2O3–40B2O3 (ref. 33) | 1000 nm | 0.93 | 1.06 × 10⁻¹⁸ |
| 150 fs | |||
| 10Na2O–10ZnO–80B2O3 glasses32 | 850 nm | 7.2 × 10⁻³ | −2.6 × 10⁻¹⁷ |
| 150 fs | |||
| 10BaF2–60CaO–30Ga2O3 (this work) | 1040 nm | 5.28 × 10⁻⁴ | 7.44 × 10⁻²¹ |
| 350 fs |
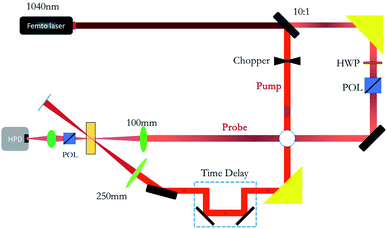 | ||
| Fig. 4 Schematic of the pump–probe experiment for optical switching measurement, Pol: polarizer, HWP: half-wave plate, HPD: high-speed photodetector. | ||
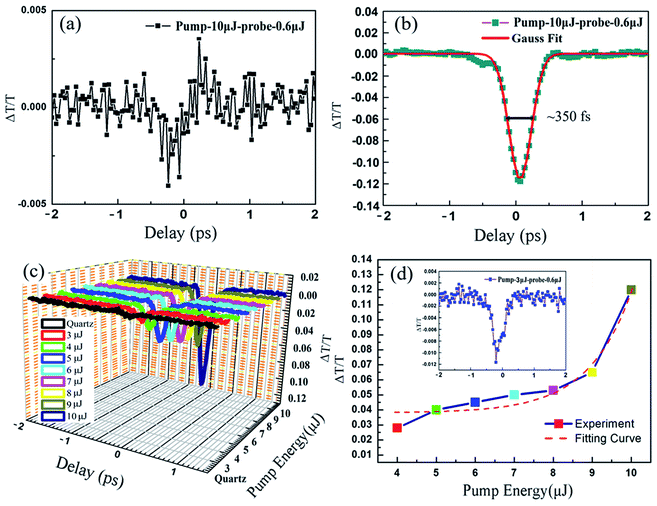
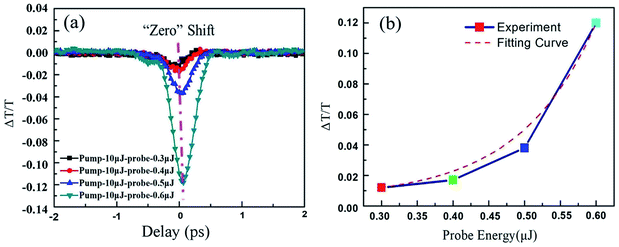
In Fig. 5, the measured optical switching performance is depicted. The probe energy was set to 0.6 μJ, and the energy of the pump pulse was changed from 3 μJ to 10 μJ. For comparison, the quartz material is the most common and usual optical material in the application and we first measured the switching performance of the quartz glass with a pump pulse energy of 10 μJ, as depicted in Fig. 5(a). Only a very small change of ∼0.2% was observed in the signal power, indicating that almost no switching effect occurred in the quartz glass. As a comparison, the ultrafast optical switching properties of the FGa glass with a pump pulse energy of 10 μJ is depicted in Fig. 5(b). Significant switching effects were obtained, reaching a maximum amplitude ∼12%, which was 60 times stronger than that of quartz glass, even for a pump pulse energy of 3 μJ as shown in the inset of Fig. 5(d). The response time is approximately the optical switching curves with pump energies from 3 to 10 μJ and quartz glass are clearly compared in Fig. 5(c). The amplitude curves of optical switching as a function of the pump energy are shown in Fig. 5(d). The experimental curve for the relationship between the switching amplitudes and pump energy was fitted by the nonlinear equation y = A0 + A1x + A2x2 + A3x3 + A4x4, where A0, A1, A2, A3, and A4 are 0.130, −0.128, 0.045, −0.006, and 2.75568 × 10⁻⁴, respectively. From the fitting equation, it can be seen that the increasing tendency of the switching amplitude is similar to that expected from the nonlinear polarization equation for the interaction of the high-intensity laser with the material. Therefore, we conclude that this effect is dominated by the nonlinear effects that appear for high-intensity lasers. This nonlinear effect can be further attributed to the multiphoton absorption based on the comparison between the optical bandgap and laser wavelength discussed in the previous paragraph. Moreover, the half-width switching time of the optical switching is approximately 350 fs, as shown in the inset of Fig. 5(b), which is limited by the probe pulse duration used. Subsequently, we verified the switching performance with a change in the probe pulse energy, as depicted in Fig. 6. The pump light energy was set to 10 μJ. We varied the probe light energies from 0.3 μJ to 0.6 μJ, and the switching amplitudes increased for higher probe pulse energies. The experimental curve representing the relation between the switching amplitudes and probe pulse energy was fitted by the nonlinear equation  . The “zero” point shift depicted in Fig. 6(a) is due to the nonlinear effect induced by the pump laser itself.
Additionally, the switching time is almost the same as that measured for the change in pump pulse energy. The optical switching performance of some optical switching are shown in Table 2. The opti1cal switching with femtosecond-scale time are usually based on the nano-composite material,8 negative index metamaterial,12 semiconductor material18 or nonlinear photonic crystals.25 To the best of our knowledge, this is the first report on femtosecond-scale all-optical switching with a large switching amplitude based on bulk glass material. Therefore, the FGa glass material with excellent properties, including high optical transmission, acceptable FOM, and ultrafast response time, demonstrates immense potential as a nonlinear switching medium for applications in all-optical switching for on-chip photonics.
| Optical switching material | Switching time | Switching ratio |
|---|---|---|
| Nano-Ag:polymeric composite material8 | ∼340 fs fast rise | ∼62% |
| ∼5 ps slow rise | ||
| Negative index metamaterial with Ag and Si thin film12 | ∼600 fs | ∼9.5% |
| InGaAsP bulk semiconductor13 | ∼10 ps | ∼40% |
| Silicon and SU-8 waveguide15 | ∼2 ps | ∼75% |
| ZnO single crystal at 600 nm (ref. 17) | ∼2.8 ps | ∼99% |
| Gallium phosphide18 | ∼10.9 fs | ∼50% |
| Silicon photonic crystals19 | ∼52 ps | — |
| Zinc phthalocyanine thin films24 | ∼2 ms | ∼60% |
| Polystyrene nonlinear photonic crystals25 | ∼10 fs | ∼50% |
| 10BaF2–60CaO–30Ga2O3 glass (this work) | ∼350 fs | ∼12% |
Conclusions
In summary, we demonstrated the all-optical switching phenomenon with a high efficiency and ultrafast response time based on oxyfluorogallate glass for near-infrared wavelengths, which is of great importance for modern optical telecommunication. The nonlinear absorption effect of oxyfluorogallate glass, including the third-order nonlinear optical susceptibility, nonlinear absorption, and refraction rates, was studied in detail using the femtosecond laser z-scan method. The multiphoton absorption effect was identified as the source of optical switching based on the optical bandgap and laser wavelength. This type of glass exhibits an acceptable FOM for application in nonlinear optical devices. With a subsequent pump–probe experiment, an ultrafast switching time of ∼350 fs was achieved, which was limited by the pulse duration of the mid-infrared laser pulses used in the experiments. More importantly, the largest on–off amplitude of this device reached up to 12%. This study opens up a new path for bulk materials as a nonlinear switching medium to manufacture integrated photonic devices and provides a wider range of material choices for the application of glass on-chip photonics.Author contributions
Qisong Li: conceptualization, investigation, data curation, writing – original draft, funding acquisition. Xinqiang Yuan: data curation. Xiongwei Jiang: data curation. Jun Wang: investigation, supervision – review & editing. Yi Li: writing – review and editing, supervision. Long Zhang: methodology, investigation, – review & editing.Conflicts of interest
The authors declare that they have no known competing financial interests or personal relationships that could have appeared to influence the work reported in this paper.Acknowledgements
This research was supported by the National Science Foundation of China (No. 61905263).References
- H. Mardoyan, F. Jorge, O. Ozolins, J. M. Estaran, A. Udalcovs, A. Konczykowska, M. Riet, B. Duval, V. Nodjiadjim, J. Y. Dupuy, X. D. Pang, U. Westergren, J. J. Chen, S. Popov and S. Bigo, in Proc. 2018 Optical Fiber Communications Conference and Exhibition T4A.4, 2018 Search PubMed.
- Y. Matsui, R. Schatz, D. Che, F. Khan, M. Kwakernaak and T. Sudo, Nat. Photon., 2021, 15, 59–63 CrossRef CAS.
- C. Huang, C. Zhang, S. Xiao, Y. H. Wang, Y. B. Fan, Y. L. Liu, N. Zhang, G. Y. Qu, H. J. Ji, J. C. Han, L. Ge, Y. Kivshar and Q. H. Song, Science, 2020, 367, 1018–1021 CrossRef CAS PubMed.
- V. R. Almeida, C. A. Barrios, R. R. Panepucci and M. Lipson, Nature, 2004, 431, 1081–1084 CrossRef CAS PubMed.
- N. Yamamoto, T. Ogawa and K. Komori, Opt. Express, 2006, 14, 1223–1229 CrossRef PubMed.
- P. R. Villeneuve, D. S. Abrams, S. H. Fan and J. D. Joannopoulos, Opt. Lett., 1996, 21, 2017–2019 CrossRef CAS PubMed.
- C. H. Lu, B. Zhu, C. Y. Zhu, L. C. Ge, Y. Liu, Y. P. Chen and X. F. Chen, Chin. Opt. Lett., 2019, 17, 072301 CrossRef.
- X. Y. Hu, P. Jiang, C. Xin, H. Yang and Q. H. Gong, Appl. Phys. Lett., 2009, 94, 031103 CrossRef.
- J. Takeda, K. Nakajima, S. Kurita, S. Tomimoto, S. Saito and T. Suemoto, Phys. Rev. B: Condens. Matter Mater. Phys., 2000, 62, 10083 CrossRef CAS.
- O. Wada, New J. Phys., 2004, 6, 183 CrossRef.
- A. Pasquazi, S. Stivala, G. Assanto, V. Amendola, M. Meneghetti, M. Cucini and D. Comoretto, Appl. Phys. Lett., 2008, 93, 091111 CrossRef.
- K. M. Dani, Z. Ku, P. C. Upadhya, R. P. Prasankumar, S. R. J. Brueck and A. J. Taylor, Nano Lett., 2009, 9, 3565–3569 CrossRef CAS PubMed.
- Y. J. Chen, V. Krishnamurthy, Y. C. Lai and S. T. Ho, Opt. Lett., 2014, 39, 3567–3570 CrossRef PubMed.
- K. J. A. Ooi, J. L. Cheng, J. E. Sipe, L. K. Ang and D. T. H. Tan, APL Photonics, 2016, 1, 046101 CrossRef.
- C. Lacava, M. J. Strain, P. Minzioni, I. Cristiani and M. Sorel, Opt. Express, 2013, 21, 21587–21595 CrossRef CAS PubMed.
- C. J. Min, P. Wang, C. C. Chen, Y. Deng, Y. H. Lu, H. Ming, T. Y. Ning, Y. L. Zhou and G. Z. Yang, Opt. Lett., 2008, 33, 869–871 CrossRef PubMed.
- M. A. M. Versteegh and J. I. Dijkuhuis, Opt. Lett., 2011, 36, 2776–2778 CrossRef CAS PubMed.
- G. Grinblat, M. P. Nielsen, P. Dichtl, Y. Li, R. F. Oulton and S. A. Maier, Sci. Adv., 2019, 5, eaaw3262 CrossRef CAS PubMed.
- T. Tanabe, M. Notomi, S. Mitsugi, A. Shinya and E. Kuramochi, Appl. Phys. Lett., 2005, 87, 151112 CrossRef.
- K. Ogusu, J. Yamasaki, S. Maeda, M. Kitao and M. Minakata, Opt. Lett., 2005, 29, 265–267 CrossRef PubMed.
- M. Asobe, T. Kanamori and K. Kubodera, IEEE Photonics Technol. Lett., 1992, 4, 362–365 Search PubMed.
- J. T. Gopinath, M. S. E. P. Ippen, V. N. Fuflyigin, W. A. King and M. Shurgalin, J. Appl. Phys., 2004, 96, 6931–6933 CrossRef CAS.
- L. Fábián, Z. Heiner, M. Mero, M. Kiss, E. K. Wolff, P. Ormos, K. Osvay and A. Dér, Opt. Express, 2011, 19, 18861–18870 CrossRef PubMed.
- A. Kumar, R. Punia, A. K. Gupta, D. Mohan and K. Kapoor, Opt. Laser Technol., 2017, 95, 100–104 CrossRef CAS.
- Y. Liu, F. Qin, Z. Y. Wei, Q. B. Meng, D. Z. Zhang and Z. Y. Li, Appl. Phys. Lett., 2009, 95, 131116 CrossRef.
- J. M. Jarnold, F. O. Ilday, F. W. Wise and B. G. Aitken, IEEE Photonics Technol. Lett., 2002, 14, 362–365 Search PubMed.
- B. J. Qiao, S. X. Dai, Y. S. Xu, P. Q. Zhang, X. Shen, T. F. Xu, Q. H. Nie, W. Ji and F. F. Chen, Opt. Mater. Express, 2015, 5, 248624 Search PubMed.
- S. N. C. Santos, J. M. P. Almeida, K. T. Paula, N. B. Tomazio, V. R. Mastelaro and C. R. Mendonça, Opt. Mater., 2017, 73, 16–19 CrossRef CAS.
- G. Jagannath, B. Eraiah, A. Gaddam, H. Fernandes, D. Brazete, K. Jayanthi, K. N. Krishnakanth, S. V. Rao, J. M. F. Ferreira, K. Annapurna and A. R. Allu, J. Phys. Chem. C, 2019, 123, 5591–5602 CrossRef CAS.
- A. G. Pelosi, S. N. C. Santos, J. Dipold, M. B. Andrade, A. C. Hernandes, J. M. P. Almeid and C. R. Mendonça, J. Non-Cryst. Solids, 2021, 878, 160382 CAS.
- A. Shehataa, M. Alia, R. Schuchb and T. Mohameda, Opt. Laser Technol., 2019, 116, 276–283 CrossRef.
- S. B. Kolavekara, N. H. Ayachitb, G. Jagannath, K. NagaKrishnakanth and S. V. Rao, Opt. Mater., 2018, 83, 34–42 CrossRef.
- P. Ramesh, V. Hegde, A. G. Pramod, B. Eraiah, S. V. Rao, S. Shisina, S. Das, D. A. Agarkov, G. M. Eliseeva, G. Jagannath and M. K. Kokila, Opt. Mater., 2020, 108, 110051 CrossRef CAS.
- G. Jagannath, B. Eraiah, K. Jayanthi, S. R. Keshri, S. Som, G. Vinitha, A. G. Pramod, K. N. Krishnakanth, G. Devarajulu, S. Balaji, S. V. Rao, K. Annapurna, S. Das and A. R. Allu, Phys. Chem. Chem. Phys., 2020, 22, 2019–2032 RSC.
- B. Tang, C. F. Wu, J. C. Li, Y. Y. Fan, H. F. Hu and L. Zhang, J. Non-Cryst. Solids, 2009, 355, 2006–2009 CrossRef CAS.
- Y. P. Peng, C. F. Wang, X. Q. Yuan and L. Zhang, J. Lumin., 2016, 172, 331–334 CrossRef CAS.
- Q. S. Li, X. Q. Yuan, X. W. Jiang, Y. F. Ju and L. Zhang, Opt. Laser Technol., 2019, 109, 659–665 CrossRef CAS.
- A. Hagfeldt and M. Gratzel, Chem. Rev., 1995, 95, 49–68 CrossRef CAS.
- A. L. Yang, H. Z. Wu, Z. F. Li, D. J. Qiu, Y. Chang, J. F. Li, P. J. McCann and X. M. Fang, Chin. Phys. Lett., 2000, 17, 606–608 CrossRef CAS.
- D. A. McKeown and C. I. Merzbacher, J. Non-Cryst. Solids, 1995, 183, 61–72 CrossRef CAS.
- P. Charton and P. Armand, J. Non-Cryst. Solids, 2004, 333, 307–315 CrossRef CAS.
- B. V. Padlyak, K. Fabisiak and G. B. Stryganyuk, in Abstract Book: 3rd Workshop on Functional Materials (FMA'2006), University of Athens, Athens, Greece, 2006 Search PubMed.
- B. V. Padlyak, Ukr. J. Phys. Opt., 2008, 9, 51–59 CrossRef CAS.
- Z. X. Yang, L. L. Han, Q. Yang, X. H. Ren, S. Z. U. Din, X. Y. Zhang, J. C. Leng, J. B. Zhang, B. T. Zhang, K. J. Yang, J. L. He, C. L. Li and J. Wang, Chin. Opt. Lett., 2021, 19, 031401 CrossRef.
- M. S. Bahae, A. A. Said, T. H. Wei, D. J. Hagan and E. W. V. Stryland, IEEE J. Quantum Electron., 1990, 26, 760–769 CrossRef.
- C. H. Kwak, Y. L. Lee and S. G. Kim, J. Opt. Soc. Am. B, 1999, 16, 600–604 CrossRef CAS.
- S. J. Mathews, S. C. Kumar, L. Giribabu and S. V. Rao, Opt. Commun., 2007, 280, 206–212 CrossRef CAS.
- T. Huang, Z. Hao, H. Gong, Z. Liu, S. Xiao, S. Li, Y. Zhai, S. You, Q. Wang and J. G. Qin, Chem. Phys. Lett., 2008, 451, 213–217 CrossRef CAS.
- M. Y. Shubar, H. L. Saadon and S. J. Abbas, Chin. Opt. Lett., 2020, 18, 011902 CrossRef.
| This journal is © The Royal Society of Chemistry 2021 |

