 Open Access Article
Simultaneous determination of four phenolic acids in traditional Chinese medicine by capillary electrophoresis-chemiluminescence
Shuopeng Yanga,
Yanzhen Hanb,
Kairui Wanga,
Yu Wanga,
Liping Lia,
Nan Lic and
Xiangdong Xu *a
*a
aSchool of Public Health, Key Laboratory of Environment and Human Health of Hebei Medical University, Shijiazhuang 050017, China. E-mail: xuxd@hebmu.edu.cn
bTianjin Center for Disease Control and Prevention, Tianjin 300011, China
cHebei University of Chinese Medicine, Shijiazhuang 050200, China
First published on 20th October 2021
Abstract
Chlorogenic, ferulic, vanillic, and caffeic acids are phenolic acids found in natural drugs. They possess the biological activities of scavenging free radicals and inhibiting thrombus formation. Phenolic acids can inhibit the oxidation of low-density lipoprotein, as well as have anti-inflammatory effects. This paper reports for the first time a capillary electrophoresis–chemiluminescence (CE–CL) method for the simultaneous determination of the four phenolic acids found in traditional and proprietary Chinese medicine, including Lycium chinense Miller, Shuanghuanglian oral liquid, and Taraxacum mongolicum granules. Capillary electrophoretic separation was performed on a self-assembled CE–CL device with an uncoated fused-silica capillary (66 cm effective length, 50 μm i.d.), and the background electrolyte was composed of 3.0 × 10⁻⁵ M Ag(III) (pH = 12.01), 3.0 mM luminol (pH = 9.20), and 10 mM sodium tetraborate solution. The injection time was 12 s (under gravity) and the separation voltage was 22 kV. The combination of solid-phase extraction (SPE) and CE–CL improves the sensitivity. Under optimal conditions, calibration graphs displayed a linear range between 0.625 and 20.0, 1.000 and 30.0, 0.150 and 1.50, and 0.045 and 1.00 μg mL−1 for chlorogenic, ferulic, vanillic, and caffeic acid, respectively. The detection limit ranged from 0.014 to 0.300 μg mL−1. The practicality of using the proposed method to determine the four target analytes in traditional Chinese medicine was also validated, in which recoveries ranged from 90.9% to 119.8%. Taken together, these results indicate that the developed method is sensitive and reliable. Furthermore, the method was successfully applied to real traditional Chinese medicine samples.
1. Introduction
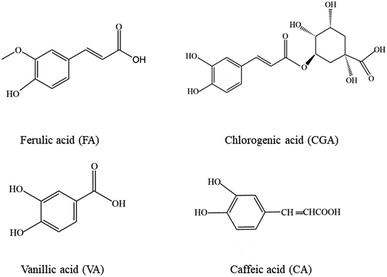
Traditional Chinese medicines (TCMs) have thousands of years of history and are an important resource for the prevention and treatment of various diseases because of their multiple pharmacological effects, and low side effects.1 Phenolic acids like chlorogenic (CGA), ferulic (FA), vanillic (VA), and caffeic (CA) acids are the main bioactive compounds in TCMs (Fig. 1). They are important components in natural drugs and are produced by plants through the shikimic acid pathway of carbohydrates and phenylalanine metabolism.2 They are also involved in various physiological activities, such as scavenging free radicals, inhibiting thrombus formation, and antioxidation, antibacterial, and anti-inflammatory effects. CGA is an effective component of many Chinese medicinal materials, vegetables, and fruits.3,4 In addition to the physiological activities mentioned above, CGA also has antivirus, liver protection, and gallbladder pharmacological effects,5 as well as preventive or therapeutic effects on type II-diabetes mellitus, cardiovascular disease, and diseases related to aging.6,7 CGA is also considered to be a promising lead compound in the fight against HIV.8 It is also suggested that CGA is associated with reduction in body weight.9 For instance, in Norway and the UK, CGA is sold under the trade name “Svetol”, as an additive in foods such as coffee and gum to lose weight. FA can inhibit platelet aggregation, platelet 5-hydroxytryptamine release, and platelet thromboxane A2 (TXA2) production, enhance prostaglandin activity, and relieve vasospasm. FA is used for the treatment of cardiovascular, cerebrovascular, leukopenia, and Alzheimer's diseases.10,11 It is also available as basic raw materials, such as sodium ferulate, Limai capsules, and Taitai oral liquid. VA exhibits multifunctional effects such as anti-angiogenetic, anti-sickling, anti-nociceptive, anti-analgesic, and anti-osteoporotic effects.12,13 CA has the effect of contracting and strengthening the microvessel, promoting the function of coagulation factors, and increasing white blood cells and platelets. Hence, CA can be used for the treatment of leukopenia and thrombopenia.14,15 The four phenolic acids all have the effects of scavenging free radicals, resisting inflammation, resisting virus, regulating immunity, resisting blood coagulation, and anti-tumor activity. These phenolic acids have promising applications in the fields of medicine, health care, chemical industry, and food, and have accordingly received increasing attention.Nonetheless, the existence of some substances with similar molecular structure to the four phenolic acids could make the separation difficult, such as gallic acid, protocatechuic acid, etc. At present, commonly used methods include mainly high-performance liquid chromatography (HPLC),4,16 liquid chromatography-mass spectrometry (LC-MS),17,18 and capillary electrophoresis (CE).19 However, LC-MS is expensive, so its application is limited to a certain extent, especially in developing countries. HPLC is not as cost-prohibitive, although the sample matrix can be complex, with some requiring complex pretreatment or derivatization. Therefore, an inexpensive, reliable, fast, and sensitive method is needed for qualitative and quantitative detection of the four phenolic acids.
CE is one of the fastest-growing analytical methods. A relatively new and extremely powerful technique, CE is driven by high voltage electric fields, and samples are separated by capillaries basing on differences in the mobility and distribution behavior of each component. It offers numerous advantages over conventional chromatographic methods because of its unique separation mechanism, speed, higher efficiency, versatility, environmental friendliness, resources utilization, small sample amount, not requiring further purification, and permitting several kinds of buffers and additives for usage as the electrolyte.20,21 CE has many applications in biochemistry, pharmaceutical science,22 bioscience,23 ion analysis,24 food analysis,25 and environmental science fields.24
Chemiluminescence (CL) analysis is a highly sensitive micro and trace analytical technique developed in recent years. It has become a very active research area in analytical chemistry and is an ideal detection technique for the CE–CL method owing to its simplicity, low cost, high sensitivity and selectivity, and wide linear range, and it has been successfully used for the analysis of amino acids,26 proteins,27 catecholamines,28 carbohydrates,29 metal ions,30 and DNA.31 CL detection instrument equipment is simple—there is no need for an external light source or other influences of scattered light. The photoelectric conversion can be separated and analyzed under the condition of avoiding light, which is beneficial to improve the signal-to-noise ratio of the instrument. It also has the characteristics of high sensitivity and a wide linear range.32,33
To the best of our knowledge, no other publication has addressed the simultaneous determination of the four phenolic acids by CE–CL. Here we describe the new environmental-friendly, sensitive, and fully validated CE–CL method for the determination of four phenolic acids in TCM, providing a valuable reference for monitoring the types and contents of several phenolic acids in Chinese medicinal materials, drug quality control, clinical applications, and follow-up research and development.
2. Materials and methods
2.1 Reagents and materials
CGA, FA, VA, and CA standards were obtained from the China Institute for the control and determination of pharmaceutical and biological products. Luminol was purchased from Fluka Inc. Analytical grade sodium tetraborate (Na2B4O7) and sodium hydroxide (NaOH) were purchased from the Tianjin General Chemical Reagent Factory (Tianjin, China). Methanol and acetic acid were purchased from Sigma-Aldrich (St. Louis, MO, USA). High-voltage power supply was obtained from the Beijing Anhe Photoelectric Instrument Co., Ltd. The photomultiplier was procured from Beijing Binsong Photon Technology Co., Ltd., and fused silica capillaries from the Hebei Yongnian Fiber Factory. The Qianpu chromatographic workstation was from the Shanghai Thousand Qianpu Software Co., Ltd. The Oasis@ HLB cartridges (200 mg/3 mL) were from Waters, and ultrapure water (resistivity ≥ 18 MΩ cm) was supplied by an ultrapure water system from Sichuan ULUPURE® Technology Co., Ltd. Filter tips (0.45 μm) were purchased from Macherey-Nagel (Düren, Germany).2.2 Apparatus
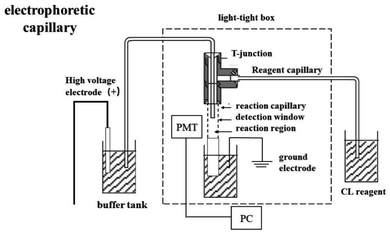
All CE separations were conducted on a self-assembled CE–CL device (Fig. 2). Electrophoresis was performed in fused silica capillaries of 50 μm i.d. and length of 66 cm with one end (about 8 cm) etched for 40 min by hydrofluoric acid and 6.5 cm of the etched section inserted into the reaction tube (530 μm i.d.). The 1 cm section of the capillary in the reaction tube was burned off of the polyimide coating to create the detection window (the end of the electrophoresis separation tube is inserted into it). A reagent introduction tube (200 μm i.d.) was introduced into the oxidation reagent by gravity siphon, and the distance between the reagent pool and buffer tank was 10 cm. Capillaries were fixed with three-way joints. The detection window is located in front of the photomultiplier tube (PMT) after the position of the reaction tube is fixed, and the reaction system and PMT are placed in a sealed dark box.CL reaction reagent, the Ag(III) solution, was stored in a gravity injection device; electrophoresis capillary, a fused silica capillary (66 cm length × 50 μm i.d.); reaction capillary (6.5 cm × 530 μm i.d.); HV, high-voltage power supply (±30 kV); PC, personal computer; PMT, photomultiplier tube.
2.3 Solution preparation
Stock solutions (50.0 mg L−1 for CGA, 50.0 mg L−1 for FA, 10.0 mg L−1 for VA, 10.0 mg L−1 for CA) were prepared and kept at 4 °C.A stock Na2B4O7 solution (50 mM) was prepared and used to obtain relevant running buffer solutions. A stock of 20 mM luminol solution was prepared by dissolving 0.3544 g in 2.8 mL of 1.0 M sodium hydroxide solution, then dissolved to 100 mL with water and transferred to a brown reagent bottle to avoid light exposure.
Preparation for stock solution of Ag(III) involved adding 1.36 g of AgNO3, 5.8 g of KIO4, 3 g of K2S2O8, and 8.0 g of KOH into a beaker and dissolving them in 200 mL of water, then heating to about 22 °C for 8 min. The solution was maintained at this temperature for half an hour, concentrated to about 100 mL, and then transferred to the brown capacity bottle. The solution was scanned with a spectrophotometer at 362 nm to obtain a spectrophotometer value: the calculated concentration was 1.46 × 10⁻² M according to the formula: A = C × L × ε, ε = 1.26 × 10⁻⁴ M−1 cm−1. The solution was stored at 4 °C and diluted with water to the desired concentration prior to use.
2.4 CE–CL conditions
In the CE–CL system, 3.0 mM of luminol, 3.0 × 10⁻⁵ M of Ag(III) solution in 10 mM of NaOH aqueous solution, and 10 mM of Na2B4O7 were employed as the running buffer in the electrophoresis capillary. Separations were carried out at 22 kV electrophoretic voltage. The new capillary was conditioned by flushing for 30–60 min with 1.0 M NaOH, followed by water for 20–30 min. Between two consecutive analyses, the capillary was flushed sequentially with 0.1 M NaOH for 10–15 min, distilled water for 10–15 min, luminol solution for 30 min, and finally with a running buffer for 20–40 min prior to use. All buffers and sample solutions were filtered through a 0.45 μm membrane filter prior to analyses.2.5 Sample preparation
Taraxacum mongolicum granules (Kunming Traditional Chinese Medicine Factory Co. Ltd., production lot number: 130424) and Lycium chinense Miller (Ningxia, China) were first ground into powder, of which 0.1 g was dissolved in 2 mL of 70% methanol to obtain a sample solution. The sample solution was extracted by ultrasonic for 10 min and centrifuged 10 min at 4000 rpm prior to the supernatant collection. Next, 2 mL of acetic acid (pH = 2.76) was added to obtain the SPE loading sample. Shuanghuanglian oral liquid: for SPE directly. The SPE and sample pretreatment procedure was shown in Table 1.| Step | ||
|---|---|---|
| 1 | Conditioning | 3.0 mL MeOH and then 3.0 mL H2O |
| 2 | Loading | 4.0 mL sample |
| 3 | Washing | 3.0 mL H2O |
| 4 | Elution | 2 mL mixture of MeOH/acetic acid (9![[thin space (1/6-em)]](https://www.rsc.org/images/entities/char_2009.gif) : :![[thin space (1/6-em)]](https://www.rsc.org/images/entities/char_2009.gif) 1, v/v) 1, v/v) |
| 5 | Evaporation to dryness with N2 (30 °C) | |
| 6 | Reconstitution with 500 μL of H2O | |
| 7 | Filtration with 0.45 μm filter membrane. CE–CL measurement | |
2.6 Method validation
![[thin space (1/6-em)]](https://www.rsc.org/images/entities/char_2009.gif) :
:![[thin space (1/6-em)]](https://www.rsc.org/images/entities/char_2009.gif) 1 and 10
1 and 10![[thin space (1/6-em)]](https://www.rsc.org/images/entities/char_2009.gif) :
:![[thin space (1/6-em)]](https://www.rsc.org/images/entities/char_2009.gif) 1, respectively.
1, respectively.3. Results and discussion
3.1 Optimization of the CE–CL method
The pH value is a significant factor affecting CL intensity. The pH of the electrophoretic medium should be matched to the pH of the reaction zone. However, the volume of the sample zone from the 50 μm inner diameter separation capillary is much lower than the volume of the reagent zone from the 200 μm inner diameter reagent capillary. Therefore, the pH of the CL reaction is primarily dependent on the pH of the Ag(III) complex solution. The effect of the pH of the Ag(III) complex solution on the CL intensity in the CE–CL system was studied by varying the NaOH concentration(Fig. 3A). The results indicated that the signal increased at first, and then weakened with increasing Ag(III) pH. The best signal was acquired when the NaOH concentration was 10 mM. Thus, 10.0 mM of NaOH was selected and the pH of the Ag(III) complex solution is pH 12.0 (Fig. 3A).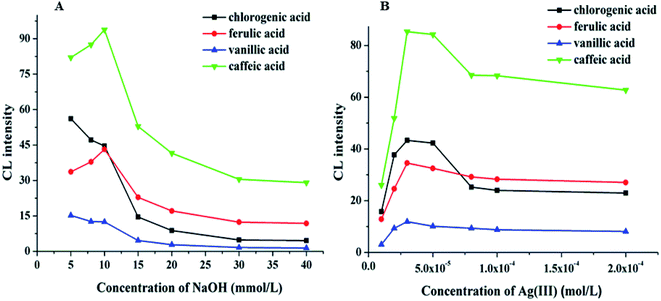 | ||
| Fig. 3 (A) Effect of NaOH concentration (A) on CL intensity. (B) Effect of Ag(III) concentration on CL intensity. | ||
Based on the above results, keeping the pH of Ag(III) solution at 12.0, the effects of Ag(III) solution concentration in the range of 1.0 × 10⁻⁵–2.0 × 10⁻⁴ M on CL intensity were investigated. The results show that the signal increased with the increasing Ag concentration (Fig. 3B). When the concentration of Ag(III) solution was 3.0 × 10⁻⁵ M, the CL intensity reached its highest value and the signal was stable. However, when the concentration of Ag(III) solution continued to increase, the intensity decreased, which may be due to the partial absorption of luminous signal by the highly concentrated solution. Therefore, considering all of these factors, a suitable concentration of Ag(III) solution was determined as 3.0 × 10⁻⁵ M.
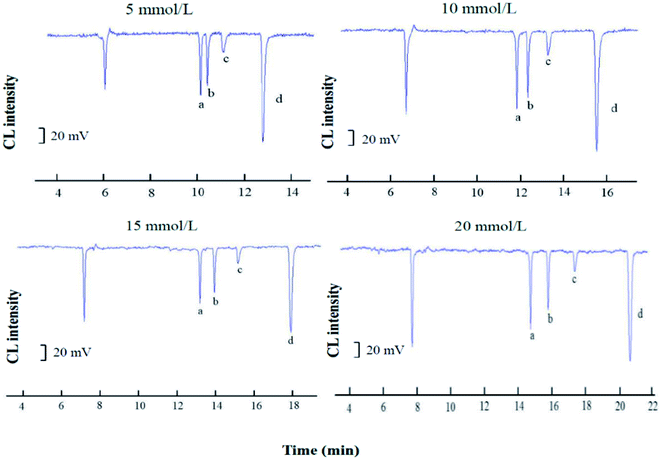
The electropherograms of the four analytes in the employment of 5.0 mM luminol solution, 20.0 mM Na2B4O7 buffer, and 5.0 mM (III) at different pH values adjusted by different NaOH concentration, utilizing 16 kV of applied voltage and 10 s of injection time ((a) chlorogenic acid; (b) ferulic acid; (c) vanillic acid; (d) caffeic acid).
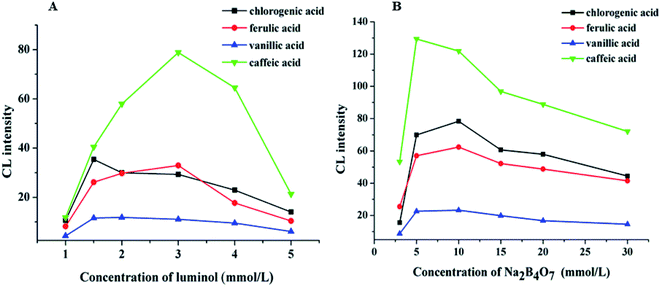
The effects of different luminol concentrations of 1.0, 1.5, 2.0, 3.0, 4.0, and 5.0 mM on CL intensity were investigated, and the results are shown in Fig. 4A. We can observe that when the concentration of luminol was 3.0 mM, the CL intensity reached its maximum, and the signal was stable. Therefore, 3.0 mM of luminol solution was selected.
Sodium tetraborate buffer was used as the running buffer in this study. Standards of CGA, FA, VA, and CA were baseline separated when the buffer concentration was increased from 3.0 to 30.0 mM. These results demonstrated that the buffer concentration affected both the CL signal and the capillary separation efficiency. Furthermore, the CL signals of the four phenolic acids during the electrophoresis were clearly affected by the increased buffer concentration (Fig. 4B). The signal intensity was inversely proportional to the buffer concentration. A 10.0 mM sodium borate buffer containing luminol was used to balance the separation efficiency with a sufficiently high buffer capacity (Fig. 5).
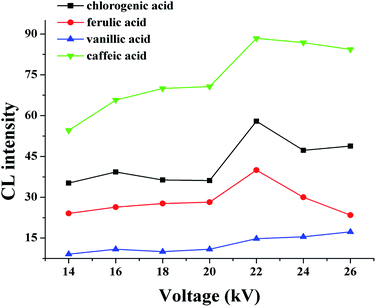
The separation voltage is the power of separation; it can not only affect the migration speed and separation effect but also affect the CL signal. In general, the speed of electrophoresis, the electroosmotic increase, and the sample analysis time are shortened as the separation voltage increases. However, the Joule heat from the capillary will increase if the voltage is too high, which leads to reduced baseline stability and sensitivity, a widening spectral band, and reduced separation efficiency. Therefore, the effect of applied voltage on the electrophoretic separation was investigated with the optimized buffer conditions. In the range of 14–26 kV, at higher voltages the migration times shorten, and the peak height descends, while the background noise was enhanced. An applied voltage of 22 kV provided good separation of the four substances (Fig. 6).
The effect of injection time on the CL intensity was also investigated. The results show that when the injection time was 12 s, the CL intensity was the highest, the peak shape was sharp, and a reasonable and complete separation was obtained; hence, the optimum injection time was 12 s.
3.2 Optimization of SPE conditions
Sample extraction is important when analyzing any component in complex matrices. The appropriate method should efficiently remove interfering compounds while providing a high recovery of extraction. The SPE method is successful at extracting different types of compounds from different complex matrices samples and purifying the extracted analytes. In this study, C18 and HLB cartridges were tested preliminarily, and the HLB cartridge was ultimately selected for its reasonable separation and good overall recoveries on the four analytes.Several wash and elution protocols modified from the generic method were conducted. We tried several different combinations as washing solutions, including 100% methanol, methanol–water solutions in different proportions, and water, all in the volume of 3 mL. In the elution, we tried 100% methanol as well as methanol–acetic acid solutions in different proportions, in the volume of 2 mL. The results show that when 3 mL of water and 2 mL of methanol–acetic acid (9![[thin space (1/6-em)]](https://www.rsc.org/images/entities/char_2009.gif) :
:![[thin space (1/6-em)]](https://www.rsc.org/images/entities/char_2009.gif) 1, v/v) were used for washing and elution, respectively, good recoveries and separation were obtained (Table 1).
1, v/v) were used for washing and elution, respectively, good recoveries and separation were obtained (Table 1).
3.3 Method validation
The calibration curve is given in the range of 0.625–20.0 μg mL−1, 1.0–30.0 μg mL−1, 0.15–1.5 μg mL−1, and 0.045–1.0 μg mL−1 for CGA, FA, VA, and CA respectively, and the calibration equations are linear on the basis of inter-day results, with good correlation coefficients (Table 2). The LODs were 0.19 μg mL−1, 0.3 μg mL−1, 0.045 μg mL−1, and 0.014 μg mL−1 for CGA, FA, VA, and CA, respectively. LOQs were 0.625 μg mL−1, 1.0 μg mL−1, 0.15 μg mL−1, and 0.045 μg mL−1 for CGA, FA, VA, and CA, respectively.| Compound | Calibration curvea | r | Linear range (μg mL−1) | LOD (μg mL−1) |
|---|---|---|---|---|
| a C refers to the concentration of analytes (μg mL−1), and I indicates the relative CL intensity of negative peaks. | ||||
| Chlorogenic acid | I = 3.959C + 10.967 | 0.9959 | 0.625–20.0 | 0.019 |
| Ferulic acid | I = 2.633C + 6.279 | 0.9966 | 1.000–30.0 | 0.300 |
| Vanillic acid | I = 20.173C + 4.115 | 0.9963 | 0.150–1.50 | 0.045 |
| Caffeic acid | I = 125.790C + 7.383 | 0.9966 | 0.045–1.00 | 0.014 |
The experimental values obtained from precision examination of the four analytes are presented in Table 3. The RSD values show that the method is precise and acceptable from an analytical point of view.
| Compound | Original (μg mL−1) | Added (μg mL−1) | Measured (μg mL−1) | Recovery % (RSD%) | Precision, intra-day (RSD%) | Precision, inter-day (RSD%) |
|---|---|---|---|---|---|---|
| Chlorogenic acid | 5.18 | 2.50 | 2.37 | 114.5 (0.13) | 0.11 | 0.06 |
| 5.00 | 7.10 | 110.0 (0.09) | ||||
| 7.50 | 14.60 | 103.2 (0.04) | ||||
| Ferulic acid | 3.20 | 1.50 | 2.01 | 101.7 (0.12) | 0.17 | 0.13 |
| 3.00 | 16.48 | 104.1 (0.03) | ||||
| 6.00 | 21.10 | 90.9 (0.02) | ||||
| Vanillic acid | 0 | 0.15 | 0.26 | 110.0 (0.21) | 0.07 | 0.06 |
| 0.35 | 0.82 | 92.4 (0.06) | ||||
| 0.60 | 1.49 | 100.6 (0.04) | ||||
| Caffeic acid | 0.22 | 0.05 | 0.094 | 119.8 (0.20) | 0.1 | 0.05 |
| 0.10 | 25.20 | 110.0 (0.19) | ||||
| 0.40 | 68.45 | 103.8 (0.14) |
The accuracy of the method was examined by the standard addition method as stated in Section 2.6.3. The results are presented in Table 3. The calculated recoveries ranged from 90.9% to 119.8%, demonstrating that the proposed method has excellent accuracy. The recovery ranges agree with accepted criteria, which is in the range of 80–120%.
3.4 Application of the method to the analysis of real samples
The method developed was applied to the analysis of real samples: Taraxacum mongolicum granules, Lycium chinense Miller, and Shuanghuanglian oral liquid. Without using a HLB SPE column, the direct analysis of the spiked TCM samples showed a clutter of peaks due to the complex matrix and existence of many interfering substances. By contrast, distinct peaks were observed when the spiked samples were extracted through SPE. We identified four peaks corresponding to the four analytes by comparing the migration time obtained from the SPE extraction in the real sample with that obtained from an aqueous solution sample (Fig. 7). The four peaks of analytes were well separated with little interference, suggesting that the SPE method can substantially reduce the matrix effect of real samples. The established analytical method was applied to detect four compounds in traditional and proprietary Chinese medicine. The detected content of the analytes ranged from 1.8 to 13.9 μg g−1 in Lycium chinense Miller, which was lower than that of Taraxacum mongolicum granules, ranging from 4.5 to 51.8 μg g−1, and that of Shuanghuanglian oral liquid, ranging from 3.4 to 31.7 μg mL−1. It should be noted that this is not absolute, for the content varied in each variety of Lycium chinense Miller that was harvested in different months.34 The analytical results are summarized in Table 4, which approach values reported in previous studies,34,35 and have reference value for the quantitative analysis of the four phenols acids.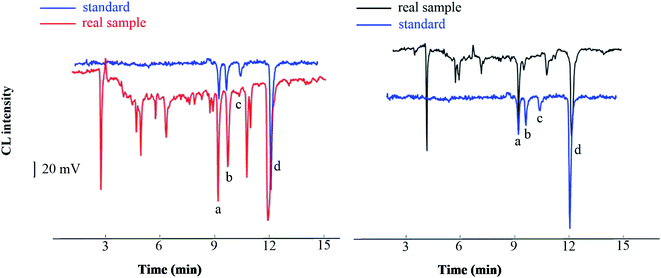 | ||
| Fig. 7 Chromatograms of standard and real sample ((a), chlorogenic acid; (b) ferulic acid; (c) vanillic acid; (d) caffeic acid). | ||
| Sample | Analytes | |||
|---|---|---|---|---|
| CGA | FA | VA | CA | |
| a —: not detected. | ||||
| Taraxacum mongolicum granules (μg g−1) | 51.8 | 32.0 | — | 4.5 |
| Shuanghuanglian oral liquid (μg mL−1) | 31.7 | — | — | 3.4 |
| Lycium chinense Miller (μg g−1) | — | 13.9 | — | 1.8 |
4. Conclusion
An efficient, reliable, and environmentally friendly new CE–CL method for the determination of chlorogenic, ferulic, vanillic, and caffeic acids in TCM was established and validated in this study. To the best of our knowledge, this is the first CE–CL method for simultaneously determining CGA, FA, VA, and CA in TCM. The SPE method developed in this study was relatively simple for sample preparation, and it was highly efficient for cleaning up samples and repeatable. Recoveries at relevant spiking levels were obtained and sufficient sensitivity was observed. The proposed method can thus be successfully applied to the analysis of CGA, FA, VA, and CA in TCM.Author contributions
Shuopeng Yang: conceptualization, visualization, writing-original draft. Yanzhen Han: methodology, validation. Kairui Wang: investigation, data curation. Yu Wang: software, validation. Liping Li: visualization, investigation. Nan Li: data curation, investigation. Xiangdong Xu: methodology, funding acquisition, project administration, supervision, writing – review & editing.Conflicts of interest
There are no conflicts to declare.Acknowledgements
This work was financially supported by the Natural Science Foundation of China (No. 81402723, 81773481) and Key Research and Development Project of Hebei Province (No. 21377727D, 19977719D).References
- P. LI, H. Hao and G. Lin, J. Chromatogr. B: Anal. Technol. Biomed. Life Sci., 2016, 1026, 1 CrossRef PubMed.
- P. Kaushik, I. Andujar, S. Vilanova, M. Plazas, P. Gramazio, F. J. Herraiz, N. S. Brar and J. Prohens, Molecules, 2015, 20, 18464–18481 CrossRef CAS PubMed.
- H. Zhang, Z. Y. Wu, Y. H. Wang, F. Q. Yang and D. Q. Li, Food Chem., 2020, 310, 125823–125830 CrossRef CAS PubMed.
- K. Robards, J. Chromatogr., 2003, 1000, 657–691 CrossRef CAS PubMed.
- M. Naveed, V. Hejazi, M. Abbas, A. A. Kamboh, G. J. Khan, M. Shumzaid, F. Ahmad, D. Babazadeh, F. F. Xia, F. Modarresi-Ghazani, W. H. Li and X. H. Zhou, Biomed. Pharmacother., 2018, 97, 67–74 CrossRef CAS PubMed.
- S. A. A. Jassim and M. A. Naji, J. Appl. Microbiol., 2003, 95, 412–427 CrossRef CAS PubMed.
- K. L. Johnston, M. N. Clifford and L. M. Morgan, Am. J. Clin. Nutr., 2003, 78, 728–733 CrossRef CAS PubMed.
- M. T. H. Khan, A. Ather, K. D. Thompson and R. Gambari, Antiviral Res., 2005, 67, 169 CrossRef CAS.
- A. S. Cho, S. M. Jeon, M. J. Kim, J. Yeo, K. I. Seo, M. S. Choi and M. K. Lee, Food Chem. Toxicol., 2010, 48, 937–943 CrossRef CAS PubMed.
- C. Mancuso and R. Santangelo, Food Chem. Toxicol., 2014, 65, 185–195 CrossRef CAS PubMed.
- D. A. Butterfield, T. Reed, S. F. Newman and R. Sultana, Free Radical Biol. Med., 2007, 43, 658–677 CrossRef CAS PubMed.
- M. L. Yrbas, F. Morucci, R. Alonso and S. Gorzalczany, Pharmacol., Biochem. Behav., 2015, 132, 88–95 CrossRef CAS PubMed.
- T. Tanaka, H. Onuma, T. Shigihara, E. Kimura, Y. Fukuta, N. Shirasaka, T. Moriyama and Y. Homma, J. Biosci. Bioeng., 2019, 128, 622–629 CrossRef CAS PubMed.
- J. R. Colina, M. Suwalsky, M. Manrique-Moreno, K. Petit, L. F. Aguilar, M. Jemiola-Rzeminska and K. Strzalka, Arch. Biochem. Biophys., 2019, 662, 75–82 CrossRef CAS PubMed.
- R. Shiozawa, Y. Inoue, I. Murata and I. Kanamoto, Asian J. Pharm. Sci., 2018, 13, 24–33 CrossRef PubMed.
- Z. B. Wang, R. Sun, Y. P. Wang, N. Li, L. Lei, X. Yang, A. M. Yu, F. P. Qiu and H. Q. Zhang, J. Chromatogr. B: Anal. Technol. Biomed. Life Sci., 2014, 969, 205–212 CrossRef CAS PubMed.
- L. Q. Zhang, Y. Li, Y. Liang, K. H. Liang, F. Zhang, T. Xu, M. M. Wang, H. X. Song, X. J. Liu and B. Y. Lu, Food Chem., 2019, 276, 538–546 CrossRef CAS PubMed.
- J. X. Xia, B. B. Zhao, J. F. Zan, P. Wang and L. L. Chen, J. Pharm. Biomed. Anal., 2019, 175, 112734–112741 CrossRef CAS PubMed.
- H. Mao, Y. Zhang and G. Chen, Anal. Methods, 2019, 11, 303–308 RSC.
- P. Schmitt-Kopplin, Methods Mol. Biol., 2008, 384, vii–ix Search PubMed.
- H. Shintani and J. Polonský, Handbook of Capillary Electrophoresis Applications, Netherlands, 1997 Search PubMed.
- T. Guray, T. Turan, M. Tuncel and U. D. Uysal, J. AOAC Int., 2017, 100, 206–211 CrossRef CAS PubMed.
- M. Vlckova, A. R. Stettler and M. A. Schwarz, J. Liq. Chromatogr. Relat. Technol., 2006, 29, 1047–1076 CrossRef CAS.
- S. X. Yang, S. Y. Ma, K. L. Zhu, M. L. Wang, J. H. Li, M. Arabi, H. T. Liu, Y. Li and L. X. Chen, J. Food Compos. Anal., 2020, 103462–103470 CrossRef CAS.
- G. D'Orazio, M. Asensio-Ramos, C. Fanali, J. Hernandez-Borges and S. Fanali, TrAC, Trends Anal. Chem., 2016, 82, 250–267 CrossRef.
- D. Miloš, R. Lenka and K. Pavel, Anal. Chem., 2020, 92, 1557–1564 CrossRef PubMed.
- J. Jiang, S. L. Zhao, Y. Huang, G. X. Qin and F. G. Ye, J. Chromatogr. A, 2013, 1282, 161–166 CrossRef CAS PubMed.
- X. D. Xu, H. Y. Zhang, H. M. Shi, C. L. Ma, B. Cong and W. J. Kang, Anal. Biochem., 2012, 427, 10–17 CrossRef CAS PubMed.
- J. K. Zhu, L. Shu, M. Wu, Z. F. Wang, Q. J. Wang, P. G. He and Y. Z. Fang, Talanta, 2012, 93, 428–432 CrossRef CAS PubMed.
- J. H. Li, J. Y. Liu, W. H. Lu, F. F. Gao, L. Y. Wang, J. P. Ma, H. T. Liu, C. Y. Liao and L. X. Chen, Electrophoresis, 2018, 39, 1763–1770 CrossRef CAS PubMed.
- Y. M. Liu, L. Mei, L. J. Liu, L. F. Peng, Y. H. Chen and S. W. Rei, Anal. Chem., 2011, 83, 1137–1143 CrossRef CAS PubMed.
- S. Das, A. M. Powe, G. A. Baker, B. Valle, B. El-Zahab, H. O. Sintim, M. Lowry, S. O. Fakayode, M. E. McCarroll, G. Patonay, M. Li, R. M. Strongin, M. L. Geng and I. M. Warner, Anal. Chem., 2012, 84, 597–625 CrossRef CAS PubMed.
- M. L. Liu, Z. Lin and J. M. Lin, Anal. Chim. Acta, 2010, 670, 1–10 CrossRef CAS PubMed.
- S. C. Liu, J. T. Lin, C. C. Hu, B. Y. Shen, T. Y. Chen, Y. L. Chang, C. H. Shih and D. J. Yang, Food Chem., 2017, 215, 284–291 CrossRef CAS PubMed.
- X. P. Li, H. Yu, J. Y. Luo, H. S. Li, F. H. Han, X. G. Chen and Z. D. Hu, Chem. Pharm. Bull., 2004, 52, 1251–1254 CrossRef CAS PubMed.
| This journal is © The Royal Society of Chemistry 2021 |

