 Open Access Article
Creative Commons Attribution 3.0 Unported Licence
Fabrication of BP2T functionalized graphene via non-covalent π–π stacking interactions for enhanced ammonia detection†
Hu Li‡
 *ab,
Tianbo Duan‡
 b,
Omer Sherb,
Yuanyuan Hanb,
Raffaello Papadakis
 c,
Anton Grigorievd,
Rajeev Ahuja
 d and
Klaus Leifer
 *b
*b
aShandong Technology Centre of Nanodevices and Integration, School of Microelectronics, Shandong University, 250101 Jinan, China. E-mail: Hu.Li@sdu.edu.cn
bDepartment of Materials Science and Engineering-Ångström, Uppsala University, 75121 Uppsala, Sweden. E-mail: Klaus.Leifer@angstrom.uu.se
cTdB Labs, 75121 Uppsala, Sweden
dDepartment of Physics and Astronomy-Ångström, Uppsala University, 75120 Uppsala, Sweden
First published on 8th November 2021
Abstract
Graphene has stimulated great enthusiasm in a variety of fields, while its chemically inert surface still remains challenging for functionalization towards various applications. Herein, we report an approach to fabricate non-covalently functionalized graphene by employing π–π stacking interactions, which has potentialities for enhanced ammonia detection. 5,5′-Di(4-biphenylyl)-2,2′-bithiophene (BP2T) molecules are used in our work for the non-covalent functionalization through strong π–π interactions of aromatic structures with graphene, and systematic investigations by employing various spectroscopic and microscopic characterization methods confirm the successful non-covalent attachment of the BP2T on the top of graphene. From our gas sensing experiments, the BP2T functionalized graphene is promising for ammonia sensing with a 3-fold higher sensitivity comparing to that of the pristine graphene, which is mainly attributed to the enhanced binding energy between the ammonia and BP2T molecules derived by employing the Langmuir isotherm model. This work provides essential evidence of the π–π stacking interactions between graphene and aromatic molecules, and the reported approach also has the potential to be widely employed in a variety of graphene functionalizations for chemical detection.
Introduction
Graphene with its single-atom-thick two-dimensional (2D) conjugated structure has been extensively explored as an ideal material for chemical detection owing to its exceptional properties, e.g. superior electrical properties, ultra-large specific area, high mechanical sturdiness and good chemical stability.1–6 The high conductivity ensures graphene exhibits very little signal disturbance when working as a sensor, while the high chemical stability and strong mechanical performances ensure a long lifetime of such sensors.7 The intrinsic 2D structure gives graphene large specific surface areas that ensure a high sensitivity down to the level of even single molecule detection.8 All of these superior properties hold great promise for graphene to perform as a gas absorption material for sensors. Despite the great potentialities, the inert surface of the graphene results in numerous challenges for selective detection of various gases.9–11 To address this concern, various functionalization approaches have been exploited to conjugate selective ligands on its surface, including both covalent and non-covalent modifications.12Non-covalent functionalization approach based on π–π stacking interactions shows unique advantages since it does not necessitate chemical modifications and thus can maintain the unique physical and structural properties of graphene.13 Aromatic molecules have been demonstrated useful for non-covalent functionalization by π–π stacking interactions.14,15 Owing to the aromatic structure, the molecules can strongly absorb onto the graphene surface, while at the same time, the functional groups of the aromatic molecules can be exposed and employed to recognize the target molecules directly.16 Therefore, the aromatic molecule based non-covalent functionalization of graphene is promising to be widely employed to achieve the surface modification of graphene towards chemical detections.
Ammonia (NH3) is a typical hazardous and irritant gas which can induces toxicity to the environment and sensitive ecosystems, therefore, a range of techniques have been employed to achieve the sensitive detection of NH3, including nanowires,17,18 metal oxide,19 reduced graphene oxide,20 laser-coupled spectroscopy,21 etc. Despite the great potentialities as an ideal candidate for solid state gas sensors, graphene based ammonia sensors are still struggling as the sensor response is relatively much lower (typically less than 5%) as compared to other gas species sensed with pristine graphene. Even if the fact that many methods such as doping,22 defect insertion23,24 and chemical functionalization,25 have been applied, it is still a challenge to improve the sensitivity of graphene-based gas sensors to NH3.
In this work, we reported a systematical investigation of the graphene surface functionalized by employing π–π non-covalent stacking mechanism and also demonstrated its potential application in NH3 detection. Here, 5,5′-di(4-biphenylyl)-2,2′-bithiophene (BP2T) molecules are used for the non-covalent functionalization via strong π–π interactions between the aromatic structures of BP2T and graphene. Systematic analysis by utilizing different spectroscopic and microscopic characterizations was performed and the result confirms the successful non-covalent functionalization of the BP2T molecules on graphene surface. Moreover, our gas sensing experiments show that the BP2T molecule functionalized graphene demonstrates a 3-fold higher sensitivity for NH3 comparing to that of the pristine graphene, which opens up possibilities for graphene functionalization towards various chemical detections.
Results and discussions
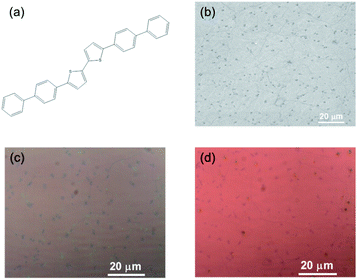
Fig. 1(a) shows the chemical structure of the BP2T molecule, in which the bithiophene group lies in the center of the molecule. Here, chemical vapor deposited (CVD) monolayer graphene is utilized as the starting material and the scanning electron microscopy image is shown in Fig. 1(b). The BP2T functionalized graphene is prepared by immersing graphene into the BP2T/toluene solution, and the core idea of this non-covalent functionalization is to achieve a strong binding between graphene and BP2T molecules through π–π stacking interactions of the aromatic rings. From a comparison of the optical images (Fig. 2(c) and (d)), it is found that before and after the immersing, there is a clear color change of graphene, and such microscopic modifications on the graphene surface can be attributed to the attachment of the BP2T molecules, which leads to the variations in the light reflection.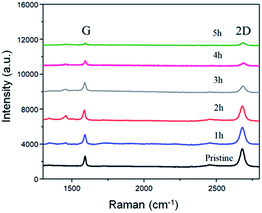 | ||
| Fig. 2 Raman comparison of the BP2T non-covalently functionalized graphene with immerging time varying from 1 h to 5 h. | ||
To better understand the structure evolution of the surface after modifications, graphene with various non-covalent BP2T functionalization time ranging from 1 h to 5 h were prepared and investigated. Fig. 2 shows the Raman spectra evolution of graphene samples as a function of time. It can be seen that the starting pristine graphene shows a monolayer feature that is evidenced from the intensity ratio of 2D peak (at 2680 cm−1) and G peak (at 1580 cm−1) (I2D/IG) of more than 3, while the negligible D peak (at 1350 cm−1) indicates the good quality of the graphene with a very low level of defects. With the increase of the non-covalent functionalization time, both I2D and IG are decreased. More specifically, in the samples of immersing time of 1 h and 2 h, graphene still maintains a monolayer feature of graphene where the intensity ratio of I2D/IG is more than 3. Nevertheless, when the immersing time is longer than 2 h, the intensity ratio of I2D/IG tends to be 1, implying the tendency of the structure evolution towards forming a bilayer graphene.26–29 As for the D peak, it can be seen that all of the samples after non-covalent functionalization maintains a low intensity D peak, indicating a low defect level of the graphene, which is quite different comparing to covalent graphene functionalizations.5,30,31
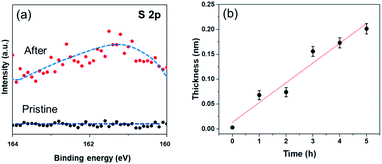
In order to investigate the formation of BP2T molecule layer on graphene surface through non-covalent π–π interactions, X-ray photoelectron spectroscopy (XPS) measurements were performed as shown in Fig. 3(a). The XPS S 2p peak comparison between the pristine and non-covalently BP2T functionalized graphene by XPS spectroscopy confirms the successful attachment of the BP2T molecules. More specifically, in pristine graphene, there is no S peak observed in the spectrum, while a prominent S peak appears after the functionalization, and this can be well attributed to the attachment of BP2T molecules containing S atoms. The film thickness measurement based on XPS was also carried out on the graphene samples with various immersing time. Because in the XPS measurements, the C signals originate from both the BP2T and graphene layer, while the O signals only comes from the SiO2 substrate, it is realistic to measure the film thickness of graphene T (T = Tgraphene + TBP2T layer). According to the work of Cumpson and co-workers,32,33 the graphene thickness T on top of SiO2 substrate can be expressed as:
 | (1) |
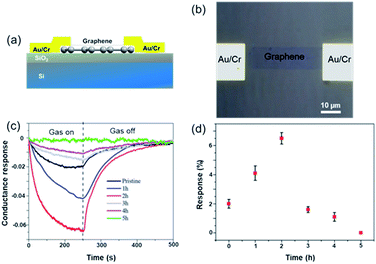
To facilitate the electrical analysis and gas sensing experiments, a pristine monolayer graphene is fabricated into a gas sensor and graphene is electrically contacted by Au (60 nm)/Cr (5 nm) as illustrated in Fig. 4(a). The light optical image of the fabricated graphene device with electrical contacts is shown in Fig. 4(b), and the key part of the senor is the central graphene channel with the dimension of 40 μm × 10 μm. The NH3 gas sensing measurements were performed in a gas sensing probe station under ambient pressure, and the current–time (I–t) characteristics of the gas sensors are recorded. To ensure reliable sensing results, the gas sensing chamber is purged by using dry N2 for more than 1 h prior to introducing the target gas in all measurements. The gas flow of 100 standard cubic centimeter per minute (sccm) is used in the experiment, which is controlled by a mass flow controller. Here, the conductance response S of the gas sensor can be defined as the normalized conductance change response as:
 | (2) |
Theoretical studies have predicted that graphene functionalization can result in an enhanced binding energy between graphene and target molecules, leading to a considerably increased sensitivity in gas sensing,35,36 and thus thiophene groups have a great potential for the detection of NH3 molecules.37 To further understand the gas sensing behavior of the non-covalently functionalized graphene, the Langmuir isotherm model is applied to estimate the binding energy between the NH3 molecules and functionalized graphene. In the Langmuir isotherm, the gas sensing response S is proportional to the gas coverage, therefore the sensitivity of the gas sensor can be written as:38
 | (3) |
 | (4) |
 | (5) |
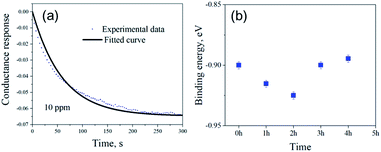
Fig. 5(a) shows the exponential fit of the adsorption curve of the 2 h sample, and the corresponding Ka can be precisely derived. Based on the equations above, it is possible to extract the binding energies of ammonia to graphene samples with different treatment time, by fitting the obtained electrical gas response curves for various samples, and the obtained binding energy as a function of immersion time is shown in Fig. 5(b). It can be seen from the comparison that the binding energy has a close relation with the gas response of the graphene. The samples functionalized for 1 h and 2 h have the strongest binding energy between the graphene and NH3, while sample treated with 3 h and 4 h have a lower binding energy comparing to pristine graphene and correspond well with the decreased sensitivity observed in the electrical gas sensing experiments. As for the sample after 5 h treatment, no data is derived because due to the complete loss of sensitivity.
To further exploit the sensing mechanism of the non-covalent BP2T functionalized graphene to NH3 molecules, DFT calculations have been performed in this work (Fig. 6(a)). It is found from our calculation that the absorption energy of the NH3 molecule and bare graphene surface is 0.11 eV, which is quite low. After treatment, the absorption energy of the NH3 molecule and the non-covalent BP2T functionalized graphene has a significant increase to 0.45 eV. Theoretical studies have predicted that the enhanced sensitivity of graphene gas sensing is mainly attributed to the increased absorption energy of graphene after functionalization with target gas molecules. Therefore, from our calculations, the significant increased absorption energy explains well our experimental observations of the superior NH3 gas sensing performance of graphene. Bases on the absorption energy result from DFT, in principle, more attachments of BP2T molecules on graphene can result in more enhancements in the gas sensing responses. But it seems contradictory with our experimental data that an intermediate immersion time of 2 h shows the maximum electrical response.
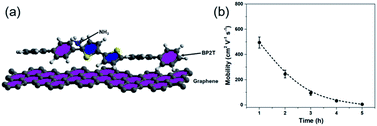 | ||
| Fig. 6 (a) DFT calculation model that is used for the calculation of the absorption. (b) Plot of the measured charrier mobility as a function of immersion time. | ||
To better understand this contradiction, we have carried out more electrical characterizations to understand the influence of BP2T attachment on the electrical properties of graphene and the obtained plot of carrier mobility as a function of immersion time is shown in the Fig. 6(b). It can be seen that, with the increase in the immersion time, the carrier mobility of graphene gradually decreases, which is mainly attributed to the electron scattering effect of attached BP2T molecules. This result indicates that, the physisorption of BP2T molecules gradually deteriorate the electrical performance of graphene, which means more electrical disturbances/noises will be introduced into the sensing systems, leading to the decreased electrical response in the gas sensing experiment. As for the sample with immersion time of 5 h, the carrier mobility is close to zero, indicating that the graphene has nearly lost its conductivity due to the strong electron scattering from BP2T molecules, and it agrees well with our experimental observation that the sample with immersion time of 5 h shows no nearly electrical response in the gas sensing experiments. Therefore, only from the perspective of introducing disturbances/noises, it can be concluded that, with the increase in the immersion time, the more attachments of BP2T molecules on graphene can result in the deterioration in the gas sensing responses.
Based on the discussion above, it can be deduced that when the intermediate immersion is short, the enhanced absorption energy between the ammonia and BP2T molecules plays the key role, leading to an increased gas response, while the deterioration effect is not so obvious. But when the immersion time is long, the deterioration of the electrical performance due to the attachments of BP2T molecules on graphene plays the dominating effect, resulting in a lowered gas response. So a combination of these two factors leads to an intermediate immersion time of 2 h having the highest electrical response in the gas sensing. Moreover, the binding energy is extracted from the measured electrical response of the gas sensing experiments by employing the Langmuir isotherm model, so it is a reflection of the electrical response and also a combination of the influence of the absorption energy and electrical performance due to the BP2T attachment on graphene.
Conclusions
Herein, we have reported an approach to obtain functionalized graphene by employing non covalent stacking interactions. BP2T molecules are employed for the non-covalent functionalization and the obtained graphene shows superior ammonia sensing capacities with the sensitivity 3 times higher comparing to that of the pristine graphene, and such gas sensing result corresponds well with our derived binding energies through Langmuir isotherm model. Therefore, our work provides direct evidence of the interactions between the gas species and graphene functional groups, and the non-covalent approach can also be employed in a variety of gas detection applications.Materials and methods
Materials and fabrication
Large-scale monolayer graphene (Graphenea) was synthesized by using chemical vapor deposited (CVD) approach on a copper foil39 at a temperatures of 1000 °C with a mixture of methane and hydrogen. The obtained graphene then will be mechanically transferred on SiO2 (300 nm)/Si wafer by employing a polymer-assisted method.40 The graphene was patterned and electrically contacted (evaporated 5 nm Cr as an adhesion layer along with a 60 nm Au) by using standard electron beam lithography (EBL) in a Nanobeam nB Series EBL system, oxygen plasma etching in an Advanced Vacuum Vision 320 Reactive Ion Etching (RIE), and physical vapor deposition (PVD) in a Lesker PVD 75 system. To prepare the molecule solution for the non-covalent functionalization, 10 mg BP2T molecules (Sigma-Aldrich) were dissolved in 10 ml of toluene. The non-covalently BP2T functionalized graphene sensors for NH3 detection were prepared by immersing the monolayer CVD graphene devices in the BP2T/toluene solutions for 1 h, 2 h, 3 h, 4 h and 5 h, respectively, then being washed with the toluene and followed by a blow drying.Characterizations
Scanning electron microscopy (SEM) and light optical microscopy (LOM) images were recorded in a Zeiss 1550 SEM and an Olympus AX70 research microscope, respectively. Raman spectroscopy was carried out in a Renishaw inVia Raman spectroscopy with a 532 nm excitation laser. X-ray photoelectron spectroscopy (XPS) was performed in a PHI Quantum 2000 spectroscopy using monochrome Al Kα radiation (1486.7 eV) with a 45° angle of electron emission. The electrical characterizations of the graphene sensor devices were carried out in an Agilent B1500 semiconductor parameter analyzer with tungsten probes, and the noise level of the current measurement was lower than 50 aA. The gas sensing experiment was performed in a home-built gas sensing probe station equipped with a gas sensing chamber and a Keithley 6430 sub-femto amp source meter inside a Faraday cage, and the whole assembly is inside fumehood. The chamber is also coupled to several mass flow controllers (Brooks 5878), which are used to regulate the speed of different gases flowing into the chamber. The electrical response of the graphene sensors to the gas can be obtained by recording the current variations as a function of gas exposure time through the source meter under the exposure of 10 ppm NH3 at room temperature.DFT calculations
To understand the binding mechanism for molecular sensing, calculations were carried out from first principles with a method based on DFT as implemented in the Siesta package.41 In the initial setup the BP2T molecule had perfectly aligned hexagons over graphene sheet with unit cell taken in (8,5) direction along molecule and (3,3) or 7.3830 Ang across. NH3 molecule was placed coordinated to sulphur atom, with preferable position to be hydrogen bonded via N–H⋯S and C–H⋯N bonds. All atoms were allowed to fully relax. Core electrons are modeled using Troullier–Martins42 soft norm-conserving pseudopotentials, with the mesh cut off was 200 Ry and Brillouin zone integration for the supercell was sampled by 1 k-point. The valence electrons are expanded in a basis set of local orbitals using a double-ζ plus polarization orbital (DZP) set. The GGA was used for the exchange–correlation functional.43Author contributions
Hu Li: conceptualization, formal analysis, funding acquisition, investigation, writing – original draft. Tianbo Duan: formal analysis, methodology, writing – review & editing. Omer Sher: formal analysis. Yuanyuan Han: formal analysis, methodology. Raffaello Papadakis: investigation, writing – review & editing. Anton Grigoriev: formal analysis, investigation, writing – review & editing. Rajeev Ahuja: supervision, writing – review & editing. Klaus Leifer: conceptualization, funding acquisition, methodology, writing – review & editing.Conflicts of interest
There are no conflicts to declare.Acknowledgements
This research was supported by the ÅForsk Foundation (grant no. 20-280), Formas (grant no. 2019-01583), Swedish Research Council (grant no. 2016-05259), Olle Engkvist (grant no. 211-0068) and I Bergh scholarship. Qilu young scholar program of Shandong University is also acknowledged for the financial support. Örjan Vallin, Amit Patel and Shuangshuang Zeng from the Ångström Microstructure Laboratory, Uppsala University, are acknowledged for the technical support in the device fabrication.References
- L. A. Ponomarenko, R. V. Gorbachev, G. L. Yu, D. C. Elias, R. Jalil, A. A. Patel, A. Mishchenko, A. S. Mayorov, C. R. Woods, J. R. Wallbank, M. Mucha-Kruczynski, B. A. Piot, M. Potemski, I. V. Grigorieva, K. S. Novoselov, F. Guinea, V. I. Fal'Ko and A. K. Geim, Nature, 2013, 497, 594–597 CrossRef CAS PubMed.
- G.-H. Lee, R. C. Cooper, S. J. An, S. Lee, A. van der Zande, N. Petrone, A. G. Hammerberg, C. Lee, B. Crawford, W. Oliver, J. W. Kysar and J. Hone, Science, 2013, 340, 1073–1076 CrossRef CAS PubMed.
- H. Li, R. Papadakis, S. H. M. Jafri, T. Thersleff, J. Michler, H. Ottosson and K. Leifer, Commun. Phys., 2018, 1, 44 CrossRef.
- J. Liu, S. Chen, R. Papadakis and H. Li, Nanotechnology, 2018, 29, 415304 CrossRef PubMed.
- H. Li, T. Duan, S. Haldar, B. Sanyal, O. Eriksson, H. Jafri, S. Hajjar-Garreau, L. Simon and K. Leifer, Appl. Phys. Rev., 2020, 7, 011403 CAS.
- J. Liu, R. Papadakis and H. Li, Appl. Phys. Lett., 2018, 113, 083108 CrossRef.
- A. a Balandin, Nat. Nanotechnol., 2013, 8, 549–555 CrossRef PubMed.
- F. Schedin, A. Geim, S. Morozov, E. Hill, P. Blake, M. Katsnelson and K. Novoselov, Nat. Mater., 2007, 6, 652–655 CrossRef CAS PubMed.
- M. Pumera, Mater. Today, 2011, 14, 308–315 CrossRef CAS.
- I. H. Wani, S. H. M. Jafri, J. Warna, A. Hayat, H. Li, V. A. Shukla, A. Orthaber, A. Grigoriev, R. Ahuja and K. Leifer, Nanoscale, 2019, 11, 6571–6575 RSC.
- W. Fu, L. Jiang, E. P. van Geest, L. M. C. Lima and G. F. Schneider, Adv. Mater., 2017, 29, 1603610 CrossRef PubMed.
- V. Georgakilas, M. Otyepka, A. B. Bourlinos, V. Chandra, N. Kim, K. C. Kemp, P. Hobza, R. Zboril and K. S. Kim, Chem. Rev., 2012, 112, 6156–6214 CrossRef CAS PubMed.
- W. Wang, Y. Zhang and Y.-B. Wang, J. Chem. Phys., 2014, 140, 094302 CrossRef PubMed.
- Y. Xu, H. Bai, G. Lu, C. Li and G. Shi, J. Am. Chem. Soc., 2008, 130, 5856–5857 CrossRef CAS PubMed.
- S. Belviso, A. Capasso, E. Santoro, L. Najafi, F. Lelj, S. Superchi, D. Casarini, C. Villani, D. Spirito, S. Bellani, A. E. Del Rio-Castillo, F. Bonaccorso, B. Sandra, C. Andrea, S. Ernesto, N. Leyla, L. Francesco, S. Stefano, C. Daniele, V. Claudio, S. Davide, B. Sebastiano, D. R.-C. A. Esau and B. Francesco, Adv. Funct. Mater., 2018, 28, 1705418 CrossRef.
- Y. Han, H. Li, S. H. M. Jafri, D. Ossipov, J. Hilborn and K. Leifer, Appl. Surf. Sci., 2020, 510, 145409 CrossRef CAS.
- P. K. Sekhar, D. Graf, O. Ojelere, T. K. Saha, M. A. Riheen and S. Mathur, J. Electrochem. Soc., 2020, 167, 027548 CrossRef CAS.
- M. Ahmad Khan, Int. J. Electrochem. Sci., 2017, 1711–1733 CrossRef.
- S. Arya, M. Riyas, A. Sharma, B. Singh, Prerna, P. Bandhoria, S. Khan and V. Bharti, Appl. Phys. A, 2018, 124, 538 CrossRef.
- T. N. Ly and S. Park, Sci. Rep., 2018, 8, 18030 CrossRef CAS PubMed.
- J. Manne, O. Sukhorukov, W. Jäger and J. Tulip, Appl. Opt., 2006, 45, 9230 CrossRef PubMed.
- S. M. Mortazavi Zanjani, M. M. Sadeghi, M. Holt, S. F. Chowdhury, L. Tao and D. Akinwande, Appl. Phys. Lett., 2016, 108, 1–6 CrossRef.
- G. Lee, G. Yang, A. Cho, J. W. Han and J. Kim, Phys. Chem. Chem. Phys., 2016, 18, 14198–14204 RSC.
- A. Cagliani, D. M. A. Mackenzie, L. K. Tschammer, F. Pizzocchero, K. Almdal and P. Bøggild, Nano Res., 2014, 7, 743–754 CrossRef CAS.
- H. Li, L. Daukiya, S. Haldar, A. Lindblad, B. Sanyal, O. Eriksson, D. Aubel, S. Hajjar-Garreau, L. Simon and K. Leifer, Sci. Rep., 2016, 6, 19719 CrossRef CAS PubMed.
- A. C. Ferrari and D. M. Basko, Nat. Nanotechnol., 2013, 8, 235–246 CrossRef CAS PubMed.
- R. Papadakis, H. Li, J. Bergman, A. Lundstedt, K. Jorner, R. Ayub, S. Haldar, B. O. Jahn, A. Denisova, B. Zietz, R. Lindh, B. Sanyal, H. Grennberg, K. Leifer and H. Ottosson, Nat. Commun., 2016, 7, 12962 CrossRef CAS PubMed.
- A. Lundstedt, R. Papadakis, H. Li, Y. Han, K. Jorner, J. Bergman, K. Leifer, H. Grennberg and H. Ottosson, Small Methods, 2017, 1, 1700214 CrossRef.
- F. Sun, H. Li, K. Leifer and E. K. Gamstedt, Int. J. Solids Struct., 2017, 129, 40–48 CrossRef CAS.
- J. T. Robinson, J. S. Burgess, C. E. Junkermeier, S. C. Badescu, T. L. Reinecke, F. K. Perkins, M. K. Zalalutdniov, J. W. Baldwin, J. C. Culbertson, P. E. Sheehan and E. S. Snow, Nano Lett., 2010, 10, 3001–3005 CrossRef CAS PubMed.
- J. Liu, Y. Song, C. Chen, X. Wang, H. Li, C. Zhou, J. Wang, K. Guo and J. Sun, Mater. Des., 2020, 186, 108355 CrossRef CAS.
- P. J. Cumpson and P. C. Zalm, Surf. Interface Anal., 2000, 29, 403–406 CrossRef CAS.
- J. Walton, M. R. Alexander, N. Fairley, P. Roach and A. G. Shard, Surf. Interface Anal., 2016, 48, 164–172 CrossRef CAS.
- K. Vikrant, V. Kumar and K. H. Kim, J. Mater. Chem. A, 2018, 6, 22391–22410 RSC.
- D. Zhao, X. Fan, Z. Luo, Y. An and Y. Hu, Phys. Lett. A, 2018, 382, 2965–2973 CrossRef CAS.
- K. K. Tadi, S. Pal and T. N. Narayanan, Sci. Rep., 2016, 6, 25221 CrossRef CAS PubMed.
- W.-L. Zhu, X.-J. Tan, C. M. Puah, J.-D. Gu, H.-L. Jiang, K.-X. Chen, C. E. Felder, I. Silman and J. L. Sussman, J. Phys. Chem. A, 2000, 104, 9573–9580 CrossRef CAS.
- W. Wongwiriyapan, S. Honda, H. Konishi, T. Mizuta, T. Ikuno, T. Ito, T. Maekawa, K. Suzuki, H. Ishikawa, K. Oura and M. Katayama, Jpn. J. Appl. Phys., 2005, 44, L482–L484 CrossRef CAS.
- X. Li, W. Cai, J. An, S. Kim, J. Nah, D. Yang, R. Piner, A. Velamakanni, I. Jung, E. Tutuc, S. K. Banerjee, L. Colombo and R. S. Ruoff, Science, 2009, 324, 1312–1314 CrossRef CAS PubMed.
- X. Liang, B. a Sperling, I. Calizo, G. Cheng, C. A. Hacker, Q. Zhang, Y. Obeng, K. Yan, H. Peng, Q. Li, X. Zhu, H. Yuan, A. R. H. Walker, Z. Liu, L.-M. Peng and C. a Richter, ACS Nano, 2011, 5, 9144–9153 CrossRef PubMed.
- F. D. Novaes, A. J. R. da Silva and A. Fazzio, Braz. J. Phys., 2006, 36, 799–807 CrossRef CAS.
- N. Troullier and J. L. Martins, Phys. Rev. B: Condens. Matter Mater. Phys., 1991, 43, 1993–2006 CrossRef CAS PubMed.
- J. J. P. Perdew, K. Burke and M. Ernzerhof, Phys. Rev. Lett., 1996, 77, 3865–3868 CrossRef CAS PubMed.
Footnotes |
| † Electronic supplementary information (ESI) available: XPS C 1s and O 1s spectra of the graphene after non-covalent BP2T functionalization, and projected density of states expanded into graphene, BP2T and NH3 contributions from DFT calculations. See DOI: 10.1039/d1ra06879b |
| ‡ These authors contribute equally. |
| This journal is © The Royal Society of Chemistry 2021 |

