 Open Access Article
Facile construction of a polypyrrole–cobalt sulfide counter electrode for low-cost dye-sensitized solar cells†
Qin Liu *ab and
Cunxi Chengab
aDepartment of Materials Science and Engineering, Xiamen Institute of Technology, China
bThe Higher Educational Key Laboratory for Flexible Manufacturing Equipment Integration of Fujian Province, Xiamen Institute of Technology, China
First published on 26th November 2021
Abstract
A polypyrrole–cobalt sulfide composite counter electrode (CE) was prepared in this work. Firstly, polypyrrole (PPy) nanorods were prepared by an in situ polymerization method on FTO, then cobalt sulfide (CoS) nanoparticles were coated on PPy nanorods by the electrodeposition method. The DSSC with PPy–CoS CE exhibits superior photoelectric conversion efficiency than that based on platinum (Pt, one of common counter electrodes), which is 7.52%, improving more than 20% compared to Pt CE (6.19%). In addition, cyclic voltammetry (CV) and electrochemical impedance spectroscopy (EIS) measurements demonstrated that the PPy–CoS CE exhibited excellent catalytic performance for I3−/I− solution.
1. Introduction
Dye-sensitized solar cells (DSSCs) have attracted considerable attention because of low cost, facile manufacturing process and high photovoltaic efficiency.1,2 The counter electrode (CE), as one of the most important component of DSSCs, plays a critical role for collecting electrons from external circuit and facilitating reversible electron exchange through the iodide/tri-iodide (I−/I3−) redox couple.3 Thus, the CE must has high conductivity and catalytic properties; in other words, the CE should has low charge transfer resistance (Rct) and high cathodic peak current density to meet the requirement of high-performance DSSCs. Nowadays, platinum (Pt) coated on fluorine doped tin oxide (FTO) glass has been widely employed as the CE due to its superior catalytic activity for the regeneration of I3−/I−redox couple. However, the high cost, low abundance and instability to electrolyte (Pt is prone to change to PtI4 in electrolyte containing I3−/I−) limited its application. Therefore, Pt-free CEs with low cost, good conductivity, acceptable catalytic activity and good stability are crucial for DSSCs with high performance. Until now, kinds of materials such as conducting polymers,4–6 carbon materials,7–10 sulfides11,12 and nitrides13 have been studied as potential candidates for Pt-free CE. In recent decades, many researchers have fabricated composite CEs using these materials, which gave comparable or superior performance than Pt-based CE via the advantage of synergetic effects between different components of the hybrids.14–17 Xu and co-authors18 prepared TiN(P)/PEDOT:PSS CE in 2012; the DSSC based on this composite CE produced a cell efficiency (η) of 7.06%, which was higher than that of Pt CE (6.57%). Yue and co-authors19 fabricated a composite CE with multi-wall carbon nanotubes (MWCNTs) and tungsten sulfide (WS2). By combining the high conductivity from MWCNTs and high catalytic activity from WS2, the DSSC with a satisfactory η of 6.41% was achieved, which is comparable to that based on Pt CE. Although the exact reason why each component in the composite CE contributes superior performance to DSSCs and the corresponding quantitative mechanism analysis are still far away, the composite CE demonstrates a new route to construct DSSCs with high-performance and low-cost properties.20As a conductive polymer, polypyrrole (PPy) has been intensively studied as a CE due to its simple fabrication process, good catalytic property and superior stability to harsh environment.21–23 Many studies have reported PPy or PPy composite CE to date.22,24,25 For example, Wang and co-authors26 combined Co and C with PPy to fabricate PPy–Co–C CE; the DSSCs based on PPy–Co–C CE obtained a η of 6.01%, slightly lower than that of Pt based DSSC (6.61%). Peng and co-authors24 had introduced carbon nanoparticles into PPy nanorod networks; the DSSC based on PPy–C CE gave a high η of 7.2%, which increased by 44% compared with pristine PPy-based DSSC and also was comparable to Pt based DSSC (7.8%). On the other hand, transition metal sulfides attracted much attention in DSSC application due to their good catalytic ability for I3− and high electrical conductivity. Among them, CoS was the first sulfide material studied as the alternative of Pt CE in DSSCs. To date, cobalt sulfides with different compositions (e.g., CoS, CoS1.0365, CoS1.097, Co3S4, and CoS2) have been exploited in DSSCs.27–31 It has been proved that the DSSC based on sulfur-deficient CoSx shows better performance than that based on sulfur-rich CoSx attributed to different surface characteristics and electrical properties of CoSx.32 For the sulfur-deficient CoSx, Lin and co-authors33 studied how to control the formation of CoS and found that the CoS pure phase can be synthesized via the potentiodynamic deposition method using CoCl2 and thiourea (TU) because TU could suppress the combination of Co2+ to other ions (like OH−) by forming Co(TU)22+ and enhancing the reduction of Co(TU)22+ to CoS; the prepared CoS CE endows the DSSC with comparable η to that based on Pt CE.
Though both PPy and CoS are good candidate materials for CE of DSSCs, there are no reports about their hybrids in DSSC applications. Herein, we fabricated PPy–CoS CE as the replacement of Pt CE in DSSCs. The PPy nanorods were firstly prepared by chemical deposition in this work, then CoS was deposited on a PPy film via potentiodynamic deposition. The fabricated composite CE demonstrated superior electrical conductivity and electrocatalytic activity. The photovoltaic conversion efficiency of the DSSC based on PPy–CoS CE is 7.52%, which exceeds 20% of that based on Pt CE (6.19%).
2. Experimental
2.1 Materials
Tetrabutyl titanate, sodium iodide, iodine, acetonitrile, tetramethyl ammonium iodide, 4-tert-butylpyridine, pyrrole, cobalt chloride hexahydrate, thiourea, hydrochloric acid (36 wt%, aqueous solution), n-butyl ammonium iodide, methyl orange and ferric chloride were all A.R. grade and purchased from Sigma Aldrich. Fluorine-doped tin oxide (FTO, 8 Ω cm−2) was purchased from Sigma Aldrich. RuL2(NCS)2 and L 4,4′-dicarboxylate-2,2′-bipyridine (N-719) was obtained from Solaronix SA.2.2 Preparation of PPy–CoS CEs
PPy–CoS CEs were fabricated by two steps. Firstly, a nanorod PPy layer on the FTO was synthesized as follows: 0.0327 g of methyl orange and 0.07 mL of pyrrole were dispersed in 40 mL of deionized water solution, then FTO (3 cm × 2 cm) was immersed in the mixture solution. 0.56 g of ferric trichloride was added to the above mixture solution and kept at 4 °C for 24 h. The fabricated PPy CE was washed by deionized water and ethanol successively and vacuum dried at 60 °C. Secondly, a CoS layer was coated on the PPy CE by the potentiodynamic deposition method using a electrochemical workstation (CHI660C, CHI Instruments). The FTO with a PPy layer was used as the working electrode and immersed in the water solution containing 0.05 M CoCl2 and 0.75 M thiourea; Pt and Ag/AgCl were employed as the counter electrode and reference electrode, respectively. In addition, the potentiodynamic deposition procedure was performed at a potential from −0.8 V to 1.2 V for 1, 3, 5, 7 and 10 cycles (scan rate of 5 mV s−1) at room temperature. The PPy–CoS composite CEs were named as PPy–CoS-1, PPy–CoS-3, PPy–CoS-5, PPy–CoS-7 and PPy–CoS-7 in the following discussion, where the number denotes the CV cycles when preparing CoS by potentiodynamic deposition.2.3 Preparation of dye-sensitized TiO2 photoanodes
TiO2 colloid was obtained according to the hydrothermal reaction method reported by Yune.34 The microporous TiO2 film was prepared as follows. TiO2 colloid was cast on a FTO glass by a casting knife with a thickness of 400 μm. Then the samples were heated in a Maffei furnace at 450 °C for 30 min to form a compact TiO2 film, following which, the nanocrystalline TiO2 film was immersed in a TiCl4/H2O solution with TiCl4 concentration of 0.05 mol L−1. The sintering process was repeated in the furnace as described above. The resultant TiO2 film was immersed in a dye N-719/ethanol solution (2.5 × 10⁻⁴ M) for 1 day to obtain the dye-sensitized TiO2 electrode.2.4 Fabrication of DSSCs
The DSSC was assembled by injecting the liquid electrolyte (1 M 1,3-dimethylimidazoliumiodine, 0.15 M iodine, 0.5 M 4-tert-butylpyridine, and 0.1 M guanidine thiocyanate in 3-methoxypropionitrile) into the aperture between the TiO2 electrode and the CE. The two electrodes were clamped and sealed together before the photovoltaic conversion efficiency measurement.2.5 Measurements
Elemental distribution in CE was investigated by an Energy Dispersive X-Ray (EDX) spectrometer (JED-2300). The surface and cross-sectional morphologies of the CEs were observed using a field-emission scanning electron microscope (JSM-6700F). The chemical structure of PPy was analyzed via attenuated total reflection Fourier-transform infrared (ATR-FTIR) spectroscopy (Nicolet 6700 FTIR). The crystal structure of CoS was determined by X-ray diffraction (XRD, X'Pert Pro). Cyclic voltammetry (CV) analysis was performed in the three-electrode one-compartment cell: the PPy–CoS working electrode, one Pt sheet counter electrode and Ag/AgCl reference electrode were immersed in an acetonitrile solution of 10 mM LiI, 1 mM I2, and 0.1 mM LiClO4.Electrochemical impedance spectroscopy (EIS) was conducted with two identical electrodes, which was the same as that used in the DSSC. The EIS measurement was performed under the simulating open-circuit conditions at ambient atmosphere, and the frequency ranged from 0.1 to 105 Hz. The photovoltaic test of the DSSC was carried out by measuring the current–voltage (J–V) curves on an electrochemical workstation (CHI660C, Shanghai Chen hua Device Company, China) under irradiation with a simulated solar light from a 100 W xenon arc lamp (XQ-500 W, Shanghai Photo-electricity Device Company, China) in ambient atmosphere. The intensity of incident illumination was 100 mW cm−2 (AM 1.5). The fill factor (FF) and light-to-electric energy conversion efficiency (η) of the DSSC were calculated according to the following equations:
 | (1) |
 | (2) |
3. Results and discussion
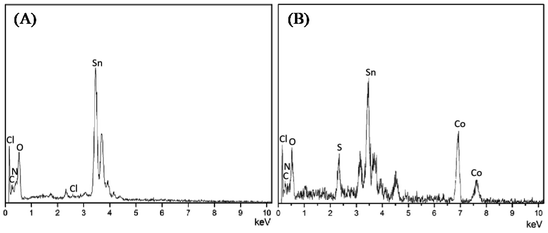
FTIR spectroscopy and XRD were performed to identify the compositions of PPy and CoS, respectively. Fig. S1A† illustrates the characteristic peaks of PPy.21,24 For example, the bands at 1550, 1462 and 1186 cm−1 come from the pyrrole ring and C–N stretching in PPy, respectively; the peak located at 920 cm−1 corresponds to the C–N stretching vibration, the bands at 1043 and 790 cm−1 are ascribed to C–C stretching and C–H vibrations, respectively. Fig. S1B† presents the XRD results of CoS. The 2θ values of 30.4, 36.2, 47.0 and 54.5° are indexed to the planes of (100), (101), (102) and (110), respectively.27 EDX and SEM were employed to confirm the successful construction of PPy–CoS CEs, in which PPy–CoS-5 was selected as the representative to compare with the pristine PPy CE. The C, N and Cl elements in the EDX spectrum of Fig. 1A were derived from PPy, Sn and O elements were from the conductive glass matrix; the new elements Co and S in Fig. 1B demonstrates the successful deposition of CoS on the PPy layer. Fig. 2 presents the SEM images of the PPy (A1 and A2) and PPy–CoS (B1 and B2) CE with different magnification. The increased diameter of nanorods and roughness of the surface morphology further confirms the successful uniform growth of CoS on the PPy nanorod.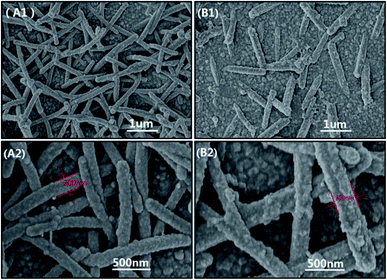 | ||
| Fig. 2 The surface morphology of PPy (A1 and A2) and PPy–CoS-5 (B1 and B2) CE with different magnification. | ||
Fig. 3A gives the CV results of the PPy and PPy–CoS CEs, in which all CEs show two pairs of redox peaks that correspond to I−/I3− and I3−/I2 redox couple.
| I3− + 2e → 3I− |
| 3I2 + 2e → 2I3− |
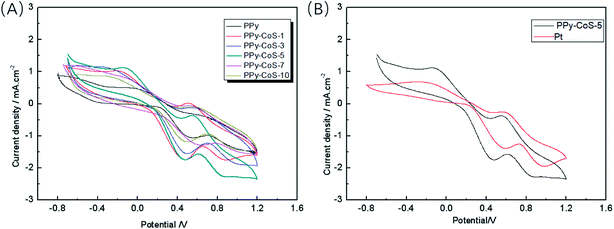 | ||
| Fig. 3 The cyclic voltammograms for (A) PPy and PPy–CoS CEs, and (B) PPy–CoS-5 and Pt CE (the scanning speed is 50 mV s−1). | ||
The magnitude cathodic peak current density refers to the catalytic ability of the CE for I3− reduction reaction.25 PPy–CoS CEs show higher cathodic peak current densities than PPy CE, indicating that the catalytic ability of CE was improved after depositing CoS. Moreover, among these composite CEs, PPy–CoS-5 CE presents the highest peak current density, implying that 5-sweep-circle deposition is the optimal condition for PPy–CoS CE preparation. Further, comparing the cyclic voltammograms of PPy–CoS-5 and Pt CE (Fig. 3B), it is obvious that our PPy–CoS-5 CE even shows higher cathodic peak current density than that of Pt CE; in other words, the PPy–CoS-5 CE has superior electrocatalytic ability than that of Pt CE.
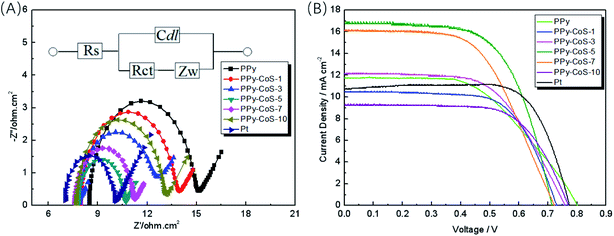
Fig. 4A presents the electrochemical impedance spectroscopy (EIS) results of the Pt and PPy–CoS CEs. The Rct values of CEs are listed in Table 1, in which the Rct of PPy is 6.37 Ω cm2, and PPy–CoS CEs show lower Rct. The lower charge transfer resistance (Rct) is in accordance with the lower overpotential for electron transfer at the CE–electrolyte interface. The decrease of Rct can be due to the excellent electrocatalytic ability of CoS; besides, the large surface area provided by PPy nanorods also contributes to the good electrocatalytic ability of PPy–CoS CEs, thus accelerating the electron transport from CE to I3− and the I3− reduction reaction. On the other hand, the CE's thickness increases with the increasing deposition time of CoS (Fig. S3†), which might result in the increase of Rct for CEs. In our work, the optimised CE is PPy–CoS-5 with a thickness of approximately 300 nm. It exhibits the lowest Rct of 2.83 Ω cm2, which is comparable to that of Pt CE (3.04 Ω cm2). Here, the results of Rct are well consistent with the analysis of CV test in Fig. 3A.
| CEs | Rct (Ω cm2) | Voc (mV) | Jsc (mA cm−2) | FF | η (%) |
|---|---|---|---|---|---|
| PPy | 6.37 | 801 | 11.77 | 0.530 | 5.00 |
| PPy–CoS-1 | 5.70 | 731 | 10.44 | 0.660 | 5.03 |
| PPy–CoS-3 | 5.36 | 760 | 12.12 | 0.589 | 5.42 |
| PPy–CoS-5 | 2.83 | 715 | 16.78 | 0.627 | 7.52 |
| PPy–CoS-7 | 3.02 | 724 | 16.15 | 0.565 | 6.61 |
| PPy–CoS-10 | 5.24 | 772 | 10.94 | 0.662 | 5.59 |
| Pt | 3.04 | 774 | 10.77 | 0.743 | 6.19 |
Fig. 4B shows the I–V analysis results of the DSSCs with the PPy–CoS and Pt CEs under a simulated solar illumination of 100 mW cm−2 (AM 1.5). The photo voltaic parameters of the DSSCs based on different CEs are listed in Table 1. The PPy CE based DSSC shows low Jsc and η, but exhibits the highest Voc; this might be due to the thin thickness of the PPy film. However, after incorporating CoS, the DSSCs based on PPy–CoS CEs show improved η. The different potentiodynamic deposition time of CoS endows PPy–CoS CE with various thickness and photovoltaic parameters. The Jsc for DSSCs based on PPy–CoS CEs increases with the decrease of Rct, which is in accordance with the cathodic current density results in the above-mentioned CV analysis. Notably, PPy–CoS-5 shows the highest Jsc of 16.78 mA cm−2, which is highly improved compared with PPy CE and this value is even higher than that of Pt-based DSSCs. This can be attributed to the high cathodic current density of PPy–CoS-5 CE and enhanced catalytic ability of the I−/I3− redox couple.35 Furthermore, the enhancement of fill factor (FF) after introducing CoS can be attributed to the lower Rct at the electrolyte–CE interface.36–38 Though the FF of the DSSC based on PPy–CoS CE is lower than that based on Pt CE, it obtained a superior η due to its high Jsc and low Rct.
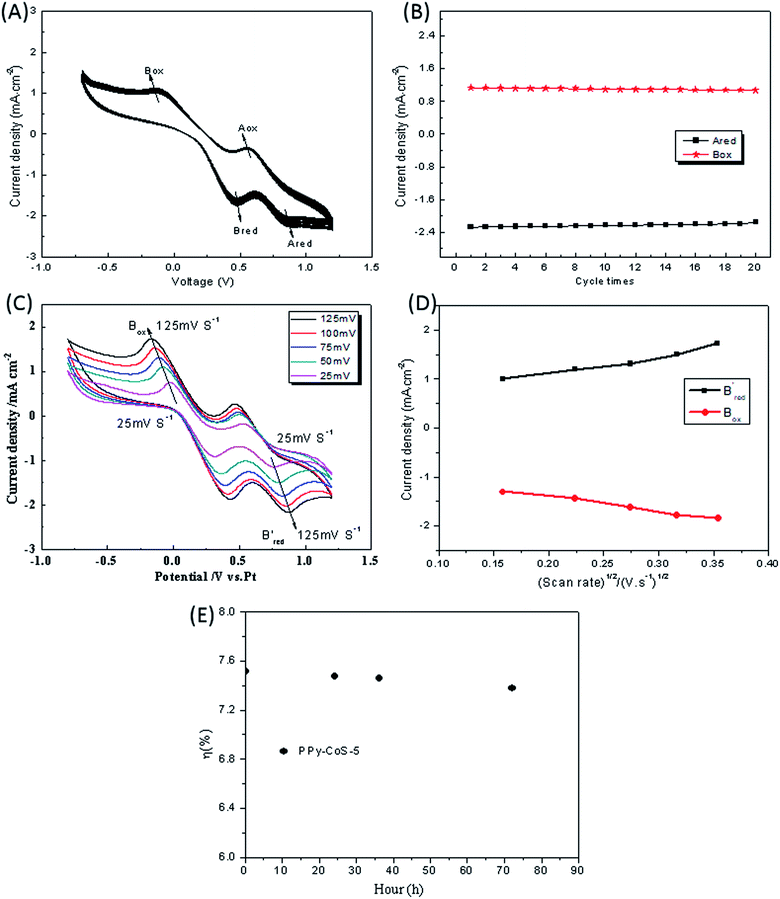
Fig. 5A presents the 20-sweep-circle cyclic voltammograms of the PPy–CoS-5 CE with a scan rate of 50 mV s−1. Obviously, the 20-sweep-circle cyclic voltammograms exhibit good repeatability, and the redox peak current density of the PPy–CoS-5 CE almost remains the same (Fig. 5B), which has a linear relationship with the number of cyclic voltammetry scans. This indicates that the prepared PPy–CoS-5 CE tightly attached on the surface of the FTO substrate and has good electrocatalytic stability.4 Fig. 5C shows the cyclic voltammetry curve of the PPy–CoS-5 CE at different scanning speeds; the scanning speed from inside to outside is 25 mV s−1, 50 mV s−1, 75 mV s−1, 100 mV s−1 and 125 mV s−1, respectively. With the increase of the scan rate, the oxidation peak shifts to the positive direction and the reduction peak gradually shifts to the negative direction, respectively. In addition, there is a linear relationship between the current density and the square root of the scan rate (Fig. 5D), indicating that there is no other reaction between the I−/I3− redox system and the PPy–CoS-5 CE.39 In the consecutive stability test of DSSC based on PPy–CoS-5 CE (Fig. 5E), the η did not change greatly after 72 h, it reduced by ∼2%, indicating that the DSSCs with PPy–CoS-5 CE had satisfactory stability; this result is also in accordance with the analysis of above consecutive CV.
4. Conclusion
The PPy–CoS CE was prepared by a two-step method. The synergy of polypyrrole nanorods and cobalt sulfide endows the CE with superior electrochemical activity. The DSSC based on the PPy–CoS CE presents a high cell efficiency of 7.52%, which is almost 1.2 times that of the DSSC based on Pt CE (6.19%). The successful construction of the PPy–CoS composite CE demonstrated its potential application in the photoelectric field, as well as the importance of fabricating Pt-free CEs for DSSCs.Conflicts of interest
There are no conflicts of interest to declare.Acknowledgements
The project was funded by Xiamen Institute of Technology advanced functional materials research and innovation team (KYTD202004).References
- B. O'Ran and M. Grtzel, Nature, 1991, 353, 737–739 CrossRef.
- M. Grtzel, Nature, 2001, 414, 338–344 CrossRef PubMed.
- A. Hagfeldt, G. Boschloo, L. Sun, L. Kloo and H. Pettersson, Chem. Rev., 2010, 110, 6595–6663 CrossRef CAS PubMed.
- Q. Li, J. Wu, Q. Tang, Z. Lan, P. Li, J. Lin and L. Fan, Electrochem. Commun., 2008, 10, 1299–1302 CrossRef CAS.
- N. Balis, T. Makris, V. Dracopoulos, T. Stergiopoulos and P. Lianos, J. Power Sources, 2012, 203, 302–307 CrossRef CAS.
- A. S. A. Ahmed, W. Xiang, I. Saana Amiinu and X. Zhao, New J. Chem., 2018, 42, 17303–17310 RSC.
- L. Kavan, J. H. Yum and M. Gratzel, Nano Lett., 2011, 11, 5501–5506 CrossRef CAS PubMed.
- G. R. Li, F. Wang, Q. W. Jiang, X. P. Gao and P. W. Shen, Angew. Chem., 2010, 49, 3653–3656 CrossRef CAS PubMed.
- K. T. Dembele, R. Nechache, L. Nikolova, A. Vomiero, C. Santato, S. Licoccia and F. Rosei, J. Power Sources, 2013, 233, 93–97 CrossRef CAS.
- S. S. Nemala, P. Kartikay, R. K. Agrawal, P. Bhargava, S. Mallick and S. Bohm, Sol. Energy, 2018, 169, 67–74 CrossRef CAS.
- H. Sun, Q. Da, S. Huang, X. Guo, D. Li, Y. Luo and Q. Meng, Energy Environ. Sci., 2011, 4, 2630–2637 RSC.
- M. Wu, Y. Wang, X. Lin, N. Yu, L. Wang, L. Wang, A. Hagfeldt and T. Ma, Phys. Chem. Chem. Phys., 2011, 13, 19298–19301 RSC.
- G. R. Li, J. Song, G. L. Pan and X. P. Gao, Energy Environ. Sci., 2011, 4, 1680–1683 RSC.
- M. Wu, X. Lin, A. Hagfeldt and T. Ma, Angew. Chem., Int. Ed., 2011, 50, 3520–3524 CrossRef CAS PubMed.
- M. Wu, Y. Wang, X. Lin, W. Guo, K. Wu, Y. Lin, H. Guo and T. Ma, J. Mater. Chem. A, 2013, 1, 9672–9679 RSC.
- J. Guo, B. Zhang, Y. Hou, S. Yang, X. Yang and H. Yang, J. Mater. Chem. A, 2013, 1, 1982–1986 RSC.
- J. Huo, J. Wu, M. Zheng and Z. Lan, Electrochim. Acta, 2016, 187, 210–217 CrossRef CAS.
- H. Xu, X. Zhang, C. Zhang, Z. Liu, X. Zhou, S. Pang, X. Chen, S. Dong, Z. Zhang, L. Zhang, P. Han, X. Wang and G. Cui, ACS Appl. Mater. Interfaces, 2012, 4, 1087–1092 CrossRef CAS PubMed.
- G. Yue, J. Wu, J. Y. Lin, M. Y. Xiao, S. Tai, J. Lin, M. Huang and L. Zhang, Carbon, 2013, 55, 1–9 CrossRef CAS.
- J. Wu, Z. Lan, J. Lin, M. Huang, Y. Huang, L. Fan, G. Luo, Y. Lin, Y. Ming and Y. Wei, Chem. Soc. Rev., 2017, 46, 5975–6023 RSC.
- J. Wu, Q. Li, L. Fan, Z. Lan, P. Li, J. Lin and S. Hao, J. Power Sources, 2008, 181, 172–176 CrossRef CAS.
- J. Xia, L. Chen and S. Yanagida, J. Mater. Chem., 2011, 21, 4644–4649 RSC.
- G. Wang, W. Dong, C. Yan, S. Hou and W. Zhang, Mater. Lett., 2018, 214, 158–161 CrossRef CAS.
- S. Peng, L. Tian, J. Liang, S. G. Mhaisalkar and S. Ramakrishna, ACS Appl. Mater. Interfaces, 2012, 4, 397–404 CrossRef CAS PubMed.
- P. Jha, P. Veerender, S. P. Koiry, C. Sridevi, A. K. Chauhan, K. P. Muthe and S. C. Gadkari, Polym. Adv. Technol., 2017, 1–6 Search PubMed.
- L. Wang, K. Zhang, F. Cheng and J. Cheng, Sci. China: Chem., 2014, 57, 1559–1563 CrossRef CAS.
- G. Zhuang, H. Liu and X. Chen, RSC Adv., 2018, 8, 18792–18799 RSC.
- J. Jin, X. Zhang and T. He, J. Phys. Chem. C, 2014, 118, 24877–24883 CrossRef CAS.
- S. A. Patil, D. V. Shinde, I. Lim, K. Cho, S. S. Bhande, R. S. Mane, N. K. Shrestha, J. Lee, T. Yoona and S. Han, J. Mater. Chem. A, 2015, 3, 7900–7909 RSC.
- Y. Zhao, J. Wang, L. Zheng, P. Sun, Ni. Huang, X. Huang and X. Sun, J. Nanopart. Res., 2019, 21, 123 CrossRef.
- W. Wang and J. Yang, J. Mater. Sci.: Mater. Electron., 2018, 29, 19867–19872 CrossRef CAS.
- M. S. Kim and J. H. Bang, J. Phys. Chem. C, 2018, 122, 13267–13276 CrossRef CAS.
- J. Y. Lin, J. H. Liao and S. W. Chou, Electrochim. Acta, 2011, 56, 8818–8826 CrossRef CAS.
- J. H. Yune, I. Karatchevtseva, G. Triani, W. Klaudia and O. David, J. Mater. Res., 2013, 28, 488–496 CrossRef CAS.
- Y. Xiao, J. Wu, J. Lin, S. Tai and G. Yue, J. Mater. Chem. A, 2013, 1, 1289–1295 RSC.
- G. Mor, K. Shankar, M. Paulose, O. Varghese and C. Grimes, Nano Lett., 2006, 6, 215 CrossRef CAS PubMed.
- Y. Saito, W. Kubo, T. Kitamura, Y. Wada and S. Yanagida, J. Photochem. Photobiol., A, 2004, 164, 153 CrossRef CAS.
- J. Lin and J. Liao, J. Electrochem. Soc., 2012, 159, D65–D71 CrossRef CAS.
- K. Imoto, K. Takahashi, T. Yamaguchi, T. Komura, J.-i. Nakamura and K. Murata, Sol. Energy Mater. Sol. Cells, 2003, 79, 459–469 CrossRef CAS.
Footnote |
| † Electronic supplementary information (ESI) available. See DOI: 10.1039/d1ra06946b |
| This journal is © The Royal Society of Chemistry 2021 |

