DOI:
10.1039/D1RA07043F
(Paper)
RSC Adv., 2021,
11, 38528-38536
Photocatalysis of nanocomposite titania–natural silica as antibacterial against Staphylococcus aureus and Pseudomonas aeruginosa†
Received
20th September 2021
, Accepted 13th November 2021
First published on 8th December 2021
Abstract
The entries of pathogenic bacteria into the human body remain a severe problem to health that can be prevented using antibacterial agents. Meanwhile, the photocatalytic technique using semiconductor nanocomposite TiO2–SiO2 has great potential as an antibacterial method. In order to utilize natural resources, SiO2 supporting materials are obtained from the extraction of beach sand due to the high silica content. Therefore, this study aims to synthesize a nanocomposite of TiO2 with SiO2 extracted from beach sand as an antibacterial agent against Staphylococcus aureus and Pseudomonas aeruginosa. The antibacterial activity test used the dilution and optical density method. Based on XRD analysis, the crystals of TiO2 in the synthesized composites showed a more dominant anatase structure. Furthermore, Ti–O–Si bonds were identified from the IR spectrum, which showed the interaction between TiO2 and SiO2. In addition, SEM-EDX results showed agglomerated spherical particles with a TiO2–SiO2 nanocomposite particle size of 40–107 nm. The best antibacterial activity was demonstrated by the 1![[thin space (1/6-em)]](https://www.rsc.org/images/entities/char_2009.gif) :
:![[thin space (1/6-em)]](https://www.rsc.org/images/entities/char_2009.gif) 0.5 TiO2–SiO2 nanocomposite, with inactivation percentages of S. aureus and P. aeruginosa of 98.69% and 97.44%, respectively.
0.5 TiO2–SiO2 nanocomposite, with inactivation percentages of S. aureus and P. aeruginosa of 98.69% and 97.44%, respectively.
Introduction
Pathogenic bacteria remain a considerable problem for human health,1 due to the large population and extremely small size, and being located in various environments.2 These bacteria are capable of infecting humans and causing various diseases such as pleuropneumonia,3 pneumonia,4 septicemia,5 edema,6 and other dangerous diseases.2 As a preventative measure, antibacterial agents minimize the harmful effects by inhibiting bacterial growth. In general, these agents consist of organic compounds used as disinfection systems and antibiotics.7 However, there are certain limitations, such as relatively high toxicity, instability of physical properties to pressure and temperature, and the existence of various antibiotic-resistant strains.8–10 Consequently, the development of renewable antibacterial agents remains one of the biggest health challenges in the world.9 Therefore, the interest in safer inorganic disinfectants is increasing.
The use of disinfectants with inorganic substances is usually carried out through photocatalysis, a combination of chemical reactions that require light and photocatalysts to accelerate chemical transformations.11 Meanwhile, sunlight is the most abundant, clean, and safest sustainable energy source.12 This process produces radical oxygen species (ROS) capable of inactivating bacteria.13,14 Furthermore, the efficiency of a photocatalyst is influenced by the surface area of the active reacting sites.15 Therefore, it is necessary to control the particle size and increase the surface area through the application of nanotechnology. The development of nanotechnology materials has attracted attention from various circles.16 When used as an antibacterial material, nanoparticles have the advantage of a high ratio of surface area to volume and new properties.9,17 This causes an increase in chemical activity and adsorption capacity against target contaminants which creates more significant potential in combating bacteria.18
One of the best materials for photocatalytic processes is titanium dioxide (TiO2),19 due to its several advantages such as high photocatalytic activity, good chemical stability, high oxidizing power, low toxicity, and ready availability.19,20 Furthermore, it has been investigated as an antibacterial agent on P. aeruginosa to impair respiratory activity, destroy cells,21 and increase polyunsaturated membrane phospholipids. Furthermore, the anatase phase of TiO2 has energy corresponding to the reduction energy of O2 in the photocatalytic process,22 but its transformation to rutile limits the photocatalytic activity.23 Also, TiO2 has some drawbacks, such as agglomeration, which causes a reduction in surface area in solution.24,25 However, this reduction is minimized by combining TiO2 with other materials such as SiO2,23 ZnO,26 Fe2O3,27 and CuO.28 Among the various types of supporting metal oxides, SiO2 has various advantages because it minimizes recombination, increases adsorption capacity, and prevents agglomeration.29 Erdural et al. (2014) added synthesized SiO2 to TiO2 photocatalyst with various concentrations, leading to inactivation ranging from 14.2 to 99.9% for E. coli bacteria.30
SiO2 is obtained through synthesis or extraction from natural materials, both biological and non-biological.23 To maximize natural resources, silica is obtained from the extraction of beach sand.31 Based on data from the Ministry of Energy and Mineral Resources, Indonesian Geological Resources Center (2012), the total availability of silica sand is approximately 22.5 billion tons spread throughout Indonesia with 85% of the highest distribution on Sumatra Island, including Bengkulu Province.32 Ishmah (2020) reported that 97.3% of silica had been successfully extracted from the beach in Bengkulu Province.31 The incorporation of TiO2 and silica increases photocatalytic activity by enlarging the surface area of the active sites of the photocatalyst and inhibiting the transformation from anatase to rutile.20,33 Therefore, this study focuses on adding SiO2 from beach sand extract to TiO2 photocatalyst by a sonochemistry method and its application as an antibacterial against Gram-positive Staphylococcus aureus and Gram-negative Pseudomonas aeruginosa.
Results and discussion
Formation results of TiO2 and TiO2–SiO2 nanocomposite
TiO2–SiO2 nanocomposite was synthesized with various mole ratios of 1![[thin space (1/6-em)]](https://www.rsc.org/images/entities/char_2009.gif) :
:![[thin space (1/6-em)]](https://www.rsc.org/images/entities/char_2009.gif) 0.5; 1
0.5; 1![[thin space (1/6-em)]](https://www.rsc.org/images/entities/char_2009.gif) :
:![[thin space (1/6-em)]](https://www.rsc.org/images/entities/char_2009.gif) 1; and 1
1; and 1![[thin space (1/6-em)]](https://www.rsc.org/images/entities/char_2009.gif) :
:![[thin space (1/6-em)]](https://www.rsc.org/images/entities/char_2009.gif) 2 using the sonochemistry method as shown in Fig. 1. Sonochemistry has been widely used to synthesize nano-sized materials.34 To prepare the TiO2–SiO2 nanocomposite, titanium tetraisopropoxide (TTIP) was used as a precursor to form TiO2. TTIP was reacted with isopropyl alcohol thereby causing the hydrolysis and condensation reactions to produce TiO2.35 The reaction mechanism for the formation of TiO2 from TTIP is shown in Fig. 1.
2 using the sonochemistry method as shown in Fig. 1. Sonochemistry has been widely used to synthesize nano-sized materials.34 To prepare the TiO2–SiO2 nanocomposite, titanium tetraisopropoxide (TTIP) was used as a precursor to form TiO2. TTIP was reacted with isopropyl alcohol thereby causing the hydrolysis and condensation reactions to produce TiO2.35 The reaction mechanism for the formation of TiO2 from TTIP is shown in Fig. 1.
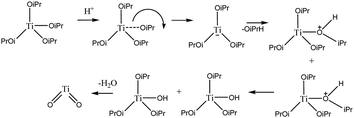 |
| | Fig. 1 Hydrolysis and condensation reactions to form TiO2. | |
This study used silica extracted from beach sand of Bengkulu, Indonesia based on a previous study.31 The sonochemistry synthesis method was used with ultrasonic waves which cause smaller particles to form and increase size uniformity. The reaction products are obtained in the form of nanoamorphous and nanocrystalline particles.34 These ultrasonic effects are summarized in reactions (1)–(7):36
| |
|
RH (volatile vapor) → R˙ + H˙
| (5) |
| |
|
RH + OH˙ or H˙ → R˙ + H2O (or H2)
| (6) |
| |
|
Ti4+ + nR˙ (or H˙) → Ti0
| (7) |
XRD characterization results
The diffractogram produced showed conformance to ICSD 98-015-6838 (ref. 37) for the anatase structure (tetragonal, space group I41/amd) and ICSD 98-016-5921 (ref. 38) for the rutile structure (tetragonal, space group P42/mnm). The synthesized TiO2 crystals showed peaks at 2θ = 25.2° (011), 37.8° (004), 47.8° (020), twin peaks at 53.9° (015) and 54.7° (121), 62.5 (024), twin peaks at 69.0° (116) and 70.1° (220), and 75.0° (125) as characteristic of TiO2 anatase crystals. In the pattern of the TiO2–SiO2 nanocomposite, there are no additional peaks, but there is a change in the intensity and width of the peaks due to the addition of SiO2. The results of XRD analysis of synthesized TiO2, and TiO2–SiO2 nanocomposite with mole ratios 1![[thin space (1/6-em)]](https://www.rsc.org/images/entities/char_2009.gif) :
:![[thin space (1/6-em)]](https://www.rsc.org/images/entities/char_2009.gif) 0.5; 1
0.5; 1![[thin space (1/6-em)]](https://www.rsc.org/images/entities/char_2009.gif) :
:![[thin space (1/6-em)]](https://www.rsc.org/images/entities/char_2009.gif) 1; and 1
1; and 1![[thin space (1/6-em)]](https://www.rsc.org/images/entities/char_2009.gif) :
:![[thin space (1/6-em)]](https://www.rsc.org/images/entities/char_2009.gif) 2 are shown in Fig. 2.
2 are shown in Fig. 2.
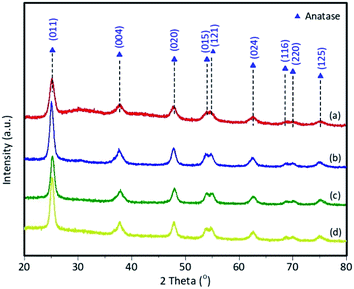 |
| | Fig. 2 XRD patterns for (a) synthesized TiO2; (b) TiO2–SiO2 1![[thin space (1/6-em)]](https://www.rsc.org/images/entities/char_2009.gif) : :![[thin space (1/6-em)]](https://www.rsc.org/images/entities/char_2009.gif) 0.5; (c) TiO2–SiO2 1 0.5; (c) TiO2–SiO2 1![[thin space (1/6-em)]](https://www.rsc.org/images/entities/char_2009.gif) : :![[thin space (1/6-em)]](https://www.rsc.org/images/entities/char_2009.gif) 1; (d) TiO2–SiO2 1 1; (d) TiO2–SiO2 1![[thin space (1/6-em)]](https://www.rsc.org/images/entities/char_2009.gif) : :![[thin space (1/6-em)]](https://www.rsc.org/images/entities/char_2009.gif) 2. 2. | |
Table 1 shows that the addition of SiO2 affects the percentage of the crystal phase in the samples. TiO2 and composites synthesized using the sonochemistry method had a high percentage of anatase (96.7–100.0%). These data demonstrate the role of ultrasonic waves in the formation of crystals in the samples. Furthermore, the samples were prepared with a calcination temperature of 500 °C as the optimal temperature in the formation of TiO2 with the anatase crystal structure.39
Table 1 Phase percentages and Rietveld refinement parameters of the samples
| Sample |
Phase (%) |
Rietveld refinement parameters |
| Anatase |
Rutile |
Rexp |
Rwp |
GoF |
| SiO2 |
— |
— |
3.33 |
4.96 |
2.21 |
| TiO2 |
97.2 |
2.8 |
4.31 |
6.33 |
2.15 |
TiO2–SiO2 1![[thin space (1/6-em)]](https://www.rsc.org/images/entities/char_2009.gif) : :![[thin space (1/6-em)]](https://www.rsc.org/images/entities/char_2009.gif) 0.5 0.5 |
96.7 |
3.3 |
5.64 |
6.88 |
1.49 |
TiO2–SiO2 1![[thin space (1/6-em)]](https://www.rsc.org/images/entities/char_2009.gif) : :![[thin space (1/6-em)]](https://www.rsc.org/images/entities/char_2009.gif) 1 1 |
100.0 |
— |
5.63 |
6.75 |
1.44 |
TiO2–SiO2 1![[thin space (1/6-em)]](https://www.rsc.org/images/entities/char_2009.gif) : :![[thin space (1/6-em)]](https://www.rsc.org/images/entities/char_2009.gif) 2 2 |
100.0 |
— |
4.73 |
9.22 |
3.80 |
The XRD data showed that the addition of SiO2 to the sample caused a reduction in the percentage of rutile structure in TiO2. Similarly, TiO2–SiO2 1![[thin space (1/6-em)]](https://www.rsc.org/images/entities/char_2009.gif) :
:![[thin space (1/6-em)]](https://www.rsc.org/images/entities/char_2009.gif) 1 and 1
1 and 1![[thin space (1/6-em)]](https://www.rsc.org/images/entities/char_2009.gif) :
:![[thin space (1/6-em)]](https://www.rsc.org/images/entities/char_2009.gif) 2 composite samples did not have a rutile structure of TiO2. Hence, the presence of SiO2 inhibits the transformation from anatase to rutile. This is in accordance with Besançon et al. (2016).20 Meanwhile, TiO2 with anatase phase is the best for photocatalytic applications.40 However, a small amount of rutile phase is still required in the photocatalysis process.
2 composite samples did not have a rutile structure of TiO2. Hence, the presence of SiO2 inhibits the transformation from anatase to rutile. This is in accordance with Besançon et al. (2016).20 Meanwhile, TiO2 with anatase phase is the best for photocatalytic applications.40 However, a small amount of rutile phase is still required in the photocatalysis process.
Habibi-Yangjeh et al. (2020) reported that a small amount of rutile phase in a TiO2 photocatalyst is needed for electron transfer between crystalline phases, which functions to avoid recombination.41
To confirm the accuracy of the calculation from Rietveld refinement, the goodness of fit (GoF) value of the experimental XRD pattern with the XRD pattern calculated from the standard was calculated. The ideal value of GoF is 1.42 In Table 1, it can be seen that the GoF value of the samples is in the range of 1.44–3.80. This value can still be categorized as good and acceptable (<4) because the XRD pattern obtained from the experimental results cannot be separated from noise so that the GoF value will be above 1. The Rietveld refinement plot is depicted in Fig. S1–S4.†
The crystallite size is calculated based on the Scherrer equation. The calculated crystallite size is the average of each phase peak in the XRD pattern and is calculated with the standard deviation. Table 2 shows that the addition of SiO2 in a certain amount increases TiO2 crystallinity. The TiO2 sample had a crystallinity percentage of 64.4%; meanwhile, there was an increase in the crystallinity to 88.4% (TiO2–SiO2 1![[thin space (1/6-em)]](https://www.rsc.org/images/entities/char_2009.gif) :
:![[thin space (1/6-em)]](https://www.rsc.org/images/entities/char_2009.gif) 0.5) when SiO2 was added. However, this increase caused a decrease in the crystallinity percentage of the composite sample. This is because the amorphous structure of SiO2 causes a reduction in crystallinity. High crystallinity is needed in photocatalysis to avoid the possibility of electron–hole recombination, thereby increasing photocatalytic activity.43
0.5) when SiO2 was added. However, this increase caused a decrease in the crystallinity percentage of the composite sample. This is because the amorphous structure of SiO2 causes a reduction in crystallinity. High crystallinity is needed in photocatalysis to avoid the possibility of electron–hole recombination, thereby increasing photocatalytic activity.43
Table 2 The crystal size of anatase and rutile (shown as the mean ± the standard deviation) and crystallinity percentages of the samples
| Sample |
Crystal size (nm) |
Crystallinity (%) |
| Anatase |
Rutile |
| SiO2 |
— |
— |
11.90 |
| TiO2 |
8.36 ± 0.88 |
8.028 ± 0.82 |
64.48 |
TiO2–SiO2 1![[thin space (1/6-em)]](https://www.rsc.org/images/entities/char_2009.gif) : :![[thin space (1/6-em)]](https://www.rsc.org/images/entities/char_2009.gif) 0.5 0.5 |
9.09 ± 0.74 |
7.806 ± 0.97 |
88.39 |
TiO2–SiO2 1![[thin space (1/6-em)]](https://www.rsc.org/images/entities/char_2009.gif) : :![[thin space (1/6-em)]](https://www.rsc.org/images/entities/char_2009.gif) 1 1 |
9.91 ± 0.82 |
— |
71.44 |
TiO2–SiO2 1![[thin space (1/6-em)]](https://www.rsc.org/images/entities/char_2009.gif) : :![[thin space (1/6-em)]](https://www.rsc.org/images/entities/char_2009.gif) 2 2 |
10.48 ± 0.74 |
— |
56.07 |
From the calculations using the Debye–Scherrer equation and Origin85 8.5.1 SR2 software, the crystal size was obtained (Table 2). The crystal size in anatase and rutile was significantly different in the samples. Based on the data, the smallest anatase crystal size was obtained in the 1![[thin space (1/6-em)]](https://www.rsc.org/images/entities/char_2009.gif) :
:![[thin space (1/6-em)]](https://www.rsc.org/images/entities/char_2009.gif) 1 composite. This indicates that the higher the silica concentration in the composite, the larger the crystallite size of anatase, while the rutile size tends to decrease. Fig. 3 shows the trend of crystal size and crystallinity of TiO2 and the composites.
1 composite. This indicates that the higher the silica concentration in the composite, the larger the crystallite size of anatase, while the rutile size tends to decrease. Fig. 3 shows the trend of crystal size and crystallinity of TiO2 and the composites.
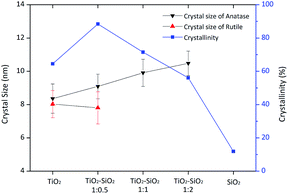 |
| | Fig. 3 Changes in crystal size of anatase and rutile, and variation of crystallinity of the composites. | |
Therefore, based on the data obtained from XRD analysis, it was concluded that the addition of SiO2 in a certain amount increases the crystallinity of TiO2. Furthermore, SiO2 plays a role in inhibiting the transformation from the anatase to the rutile phase.
FTIR characterization results
FTIR analysis was carried out to identify the functional groups in SiO2, synthesized TiO2, and TiO2–SiO2 composites in the wavenumber range of 400–1400 cm−1. Fig. 4 shows the infrared spectra of the samples. In the TiO2–SiO2 nanocomposite spectra, there was signals of siloxane (Si–O–Si) and Ti–O–Ti, which proves that the sample contains both functional groups (Table 3), while Ti–O–Si bonds were evidenced at a wavenumber of 783–803 cm−1.
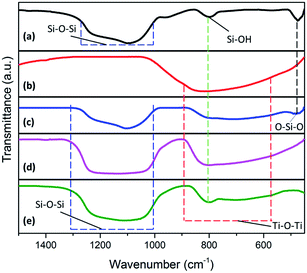 |
| | Fig. 4 Infrared spectra of (a) silica extract; (b) synthesized TiO2; (c) TiO2–SiO2 1![[thin space (1/6-em)]](https://www.rsc.org/images/entities/char_2009.gif) : :![[thin space (1/6-em)]](https://www.rsc.org/images/entities/char_2009.gif) 0.5; (d) TiO2–SiO2 1 0.5; (d) TiO2–SiO2 1![[thin space (1/6-em)]](https://www.rsc.org/images/entities/char_2009.gif) : :![[thin space (1/6-em)]](https://www.rsc.org/images/entities/char_2009.gif) 1; (e) TiO2–SiO2 1 1; (e) TiO2–SiO2 1![[thin space (1/6-em)]](https://www.rsc.org/images/entities/char_2009.gif) : :![[thin space (1/6-em)]](https://www.rsc.org/images/entities/char_2009.gif) 2. 2. | |
Table 3 Types of vibration in the samples based on the peaks that appear at each wavenumber23
| Bond type |
SiO2 |
TiO2 |
TiO2![[thin space (1/6-em)]](https://www.rsc.org/images/entities/char_2009.gif) : :![[thin space (1/6-em)]](https://www.rsc.org/images/entities/char_2009.gif) SiO2 (1 SiO2 (1![[thin space (1/6-em)]](https://www.rsc.org/images/entities/char_2009.gif) : :![[thin space (1/6-em)]](https://www.rsc.org/images/entities/char_2009.gif) 0,5) 0,5) |
TiO2![[thin space (1/6-em)]](https://www.rsc.org/images/entities/char_2009.gif) : :![[thin space (1/6-em)]](https://www.rsc.org/images/entities/char_2009.gif) SiO2 (1 SiO2 (1![[thin space (1/6-em)]](https://www.rsc.org/images/entities/char_2009.gif) : :![[thin space (1/6-em)]](https://www.rsc.org/images/entities/char_2009.gif) 1) 1) |
TiO2![[thin space (1/6-em)]](https://www.rsc.org/images/entities/char_2009.gif) : :![[thin space (1/6-em)]](https://www.rsc.org/images/entities/char_2009.gif) SiO2 (1 SiO2 (1![[thin space (1/6-em)]](https://www.rsc.org/images/entities/char_2009.gif) : :![[thin space (1/6-em)]](https://www.rsc.org/images/entities/char_2009.gif) 2) 2) |
| Si–O–Si |
1091 cm−1 |
— |
1103 cm−1 |
1131 cm−1 |
1111 cm−1 |
| Ti–O–Ti |
— |
667 cm−1 |
723 cm−1 |
751 cm−1 |
739 cm−1 |
| Ti–O–Si |
— |
— |
783 cm−1 |
803 cm−1 |
803 cm−1 |
| Si–OH |
799 cm−1 |
— |
— |
— |
— |
| O–Si–O |
475 cm−1 |
— |
467 cm−1 |
— |
— |
Furthermore, the presence of a Ti–O–Si vibration peak indicates that the interaction between TiO2 and SiO2 is a chemical reaction (chemical bonding occurs), and not a simple physical mixing process. Peaks corresponding to Ti–O–Ti bonds appear at a wavenumber of 723–739 cm−1. Based on FTIR data, the TiO2–SiO2 nanocomposite sample shows the presence of Ti–O–Ti, Si–O–Si, and Ti–O–Si, thereby indicating the presence of bonds from the two metal oxides.
SEM-EDX characterization results
The morphology of the composite samples was studied using SEM, which showed inhomogeneous spherical particles (Fig. 5c–e). However, some particle agglomeration occurred in the various composite samples. In the synthesized TiO2 (Fig. 5b) and the 1![[thin space (1/6-em)]](https://www.rsc.org/images/entities/char_2009.gif) :
:![[thin space (1/6-em)]](https://www.rsc.org/images/entities/char_2009.gif) 2 TiO2–SiO2 composite (Fig. 5e), the agglomeration showed coalescence into quite large particles. Meanwhile, high agglomeration tends to reduce the active site of the photocatalyst. The results showed that the addition of SiO2 reduces the agglomeration of TiO2. Hence, a nanoparticle-sized sample is formed. This is also influenced by SiO2, which complements the size of the TiO2 photocatalyst. However, an extremely high addition of SiO2 causes greater agglomeration due to the interaction between SiO2; hence, it affects the surface area of the active sites in the catalyst.
2 TiO2–SiO2 composite (Fig. 5e), the agglomeration showed coalescence into quite large particles. Meanwhile, high agglomeration tends to reduce the active site of the photocatalyst. The results showed that the addition of SiO2 reduces the agglomeration of TiO2. Hence, a nanoparticle-sized sample is formed. This is also influenced by SiO2, which complements the size of the TiO2 photocatalyst. However, an extremely high addition of SiO2 causes greater agglomeration due to the interaction between SiO2; hence, it affects the surface area of the active sites in the catalyst.
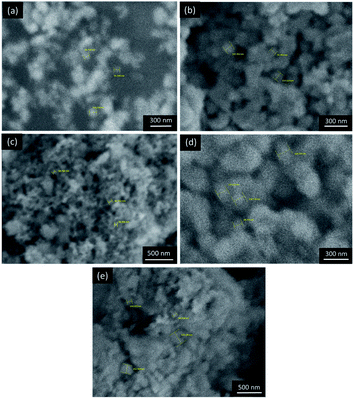 |
| | Fig. 5 SEM images of the samples to determine size distribution: (a) synthesized TiO2, (b) SiO2 extract, (c) TiO2–SiO2 1![[thin space (1/6-em)]](https://www.rsc.org/images/entities/char_2009.gif) : :![[thin space (1/6-em)]](https://www.rsc.org/images/entities/char_2009.gif) 0.5, (d) TiO2–SiO2 1 0.5, (d) TiO2–SiO2 1![[thin space (1/6-em)]](https://www.rsc.org/images/entities/char_2009.gif) : :![[thin space (1/6-em)]](https://www.rsc.org/images/entities/char_2009.gif) 1, (e) TiO2–SiO2 1 1, (e) TiO2–SiO2 1![[thin space (1/6-em)]](https://www.rsc.org/images/entities/char_2009.gif) : :![[thin space (1/6-em)]](https://www.rsc.org/images/entities/char_2009.gif) 2. 2. | |
Based on the SEM imaging results, the size distribution was determined using ImageJ 1.52a software from Fig. 5 (Wayne Rasband, National Institutes of Health).45 The results showed that there was a significant reduction in particle size of the synthesized TiO2 (Fig. 6b) and TiO2–SiO2 1![[thin space (1/6-em)]](https://www.rsc.org/images/entities/char_2009.gif) :
:![[thin space (1/6-em)]](https://www.rsc.org/images/entities/char_2009.gif) 0.5 (Fig. 6d). These results indicate that SiO2 reduces the aggregation of TiO2. However, the addition of SiO2 to the composite causes an increase in particle size due to agglomeration. Based on the results of the particle size distribution, the composite sample was categorized as nano-sized with a dominant size of less than 100 nm.
0.5 (Fig. 6d). These results indicate that SiO2 reduces the aggregation of TiO2. However, the addition of SiO2 to the composite causes an increase in particle size due to agglomeration. Based on the results of the particle size distribution, the composite sample was categorized as nano-sized with a dominant size of less than 100 nm.
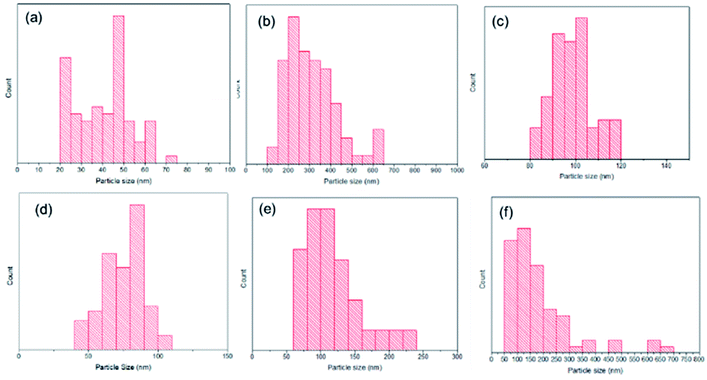 |
| | Fig. 6 Bar chart of sample particle size distribution: (a) TiO2 P25 Degussa44 (8–11 nm), (b) synthesized TiO2 (108–637 nm), (c) SiO2 extract (81–119 nm), (d) TiO2–SiO2 1![[thin space (1/6-em)]](https://www.rsc.org/images/entities/char_2009.gif) : :![[thin space (1/6-em)]](https://www.rsc.org/images/entities/char_2009.gif) 0.5 (40–107 nm), (e) TiO2–SiO2 1 0.5 (40–107 nm), (e) TiO2–SiO2 1![[thin space (1/6-em)]](https://www.rsc.org/images/entities/char_2009.gif) : :![[thin space (1/6-em)]](https://www.rsc.org/images/entities/char_2009.gif) 1 (61–219 nm), (f) TiO2–SiO2 1 1 (61–219 nm), (f) TiO2–SiO2 1![[thin space (1/6-em)]](https://www.rsc.org/images/entities/char_2009.gif) : :![[thin space (1/6-em)]](https://www.rsc.org/images/entities/char_2009.gif) 2 (73–698 nm). 2 (73–698 nm). | |
Furthermore, EDX qualitative analysis was carried out to determine the composition of the samples. This analysis is based on the X-ray radiation emitted from the atoms in a sample. Table 4 shows the EDX analysis results of extracted SiO2, synthesized TiO2, and TiO2–SiO2 composites with mole ratios of 1![[thin space (1/6-em)]](https://www.rsc.org/images/entities/char_2009.gif) :
:![[thin space (1/6-em)]](https://www.rsc.org/images/entities/char_2009.gif) 0.5; 1
0.5; 1![[thin space (1/6-em)]](https://www.rsc.org/images/entities/char_2009.gif) :
:![[thin space (1/6-em)]](https://www.rsc.org/images/entities/char_2009.gif) 1; and 1
1; and 1![[thin space (1/6-em)]](https://www.rsc.org/images/entities/char_2009.gif) :
:![[thin space (1/6-em)]](https://www.rsc.org/images/entities/char_2009.gif) 2. Based on the results, the percentage of Si atoms increases with the amount of silica being composited.
2. Based on the results, the percentage of Si atoms increases with the amount of silica being composited.
Table 4 Percentage of atoms in the sample from the EDX analysis
| (%) |
Sample |
| TiO2 |
SiO2 |
TiO2–SiO2 1![[thin space (1/6-em)]](https://www.rsc.org/images/entities/char_2009.gif) : :![[thin space (1/6-em)]](https://www.rsc.org/images/entities/char_2009.gif) 0.5 0.5 |
TiO2–SiO2 1![[thin space (1/6-em)]](https://www.rsc.org/images/entities/char_2009.gif) : :![[thin space (1/6-em)]](https://www.rsc.org/images/entities/char_2009.gif) 1 1 |
TiO2–SiO2 1![[thin space (1/6-em)]](https://www.rsc.org/images/entities/char_2009.gif) : :![[thin space (1/6-em)]](https://www.rsc.org/images/entities/char_2009.gif) 2 2 |
| O |
Ti |
Si |
O |
Ti |
O |
Si |
Ti |
O |
Si |
Ti |
O |
Si |
| Weight |
33.44 |
66.56 |
47.07 |
52.93 |
40.38 |
47.66 |
11.96 |
36.75 |
49.94 |
13.31 |
34.84 |
48.21 |
16.96 |
| Atomic |
60.07 |
39.93 |
33.62 |
66.38 |
19.84 |
70.13 |
10.03 |
17.59 |
71.55 |
10.86 |
16.75 |
69.36 |
13.89 |
Photocatalytic antibacterial activity test results
The antibacterial activity of the samples was evaluated qualitatively and quantitatively using dilution and optical density methods, respectively. TiO2–SiO2 nanocomposite sample was tested for photocatalytic activity as an antibacterial agent against Staphylococcus aureus and Pseudomonas aeruginosa compared with the positive control (amoxicillin), negative control (without treatment), synthesized TiO2, P25 Degussa (commercial TiO2), and SiO2 extract.
The photocatalytic test of S. aureus (Gram-positive bacterium) produced excellent results. Based on the antibacterial test using the optical density method, all nanocomposite samples showed antibacterial activity with an inactivation percentage ranging from 97.9 to 98.69% (Fig. 7). Furthermore, the antibacterial test using the dilution method showed perfect inhibition by the positive control and nanocomposite samples. The positive control (amoxicillin) belongs to the class of beta-lactam antimicrobials that bind to penicillin-binding proteins that inhibit transpeptidation, i.e., the cross-linking process in cell wall synthesis, leading to the activation of autolytic enzymes in the bacterial cell wall.46 P25 also showed bacterial inhibition, but certain bacteria were still growing. Meanwhile, the synthesized SiO2 and TiO2 showed low antibacterial activity.
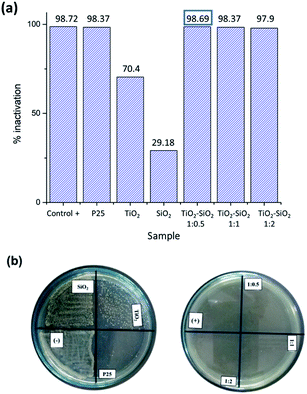 |
| | Fig. 7 Photocatalytic activity test results for S. aureus (Gram-positive bacterium): (a) optical density method, (b) dilution method. | |
Furthermore, the photocatalytic test on P. aeruginosa (Gram-negative bacterium) produced excellent results. Based on the antibacterial test using the optical density method, the nanocomposite samples had an inactivation percentage ranging from 88.95 to 97.44% (Fig. 8). Meanwhile, the antibacterial test using the dilution method showed complete inhibition by the positive control, TiO2 P25 Degussa, as well as TiO2–SiO2 nanocomposites 1![[thin space (1/6-em)]](https://www.rsc.org/images/entities/char_2009.gif) :
:![[thin space (1/6-em)]](https://www.rsc.org/images/entities/char_2009.gif) 0.5 and 1
0.5 and 1![[thin space (1/6-em)]](https://www.rsc.org/images/entities/char_2009.gif) :
:![[thin space (1/6-em)]](https://www.rsc.org/images/entities/char_2009.gif) 1. TiO2–SiO2 nanocomposite 1
1. TiO2–SiO2 nanocomposite 1![[thin space (1/6-em)]](https://www.rsc.org/images/entities/char_2009.gif) :
:![[thin space (1/6-em)]](https://www.rsc.org/images/entities/char_2009.gif) 2 showed the presence of bacterial growth on the media, while TiO2 P25 Degussa showed inhibition, but certain bacteria were still growing according to the dilution method (Fig. 8). P25 Degussa was used as a control for commercial TiO2 nanoparticles which have been shown to have photocatalytic activity.8 Although not significant, the 1
2 showed the presence of bacterial growth on the media, while TiO2 P25 Degussa showed inhibition, but certain bacteria were still growing according to the dilution method (Fig. 8). P25 Degussa was used as a control for commercial TiO2 nanoparticles which have been shown to have photocatalytic activity.8 Although not significant, the 1![[thin space (1/6-em)]](https://www.rsc.org/images/entities/char_2009.gif) :
:![[thin space (1/6-em)]](https://www.rsc.org/images/entities/char_2009.gif) 0.5 nanocomposite sample had a better level of bacterial activation compared to P25 Degussa. Moreover, the synthesized SiO2 and TiO2 extracts showed poor inhibition but still had antibacterial activity. Therefore, for both bacteria, the synthesized samples showed a relatively good inactivation percentage due to the dominant anatase structure which increases photocatalytic activity compared to previous studies.
0.5 nanocomposite sample had a better level of bacterial activation compared to P25 Degussa. Moreover, the synthesized SiO2 and TiO2 extracts showed poor inhibition but still had antibacterial activity. Therefore, for both bacteria, the synthesized samples showed a relatively good inactivation percentage due to the dominant anatase structure which increases photocatalytic activity compared to previous studies.
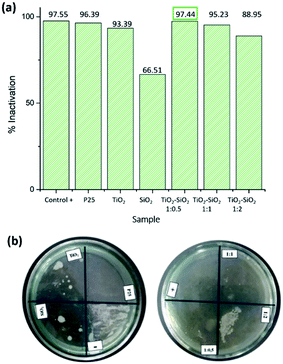 |
| | Fig. 8 Photocatalytic activity test results for P. aeruginosa (Gram-negative bacterium): (a) optical density method, (b) dilution method. | |
Fig. 9 shows the difference in bacterial inactivation percentage with and without irradiation. These results indicate that the nanocomposite has significantly poor antibacterial activity in the no-irradiation condition. Meanwhile, SiO2 still has antibacterial activity, given that it is not a photocatalyst material.47
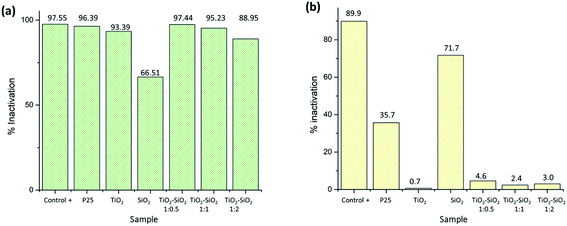 |
| | Fig. 9 Bacterial inactivation percentage against Pseudomonas aeruginosa (a) with and (b) without irradiation. | |
In the antibacterial test, the best photocatalytic results were shown by the TiO2–SiO2 1![[thin space (1/6-em)]](https://www.rsc.org/images/entities/char_2009.gif) :
:![[thin space (1/6-em)]](https://www.rsc.org/images/entities/char_2009.gif) 0.5 nanocomposite using optical density and dilution methods. This composite showed better results than separated TiO2, indicating that the addition of SiO2 increased the antibacterial activity of the sample. The role of the addition of SiO2 is described in Scheme 1. The mechanism of SiO2 as a photocatalyst supporting material has been described by Bahadur et al. (2019)48 where the excited electrons move from the TiO2 surface to the SiO2 surface as electron storage thereby increasing photo-generation for the photocatalyst process. The nanocomposite activity was influenced by the crystal phase, crystallinity, and particle size. These three aspects are presumably related to the ROS generated from the photocatalysis of the nanocomposite. The greater the amount of ROS produced, the better the photocatalytic activity in inactivating bacteria.13,14 However, an extremely high addition of SiO2 caused a decrease in activity due to agglomeration.
0.5 nanocomposite using optical density and dilution methods. This composite showed better results than separated TiO2, indicating that the addition of SiO2 increased the antibacterial activity of the sample. The role of the addition of SiO2 is described in Scheme 1. The mechanism of SiO2 as a photocatalyst supporting material has been described by Bahadur et al. (2019)48 where the excited electrons move from the TiO2 surface to the SiO2 surface as electron storage thereby increasing photo-generation for the photocatalyst process. The nanocomposite activity was influenced by the crystal phase, crystallinity, and particle size. These three aspects are presumably related to the ROS generated from the photocatalysis of the nanocomposite. The greater the amount of ROS produced, the better the photocatalytic activity in inactivating bacteria.13,14 However, an extremely high addition of SiO2 caused a decrease in activity due to agglomeration.
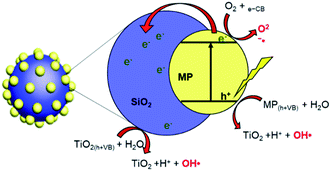 |
| | Scheme 1 The role of SiO2 in TiO2 photocatalyst performance.48 | |
The test shows that SiO2 has antibacterial activity because it is already of a nanoparticle size. Nano-SiO2 interacts with living cells such as bacteria and interferes with cell functions such as cell differentiation, adhesion, and spread.47
Furthermore, the antimicrobial activity of SiO2 was more significant at the nanoscale size due to the increased surface area.49 However, SiO2 showed poor antibacterial activity against S. aureus. The antibacterial activity in this study is in accordance with Erdural et al. (2014),30 who used SiO2 from synthetic chemicals; hence, this study shows that the use of SiO2 from natural materials is effective in inactivating bacteria.
Experimental
Materials
The materials used consisted of distilled water, amoxicillin (Hexpharm), 70% ethanol (Sigma-Aldrich), Staphylococcus aureus (ATCC No. 35696), Pseudomonas aeruginosa (ATCC No. 27317), absolute ethanol (C2H5OH, 100%, Merck), silica extract from beach sand (Bengkulu, Indonesia), isopropyl alcohol (99%, Sigma-Aldrich), yeast nitrogen base media (MD 21152, Difco), titanium dioxide (TiO2, P25 Degussa, Merck), and TTIP (97%, Sigma-Aldrich). All materials were used without prior treatment.
Synthesis of TiO2 nanocomposite
The sonochemistry synthesis method was used according to Rosales et al. (2018),50 while the synthesized TiO2 was compared with the uncomposited samples. The synthesis was carried out by preparing TTIP and adding isopropyl alcohol dropwise. Furthermore, the titanium dioxide sol was sonicated and distilled water was added for 20 minutes. The solution was centrifuged at 6000 rpm, while the formed TiO2 was dried for 2 hours and calcined at 500 °C for 5 hours.
Synthesis of TiO2–SiO2 nanocomposite
The synthesis method used was sonochemistry in line with Rosales et al. (2018).50 The TiO2–SiO2 nanocomposite was synthesized by preparing TTIP and adding isopropyl alcohol dropwise; meanwhile, the silica used was extracted from beach sand based on Ishmah et al. (2019).31 The extracted silica powder was ground with a PM 100 ball mill (Retsch), while the prepared solution consisting of distilled water and absolute ethyl alcohol was stirred sonochemically in a 900 W sonicator (BEM-900A, Bueno Biotech). Furthermore, this solution was mixed with silica and also stirred, while the titanium and silicon dioxide sols were also mixed in the sonicator. Subsequently, distilled water was added and stirred continuously in a sonicator for 20 minutes. The solution was centrifuged at 6000 rpm, while the formed TiO2–SiO2 nanocomposite was dried and calcined at 500 °C for 5 hours. This procedure was carried out for TiO2–SiO2 nanocomposite with various mole ratios of 1![[thin space (1/6-em)]](https://www.rsc.org/images/entities/char_2009.gif) :
:![[thin space (1/6-em)]](https://www.rsc.org/images/entities/char_2009.gif) 0.5, 1
0.5, 1![[thin space (1/6-em)]](https://www.rsc.org/images/entities/char_2009.gif) :
:![[thin space (1/6-em)]](https://www.rsc.org/images/entities/char_2009.gif) 1, and 1
1, and 1![[thin space (1/6-em)]](https://www.rsc.org/images/entities/char_2009.gif) :
:![[thin space (1/6-em)]](https://www.rsc.org/images/entities/char_2009.gif) 2.
2.
Sample characterization
X-ray diffraction (XRD) analysis was performed to identify the extracted silica crystal lattice and the synthesized TiO2–SiO2 nanocomposite. Both components were analyzed by XRD (Rigaku/MiniFlex 600), with measurements carried out at room temperature using Cu Kα radiation at an angle of 2θ from 20° to 80°. Furthermore, the crystal structure was refined using the Rietveld method with HighScore Plus software (PANalytical 3.0.5), while the crystal size was determined using the Debye–Scherrer eqn (8):| |
 | (8) |
with D being the crystal size, K the Scherrer constant (0.89), λ the wavelength of X-ray radiation (0.154 nm), B the value of FWHM (full width at half maximum) of the peak (radians), and θ the angle of diffraction (radians). The crystallinity of the sample is calculated using Origin85 8.5.1 SR2 software to be able to calculate the area of the crystalline phase as well as the area of the amorphous phase. Percent crystallinity is determined by eqn (9):| |
 | (9) |
Then, SEM-EDS (scanning electron microscopy-energy dispersive X-ray spectrometry) analysis was conducted with a Hitachi SU 3500 using 5 kV at a magnification of 10![[thin space (1/6-em)]](https://www.rsc.org/images/entities/char_2009.gif) 000×. Analysis was performed to determine the morphological shape of the surface and composition of the sample. Photocatalysts of TiO2–SiO2 nanocomposite were further characterized using FTIR (Fourier-transform infrared spectroscopy), with a PerkinElmer Spectrum 100 (Massachusetts, USA) to determine the functional groups of silica extract as well as TiO2–SiO2 nanocomposites. FTIR was used with a scanning range of 400–1400 cm−1. This analysis is done by mixing samples that had been finely eroded with dry KBr powder. This mixing was done in agate.
000×. Analysis was performed to determine the morphological shape of the surface and composition of the sample. Photocatalysts of TiO2–SiO2 nanocomposite were further characterized using FTIR (Fourier-transform infrared spectroscopy), with a PerkinElmer Spectrum 100 (Massachusetts, USA) to determine the functional groups of silica extract as well as TiO2–SiO2 nanocomposites. FTIR was used with a scanning range of 400–1400 cm−1. This analysis is done by mixing samples that had been finely eroded with dry KBr powder. This mixing was done in agate.
Antibacterial activity test
(a) Dilution method. Antibacterial testing in this study was done using the modified dilution method.51 The bacteria Staphylococcus aureus and Pseudomonas aeruginosa were taken using a micropipet into sterile test tubes that contained samples. Sample types include positive control (amoxicillin), negative control (no treatment), synthesized TiO2, P25 Degussa (commercial TiO2), SiO2 extract, and various TiO2–SiO2 nanocomposites (1![[thin space (1/6-em)]](https://www.rsc.org/images/entities/char_2009.gif) :
:![[thin space (1/6-em)]](https://www.rsc.org/images/entities/char_2009.gif) 0.5; 1
0.5; 1![[thin space (1/6-em)]](https://www.rsc.org/images/entities/char_2009.gif) :
:![[thin space (1/6-em)]](https://www.rsc.org/images/entities/char_2009.gif) 1; 1
1; 1![[thin space (1/6-em)]](https://www.rsc.org/images/entities/char_2009.gif) :
:![[thin space (1/6-em)]](https://www.rsc.org/images/entities/char_2009.gif) 2). The sample was illuminated with a mercury lamp (HPL-N 125 W Philips) at a distance of 30 cm for 2 hours with stirring. A Petri dish containing media was divided into 4 quadrants. Next, the sample was flattened on a medium surface to each quadrant on the Petri dish. The sample was incubated for 12 hours.
2). The sample was illuminated with a mercury lamp (HPL-N 125 W Philips) at a distance of 30 cm for 2 hours with stirring. A Petri dish containing media was divided into 4 quadrants. Next, the sample was flattened on a medium surface to each quadrant on the Petri dish. The sample was incubated for 12 hours.
(b) Optical density method. The optical density method was performed to determine the inactivation of bacteria quantitatively. This method refers to the modified Khashan et al. (2016) research method.52 The bacteria Staphylococcus aureus and Pseudomonas aeruginosa were taken using a micro-pipet of 1 mL into a sterile test tube that contained 30 mg of the sample. Sample types include positive control (amoxicillin), negative control (without treatment), synthesized TiO2, P25 Degussa (commercial TiO2), SiO2 extract, and various TiO2–SiO2 nanocomposites (1![[thin space (1/6-em)]](https://www.rsc.org/images/entities/char_2009.gif) :
:![[thin space (1/6-em)]](https://www.rsc.org/images/entities/char_2009.gif) 0.5; 1
0.5; 1![[thin space (1/6-em)]](https://www.rsc.org/images/entities/char_2009.gif) :
:![[thin space (1/6-em)]](https://www.rsc.org/images/entities/char_2009.gif) 1; 1
1; 1![[thin space (1/6-em)]](https://www.rsc.org/images/entities/char_2009.gif) :
:![[thin space (1/6-em)]](https://www.rsc.org/images/entities/char_2009.gif) 2). The sample was illuminated with a mercury lamp (HPL-N 125 W Philips) at a distance of 30 cm for 2 hours with stirring. The sample was incubated for 12 hours. Then, the absorbance value of the sample was measured at a wavelength of 600 nm using a UV-visible spectrophotometer. The percentage of bacterial inactivation is calculated by comparing the absorbance of the sample with the absorbance of the negative control, represented by eqn (10):
2). The sample was illuminated with a mercury lamp (HPL-N 125 W Philips) at a distance of 30 cm for 2 hours with stirring. The sample was incubated for 12 hours. Then, the absorbance value of the sample was measured at a wavelength of 600 nm using a UV-visible spectrophotometer. The percentage of bacterial inactivation is calculated by comparing the absorbance of the sample with the absorbance of the negative control, represented by eqn (10):| |
 | (10) |
Conclusions
The antibacterial activity test against Gram-positive Staphylococcus aureus and Gram-negative Pseudomonas aeruginosa shows that TiO2–SiO2 nanocomposite has a better inactivation activity than TiO2. The addition of natural silica to the TiO2 photocatalyst affects the crystallinity percentage, crystal size, and particle size. Furthermore, there was an increase in the crystallinity percentage of TiO2–SiO2 nanocomposites. TiO2–SiO2 nanocomposite with a ratio of 1![[thin space (1/6-em)]](https://www.rsc.org/images/entities/char_2009.gif) :
:![[thin space (1/6-em)]](https://www.rsc.org/images/entities/char_2009.gif) 0.5 shows the best antibacterial activity with inactivation percentages of S. aureus and P. aeruginosa of 98.60% and 97.44%, respectively. Based on the results, the addition of SiO2 increases the photocatalytic activity of TiO2 as an antibacterial agent. The results of this study provide an alternative antibacterial agent produced by using environmentally friendly natural materials.
0.5 shows the best antibacterial activity with inactivation percentages of S. aureus and P. aeruginosa of 98.60% and 97.44%, respectively. Based on the results, the addition of SiO2 increases the photocatalytic activity of TiO2 as an antibacterial agent. The results of this study provide an alternative antibacterial agent produced by using environmentally friendly natural materials.
Author contributions
Conceptualization, D. R. E. and M. L. F.; methodology, A. L.; software, M. D. P. and A. L.; validation, D. R. E., M. L. F. and I. R.; formal analysis, A. L.; investigation, A. L.; resources, A. L.; data curation, A. L.; writing original draft preparation, A. L.; writing review and editing, Y. D., D. R. E., M. L. F. and M. D. P.; visualization, M. D. P.; supervision, D. R. E., Y. D. and M. L. F.; project administration, D. R. E.; funding acquisition, D. R. E. and I. R. All authors have read and agreed to the published version of the manuscript.
Conflicts of interest
There are no conflicts to declare.
Acknowledgements
Authors are grateful for the facilities from Universitas Padjadjaran, Indonesia by Academic Leadership Grant (ALG) Prof. Iman Rahayu (ID: 1959/UN6.3.1/PT.00/2021), Indonesian Ministry of Research by Penelitian Dasar Unggulan Perguruan Tinggi (PDUPT ID: 1207/UN6.3.1/PT.00/2021), and World Class Professor (WCP) 2021 grant.
References
- M. Vouga and P. Greub, Clin. Microbiol. Infect., 2015, 22(1), 12–21 CrossRef PubMed.
- K. W. Post, Overview of Bacteria, 2019 Search PubMed.
- Y. Li, J. H. Zhang, S. P. Hu, L. Wang and J. Q. Xin, J. Mol. Catal. A: Chem., 2007, 261, 131–138 CrossRef.
- R. T. Sadikot, T. S. Blackwell, J. W. Christman and A. S. Prince, Am. J. Respir. Crit. Care Med., 2005, 171, 1209–1223 CrossRef PubMed.
- M. Karambin and M. Zarkesh, Iran. J. Pediatr., 2011, 21, 83 Search PubMed.
- D. Cheng, H. Sun, J. Xu and S. Gao, Vet. Microbiol., 2006, 115, 320–328 CrossRef CAS PubMed.
- S. J. Thiele-Bruhn, J. Plant Nutr. Soil Sci., 2003, 166, 145–167 CrossRef CAS.
- Y. N. Slavin, J. Asnis, U. O. Häfeli and H. Bach, J. Nanobiotechnol., 2017, 15, 1–20 CrossRef PubMed.
- M. J. Hajipour, K. M. Fromm, A. A. Akbar, d. A. Jimenez, D. Larramendi, I. R. de, T. Rojo, V. Serpooshan, W. J. Parak and M. Mahmoudi, Trends Biotechnol., 2012, 30, 499–511 CrossRef CAS PubMed.
- Y. Bena, C. Fua, M. Hua, L. Liua, M. H. Wong and C. Zheng, Enviromental Res., 2019, 169, 483–493 CrossRef PubMed.
- Effendy, Logam, Aloi, Semikonduktor, dan Superkonduktor, Bayumedia Publishing, 2010 Search PubMed.
- M. B. Ahmed, J. L. Zhou, H. H. Ngo, W. Guo, N. S. Thomaidis and J. Xu, Hazard. Mater., 2017, 323, 274–298 CrossRef CAS PubMed.
- S. L. Percival, P. G. Bowler and D. J. Russell, Hosp. Infect., 2005, 60, 1–7 CrossRef CAS PubMed.
- K. H. Cho, J. E. Park, T. Osaka and S. G. Park, Electrochim. Acta, 2005, 51, 956–960 CrossRef CAS.
- M. S. Nasrollahzadeh, M. Hadavifar and S. S. Ghasemi, Appl. Water Sci., 2018, 8, 104 CrossRef.
- I. Khan, K. Saeed and I. Khan, Arabian J. Chem., 2019, 12, 908–931 CrossRef CAS.
- Y. Xia, Nat. Mater., 2008, 7, 758–760 CrossRef CAS PubMed.
- P. I. Dolez, Nanomaterials Definitions, Classifications, and Applications. Nanoengineering: Global Approaches to Health and Safety Issues, 2015 Search PubMed.
- S. Leong, A. Razmjou, K. Wang, K. Hapgood, X. Zhang and H. J. Wang, J. Membr. Sci., 2014, 472, 167–184 CrossRef CAS.
- M. Besançon, L. Michelin, L. Josien, L. Vidal, K. Assaker, M. Bonne, B. Lebeau and J. L. Blin, New J. Chem., 2016, 40, 4386–4397 RSC.
- Y. H. Tsuang, S. Jui-Sheng, H. Yu-Chen, L. Chung-Hsin, H. C. Walter and W. Chien-Che, Artif. Organs, 2008, 32, 167–174 CrossRef CAS PubMed.
- R. Sellapan, Mechanisms of Enhanced Activity of Model TiO2/Carbon and TiO2/Metal Nanocomposite Photocatalysts, Chalmers University, 2013 Search PubMed.
- D. R. Eddy, S. N. Ishmah, M. D. Permana, M. L. Firdaus, 2020.
- L. Wu, H. Yan, J. Xiao, X. Li and X. Wang, Ceram. Int., 2017, 43, 9377–9381 CrossRef CAS.
- L. Pinho and M. J. Mosquera, Appl. Catal., B, 2013, 134–135, 205–221 CrossRef CAS.
- J. Tian, L. Chen, Y. Yin, X. Wang, J. Dai, Z. Zhu, X. Liu and P. Wu, Surf. Coat. Technol., 2009, 204, 205–214 CrossRef CAS.
- N. Davari, M. Farhadian, A. R. S. Nazar and M. J. Homayoonfal, J. Environ. Chem. Eng., 2017, 5, 5707–5720 CrossRef CAS.
- H. Koohestani and S. K. Sadrnezhaad, Water Treat, 2016, 57, 22029–22038 CrossRef CAS.
- H. Ijadpanah-Saravi, M. Zolfaghari, A. Khodadadi and P. Drogui, Desalin. Water Treat., 2016, 57, 14647–14655 CrossRef CAS.
- B. Erdural, U. Bolukbasi and G. J. Karakas, J. Photochem. Photobiol., A, 2014, 283, 29–37 CrossRef CAS.
- S. N. Ishmah, M. D. Permana, M. L. Firdaus and D. R. Eddy, J. Sci. Educ. Technol., 2020, 4, 1–5 Search PubMed.
- Kementrian Energi dan Sumber Daya Mineral Pusat Sumber Daya Geologi, Neraca Sumber Daya Mineral Non Logam di Indonesia, Laporan Tahunan Badan Geologi, ed. E. B. Lelono, 2012 Search PubMed.
- M. Yaseen, Z. Shah, R. C. Veses, S. L. P. Dias, E. C. Lima, R. Sdos Glaydson, J. C. P. Vaghetti, W. S. D. Alencar and K. J. Mehmood, J. Anal. Bioanal. Tech., 2017, 08, 8–11 Search PubMed.
- C. Y. Teh, T. Y. Wu and J. C. Juan, Chem. Eng. J., 2017, 317, 586–612 CrossRef CAS.
- P. Chaudhari, V. Chaudhari and S. Mishra, Indonesian geological agency annual report, 2016, 19, pp. 446–450 Search PubMed.
- H. Xu, B. W. Zeiger and K. S. Suslick, Chem. Soc. Rev., 2013, 42, 2555–2567 RSC.
- F. Liu, S. H. Garofalini, D. King-Smith and D. Vanderbilt, Phys. Rev. B, 1994, 49, 12528 CrossRef CAS PubMed.
- Z. B. M. G. Jian, Chin. J. High Pressure Phys., 2006, 20, 211–216 Search PubMed.
- S. Murugesan, P. Kuppusami and E. Mohandas, Mater. Res. Bull., 2010, 45, 6–9 CrossRef CAS.
- W. Zhang, A. Weidenkaff and R. Armin, Mater. Lett., 2001, 3429 Search PubMed.
- H. A. Kiwaan, T. M. Atwee, E. A. Azab and A. A. J. El-bindary, Mol. Struct., 2020, 1200, 127115 CrossRef CAS.
- B. H. Toby, Powder Diffr., 2006, 21, 67–70 CrossRef CAS.
- A. Habibi-Yangjeh, S. Asadzadeh-Khaneghah, S. Feizpoor and A. J. Rouhi, Colloids Interface Sci., 2020, 580, 503–514 CrossRef CAS PubMed.
- H. Zheng, H. Svengren, Z. Huang, Z. Yang, X. Zou and M. Johnsson, J. Phys. Chem. Solids, 2019, 130, 180–188 CrossRef.
- I. Kustiningsih, S. Slamet and W. W. Purwanto, Reaktor, 2015, 15, 205–212 CrossRef.
- M. D. Abràmoff, P. J. Magalhães and S. J. Ram, Biophotonics Int., 2004, 11, 36–42 Search PubMed.
- D. J. Weber, N. E. Tolkoff-Rubin and R. H. Rubin, Pharmacotherapy, 1984, 4, 122–136 CrossRef CAS PubMed.
- S. M. Dizaj, F. Lotfipour, M. Barzegar-Jalali, M. H. Zarrintan and K. Adibkia, Mater. Sci. Eng., C, 2014, 44, 278–284 CrossRef CAS PubMed.
- N. M. Bahadur, F. Chowdhury, M. Obaidullah, M. S. Hossain, R. Rashid, Y. Akter, T. Furusawa, M. Sato and N. J. Suzuki, Nanomater, 2019, 1–11 Search PubMed.
- V. Dhapte, S. Kadam, V. Pokharkar, P. K. Khanna and V. Dhapte, ISRN Inorg. Chem., 2014, 1–8 Search PubMed.
- A. Rosales, A. Maury-Ramírez, R. M. Gutiérrez, D. C. Guzmán and K. Esquivel, Coatings, 2018, 8, 1–13 CrossRef.
- K. S. Khashan, G. M. Sulaiman and F. A. Abdulameer, Arabian J. Sci. Eng., 2016, 41, 301–310 CrossRef CAS.
Footnote |
| † Electronic supplementary information (ESI) available: Goodness of fit (GoF) equation and the Rietveld refinement plot for XRD analysis. See DOI: 10.1039/d1ra07043f |
|
| This journal is © The Royal Society of Chemistry 2021 |
Click here to see how this site uses Cookies. View our privacy policy here.  Open Access Article
 a,
Muhamad Diki Permana
 a,
Yusi Deawatia,
M. Lutfi Firdaus
 b,
Iman Rahayua and
Diana Rakhmawaty Eddy
 *a
*a
![[thin space (1/6-em)]](https://www.rsc.org/images/entities/char_2009.gif) :
:![[thin space (1/6-em)]](https://www.rsc.org/images/entities/char_2009.gif) 0.5 TiO2–SiO2 nanocomposite, with inactivation percentages of S. aureus and P. aeruginosa of 98.69% and 97.44%, respectively.
0.5 TiO2–SiO2 nanocomposite, with inactivation percentages of S. aureus and P. aeruginosa of 98.69% and 97.44%, respectively.![[thin space (1/6-em)]](https://www.rsc.org/images/entities/char_2009.gif) :
:![[thin space (1/6-em)]](https://www.rsc.org/images/entities/char_2009.gif) 0.5; 1
0.5; 1![[thin space (1/6-em)]](https://www.rsc.org/images/entities/char_2009.gif) :
:![[thin space (1/6-em)]](https://www.rsc.org/images/entities/char_2009.gif) 1; and 1
1; and 1![[thin space (1/6-em)]](https://www.rsc.org/images/entities/char_2009.gif) :
:![[thin space (1/6-em)]](https://www.rsc.org/images/entities/char_2009.gif) 2 using the sonochemistry method as shown in Fig. 1. Sonochemistry has been widely used to synthesize nano-sized materials.34 To prepare the TiO2–SiO2 nanocomposite, titanium tetraisopropoxide (TTIP) was used as a precursor to form TiO2. TTIP was reacted with isopropyl alcohol thereby causing the hydrolysis and condensation reactions to produce TiO2.35 The reaction mechanism for the formation of TiO2 from TTIP is shown in Fig. 1.
2 using the sonochemistry method as shown in Fig. 1. Sonochemistry has been widely used to synthesize nano-sized materials.34 To prepare the TiO2–SiO2 nanocomposite, titanium tetraisopropoxide (TTIP) was used as a precursor to form TiO2. TTIP was reacted with isopropyl alcohol thereby causing the hydrolysis and condensation reactions to produce TiO2.35 The reaction mechanism for the formation of TiO2 from TTIP is shown in Fig. 1.
![[thin space (1/6-em)]](https://www.rsc.org/images/entities/char_2009.gif) :
:![[thin space (1/6-em)]](https://www.rsc.org/images/entities/char_2009.gif) 0.5; 1
0.5; 1![[thin space (1/6-em)]](https://www.rsc.org/images/entities/char_2009.gif) :
:![[thin space (1/6-em)]](https://www.rsc.org/images/entities/char_2009.gif) 1; and 1
1; and 1![[thin space (1/6-em)]](https://www.rsc.org/images/entities/char_2009.gif) :
:![[thin space (1/6-em)]](https://www.rsc.org/images/entities/char_2009.gif) 2 are shown in Fig. 2.
2 are shown in Fig. 2.

![[thin space (1/6-em)]](https://www.rsc.org/images/entities/char_2009.gif) :
:![[thin space (1/6-em)]](https://www.rsc.org/images/entities/char_2009.gif) 0.5; (c) TiO2–SiO2 1
0.5; (c) TiO2–SiO2 1![[thin space (1/6-em)]](https://www.rsc.org/images/entities/char_2009.gif) :
:![[thin space (1/6-em)]](https://www.rsc.org/images/entities/char_2009.gif) 1; (d) TiO2–SiO2 1
1; (d) TiO2–SiO2 1![[thin space (1/6-em)]](https://www.rsc.org/images/entities/char_2009.gif) :
:![[thin space (1/6-em)]](https://www.rsc.org/images/entities/char_2009.gif) 2.
2.![[thin space (1/6-em)]](https://www.rsc.org/images/entities/char_2009.gif) :
:![[thin space (1/6-em)]](https://www.rsc.org/images/entities/char_2009.gif) 0.5
0.5![[thin space (1/6-em)]](https://www.rsc.org/images/entities/char_2009.gif) :
:![[thin space (1/6-em)]](https://www.rsc.org/images/entities/char_2009.gif) 1
1![[thin space (1/6-em)]](https://www.rsc.org/images/entities/char_2009.gif) :
:![[thin space (1/6-em)]](https://www.rsc.org/images/entities/char_2009.gif) 2
2![[thin space (1/6-em)]](https://www.rsc.org/images/entities/char_2009.gif) :
:![[thin space (1/6-em)]](https://www.rsc.org/images/entities/char_2009.gif) 1 and 1
1 and 1![[thin space (1/6-em)]](https://www.rsc.org/images/entities/char_2009.gif) :
:![[thin space (1/6-em)]](https://www.rsc.org/images/entities/char_2009.gif) 2 composite samples did not have a rutile structure of TiO2. Hence, the presence of SiO2 inhibits the transformation from anatase to rutile. This is in accordance with Besançon et al. (2016).20 Meanwhile, TiO2 with anatase phase is the best for photocatalytic applications.40 However, a small amount of rutile phase is still required in the photocatalysis process.
2 composite samples did not have a rutile structure of TiO2. Hence, the presence of SiO2 inhibits the transformation from anatase to rutile. This is in accordance with Besançon et al. (2016).20 Meanwhile, TiO2 with anatase phase is the best for photocatalytic applications.40 However, a small amount of rutile phase is still required in the photocatalysis process.![[thin space (1/6-em)]](https://www.rsc.org/images/entities/char_2009.gif) :
:![[thin space (1/6-em)]](https://www.rsc.org/images/entities/char_2009.gif) 0.5) when SiO2 was added. However, this increase caused a decrease in the crystallinity percentage of the composite sample. This is because the amorphous structure of SiO2 causes a reduction in crystallinity. High crystallinity is needed in photocatalysis to avoid the possibility of electron–hole recombination, thereby increasing photocatalytic activity.43
0.5) when SiO2 was added. However, this increase caused a decrease in the crystallinity percentage of the composite sample. This is because the amorphous structure of SiO2 causes a reduction in crystallinity. High crystallinity is needed in photocatalysis to avoid the possibility of electron–hole recombination, thereby increasing photocatalytic activity.43![[thin space (1/6-em)]](https://www.rsc.org/images/entities/char_2009.gif) :
:![[thin space (1/6-em)]](https://www.rsc.org/images/entities/char_2009.gif) 0.5
0.5![[thin space (1/6-em)]](https://www.rsc.org/images/entities/char_2009.gif) :
:![[thin space (1/6-em)]](https://www.rsc.org/images/entities/char_2009.gif) 1
1![[thin space (1/6-em)]](https://www.rsc.org/images/entities/char_2009.gif) :
:![[thin space (1/6-em)]](https://www.rsc.org/images/entities/char_2009.gif) 2
2![[thin space (1/6-em)]](https://www.rsc.org/images/entities/char_2009.gif) :
:![[thin space (1/6-em)]](https://www.rsc.org/images/entities/char_2009.gif) 1 composite. This indicates that the higher the silica concentration in the composite, the larger the crystallite size of anatase, while the rutile size tends to decrease. Fig. 3 shows the trend of crystal size and crystallinity of TiO2 and the composites.
1 composite. This indicates that the higher the silica concentration in the composite, the larger the crystallite size of anatase, while the rutile size tends to decrease. Fig. 3 shows the trend of crystal size and crystallinity of TiO2 and the composites.

![[thin space (1/6-em)]](https://www.rsc.org/images/entities/char_2009.gif) :
:![[thin space (1/6-em)]](https://www.rsc.org/images/entities/char_2009.gif) 0.5; (d) TiO2–SiO2 1
0.5; (d) TiO2–SiO2 1![[thin space (1/6-em)]](https://www.rsc.org/images/entities/char_2009.gif) :
:![[thin space (1/6-em)]](https://www.rsc.org/images/entities/char_2009.gif) 1; (e) TiO2–SiO2 1
1; (e) TiO2–SiO2 1![[thin space (1/6-em)]](https://www.rsc.org/images/entities/char_2009.gif) :
:![[thin space (1/6-em)]](https://www.rsc.org/images/entities/char_2009.gif) 2.
2.![[thin space (1/6-em)]](https://www.rsc.org/images/entities/char_2009.gif) :
:![[thin space (1/6-em)]](https://www.rsc.org/images/entities/char_2009.gif) SiO2 (1
SiO2 (1![[thin space (1/6-em)]](https://www.rsc.org/images/entities/char_2009.gif) :
:![[thin space (1/6-em)]](https://www.rsc.org/images/entities/char_2009.gif) 0,5)
0,5)![[thin space (1/6-em)]](https://www.rsc.org/images/entities/char_2009.gif) :
:![[thin space (1/6-em)]](https://www.rsc.org/images/entities/char_2009.gif) SiO2 (1
SiO2 (1![[thin space (1/6-em)]](https://www.rsc.org/images/entities/char_2009.gif) :
:![[thin space (1/6-em)]](https://www.rsc.org/images/entities/char_2009.gif) 1)
1)![[thin space (1/6-em)]](https://www.rsc.org/images/entities/char_2009.gif) :
:![[thin space (1/6-em)]](https://www.rsc.org/images/entities/char_2009.gif) SiO2 (1
SiO2 (1![[thin space (1/6-em)]](https://www.rsc.org/images/entities/char_2009.gif) :
:![[thin space (1/6-em)]](https://www.rsc.org/images/entities/char_2009.gif) 2)
2)![[thin space (1/6-em)]](https://www.rsc.org/images/entities/char_2009.gif) :
:![[thin space (1/6-em)]](https://www.rsc.org/images/entities/char_2009.gif) 2 TiO2–SiO2 composite (Fig. 5e), the agglomeration showed coalescence into quite large particles. Meanwhile, high agglomeration tends to reduce the active site of the photocatalyst. The results showed that the addition of SiO2 reduces the agglomeration of TiO2. Hence, a nanoparticle-sized sample is formed. This is also influenced by SiO2, which complements the size of the TiO2 photocatalyst. However, an extremely high addition of SiO2 causes greater agglomeration due to the interaction between SiO2; hence, it affects the surface area of the active sites in the catalyst.
2 TiO2–SiO2 composite (Fig. 5e), the agglomeration showed coalescence into quite large particles. Meanwhile, high agglomeration tends to reduce the active site of the photocatalyst. The results showed that the addition of SiO2 reduces the agglomeration of TiO2. Hence, a nanoparticle-sized sample is formed. This is also influenced by SiO2, which complements the size of the TiO2 photocatalyst. However, an extremely high addition of SiO2 causes greater agglomeration due to the interaction between SiO2; hence, it affects the surface area of the active sites in the catalyst.

![[thin space (1/6-em)]](https://www.rsc.org/images/entities/char_2009.gif) :
:![[thin space (1/6-em)]](https://www.rsc.org/images/entities/char_2009.gif) 0.5, (d) TiO2–SiO2 1
0.5, (d) TiO2–SiO2 1![[thin space (1/6-em)]](https://www.rsc.org/images/entities/char_2009.gif) :
:![[thin space (1/6-em)]](https://www.rsc.org/images/entities/char_2009.gif) 1, (e) TiO2–SiO2 1
1, (e) TiO2–SiO2 1![[thin space (1/6-em)]](https://www.rsc.org/images/entities/char_2009.gif) :
:![[thin space (1/6-em)]](https://www.rsc.org/images/entities/char_2009.gif) 2.
2.![[thin space (1/6-em)]](https://www.rsc.org/images/entities/char_2009.gif) :
:![[thin space (1/6-em)]](https://www.rsc.org/images/entities/char_2009.gif) 0.5 (Fig. 6d). These results indicate that SiO2 reduces the aggregation of TiO2. However, the addition of SiO2 to the composite causes an increase in particle size due to agglomeration. Based on the results of the particle size distribution, the composite sample was categorized as nano-sized with a dominant size of less than 100 nm.
0.5 (Fig. 6d). These results indicate that SiO2 reduces the aggregation of TiO2. However, the addition of SiO2 to the composite causes an increase in particle size due to agglomeration. Based on the results of the particle size distribution, the composite sample was categorized as nano-sized with a dominant size of less than 100 nm.
![[thin space (1/6-em)]](https://www.rsc.org/images/entities/char_2009.gif) :
:![[thin space (1/6-em)]](https://www.rsc.org/images/entities/char_2009.gif) 0.5 (40–107 nm), (e) TiO2–SiO2 1
0.5 (40–107 nm), (e) TiO2–SiO2 1![[thin space (1/6-em)]](https://www.rsc.org/images/entities/char_2009.gif) :
:![[thin space (1/6-em)]](https://www.rsc.org/images/entities/char_2009.gif) 1 (61–219 nm), (f) TiO2–SiO2 1
1 (61–219 nm), (f) TiO2–SiO2 1![[thin space (1/6-em)]](https://www.rsc.org/images/entities/char_2009.gif) :
:![[thin space (1/6-em)]](https://www.rsc.org/images/entities/char_2009.gif) 2 (73–698 nm).
2 (73–698 nm).![[thin space (1/6-em)]](https://www.rsc.org/images/entities/char_2009.gif) :
:![[thin space (1/6-em)]](https://www.rsc.org/images/entities/char_2009.gif) 0.5; 1
0.5; 1![[thin space (1/6-em)]](https://www.rsc.org/images/entities/char_2009.gif) :
:![[thin space (1/6-em)]](https://www.rsc.org/images/entities/char_2009.gif) 1; and 1
1; and 1![[thin space (1/6-em)]](https://www.rsc.org/images/entities/char_2009.gif) :
:![[thin space (1/6-em)]](https://www.rsc.org/images/entities/char_2009.gif) 2. Based on the results, the percentage of Si atoms increases with the amount of silica being composited.
2. Based on the results, the percentage of Si atoms increases with the amount of silica being composited.![[thin space (1/6-em)]](https://www.rsc.org/images/entities/char_2009.gif) :
:![[thin space (1/6-em)]](https://www.rsc.org/images/entities/char_2009.gif) 0.5
0.5![[thin space (1/6-em)]](https://www.rsc.org/images/entities/char_2009.gif) :
:![[thin space (1/6-em)]](https://www.rsc.org/images/entities/char_2009.gif) 1
1![[thin space (1/6-em)]](https://www.rsc.org/images/entities/char_2009.gif) :
:![[thin space (1/6-em)]](https://www.rsc.org/images/entities/char_2009.gif) 2
2
![[thin space (1/6-em)]](https://www.rsc.org/images/entities/char_2009.gif) :
:![[thin space (1/6-em)]](https://www.rsc.org/images/entities/char_2009.gif) 0.5 and 1
0.5 and 1![[thin space (1/6-em)]](https://www.rsc.org/images/entities/char_2009.gif) :
:![[thin space (1/6-em)]](https://www.rsc.org/images/entities/char_2009.gif) 1. TiO2–SiO2 nanocomposite 1
1. TiO2–SiO2 nanocomposite 1![[thin space (1/6-em)]](https://www.rsc.org/images/entities/char_2009.gif) :
:![[thin space (1/6-em)]](https://www.rsc.org/images/entities/char_2009.gif) 2 showed the presence of bacterial growth on the media, while TiO2 P25 Degussa showed inhibition, but certain bacteria were still growing according to the dilution method (Fig. 8). P25 Degussa was used as a control for commercial TiO2 nanoparticles which have been shown to have photocatalytic activity.8 Although not significant, the 1
2 showed the presence of bacterial growth on the media, while TiO2 P25 Degussa showed inhibition, but certain bacteria were still growing according to the dilution method (Fig. 8). P25 Degussa was used as a control for commercial TiO2 nanoparticles which have been shown to have photocatalytic activity.8 Although not significant, the 1![[thin space (1/6-em)]](https://www.rsc.org/images/entities/char_2009.gif) :
:![[thin space (1/6-em)]](https://www.rsc.org/images/entities/char_2009.gif) 0.5 nanocomposite sample had a better level of bacterial activation compared to P25 Degussa. Moreover, the synthesized SiO2 and TiO2 extracts showed poor inhibition but still had antibacterial activity. Therefore, for both bacteria, the synthesized samples showed a relatively good inactivation percentage due to the dominant anatase structure which increases photocatalytic activity compared to previous studies.
0.5 nanocomposite sample had a better level of bacterial activation compared to P25 Degussa. Moreover, the synthesized SiO2 and TiO2 extracts showed poor inhibition but still had antibacterial activity. Therefore, for both bacteria, the synthesized samples showed a relatively good inactivation percentage due to the dominant anatase structure which increases photocatalytic activity compared to previous studies.

![[thin space (1/6-em)]](https://www.rsc.org/images/entities/char_2009.gif) :
:![[thin space (1/6-em)]](https://www.rsc.org/images/entities/char_2009.gif) 0.5 nanocomposite using optical density and dilution methods. This composite showed better results than separated TiO2, indicating that the addition of SiO2 increased the antibacterial activity of the sample. The role of the addition of SiO2 is described in Scheme 1. The mechanism of SiO2 as a photocatalyst supporting material has been described by Bahadur et al. (2019)48 where the excited electrons move from the TiO2 surface to the SiO2 surface as electron storage thereby increasing photo-generation for the photocatalyst process. The nanocomposite activity was influenced by the crystal phase, crystallinity, and particle size. These three aspects are presumably related to the ROS generated from the photocatalysis of the nanocomposite. The greater the amount of ROS produced, the better the photocatalytic activity in inactivating bacteria.13,14 However, an extremely high addition of SiO2 caused a decrease in activity due to agglomeration.
0.5 nanocomposite using optical density and dilution methods. This composite showed better results than separated TiO2, indicating that the addition of SiO2 increased the antibacterial activity of the sample. The role of the addition of SiO2 is described in Scheme 1. The mechanism of SiO2 as a photocatalyst supporting material has been described by Bahadur et al. (2019)48 where the excited electrons move from the TiO2 surface to the SiO2 surface as electron storage thereby increasing photo-generation for the photocatalyst process. The nanocomposite activity was influenced by the crystal phase, crystallinity, and particle size. These three aspects are presumably related to the ROS generated from the photocatalysis of the nanocomposite. The greater the amount of ROS produced, the better the photocatalytic activity in inactivating bacteria.13,14 However, an extremely high addition of SiO2 caused a decrease in activity due to agglomeration.
![[thin space (1/6-em)]](https://www.rsc.org/images/entities/char_2009.gif) :
:![[thin space (1/6-em)]](https://www.rsc.org/images/entities/char_2009.gif) 0.5, 1
0.5, 1![[thin space (1/6-em)]](https://www.rsc.org/images/entities/char_2009.gif) :
:![[thin space (1/6-em)]](https://www.rsc.org/images/entities/char_2009.gif) 1, and 1
1, and 1![[thin space (1/6-em)]](https://www.rsc.org/images/entities/char_2009.gif) :
:![[thin space (1/6-em)]](https://www.rsc.org/images/entities/char_2009.gif) 2.
2.


![[thin space (1/6-em)]](https://www.rsc.org/images/entities/char_2009.gif) 000×. Analysis was performed to determine the morphological shape of the surface and composition of the sample. Photocatalysts of TiO2–SiO2 nanocomposite were further characterized using FTIR (Fourier-transform infrared spectroscopy), with a PerkinElmer Spectrum 100 (Massachusetts, USA) to determine the functional groups of silica extract as well as TiO2–SiO2 nanocomposites. FTIR was used with a scanning range of 400–1400 cm−1. This analysis is done by mixing samples that had been finely eroded with dry KBr powder. This mixing was done in agate.
000×. Analysis was performed to determine the morphological shape of the surface and composition of the sample. Photocatalysts of TiO2–SiO2 nanocomposite were further characterized using FTIR (Fourier-transform infrared spectroscopy), with a PerkinElmer Spectrum 100 (Massachusetts, USA) to determine the functional groups of silica extract as well as TiO2–SiO2 nanocomposites. FTIR was used with a scanning range of 400–1400 cm−1. This analysis is done by mixing samples that had been finely eroded with dry KBr powder. This mixing was done in agate.![[thin space (1/6-em)]](https://www.rsc.org/images/entities/char_2009.gif) :
:![[thin space (1/6-em)]](https://www.rsc.org/images/entities/char_2009.gif) 0.5; 1
0.5; 1![[thin space (1/6-em)]](https://www.rsc.org/images/entities/char_2009.gif) :
:![[thin space (1/6-em)]](https://www.rsc.org/images/entities/char_2009.gif) 1; 1
1; 1![[thin space (1/6-em)]](https://www.rsc.org/images/entities/char_2009.gif) :
:![[thin space (1/6-em)]](https://www.rsc.org/images/entities/char_2009.gif) 2). The sample was illuminated with a mercury lamp (HPL-N 125 W Philips) at a distance of 30 cm for 2 hours with stirring. A Petri dish containing media was divided into 4 quadrants. Next, the sample was flattened on a medium surface to each quadrant on the Petri dish. The sample was incubated for 12 hours.
2). The sample was illuminated with a mercury lamp (HPL-N 125 W Philips) at a distance of 30 cm for 2 hours with stirring. A Petri dish containing media was divided into 4 quadrants. Next, the sample was flattened on a medium surface to each quadrant on the Petri dish. The sample was incubated for 12 hours.![[thin space (1/6-em)]](https://www.rsc.org/images/entities/char_2009.gif) :
:![[thin space (1/6-em)]](https://www.rsc.org/images/entities/char_2009.gif) 0.5; 1
0.5; 1![[thin space (1/6-em)]](https://www.rsc.org/images/entities/char_2009.gif) :
:![[thin space (1/6-em)]](https://www.rsc.org/images/entities/char_2009.gif) 1; 1
1; 1![[thin space (1/6-em)]](https://www.rsc.org/images/entities/char_2009.gif) :
:![[thin space (1/6-em)]](https://www.rsc.org/images/entities/char_2009.gif) 2). The sample was illuminated with a mercury lamp (HPL-N 125 W Philips) at a distance of 30 cm for 2 hours with stirring. The sample was incubated for 12 hours. Then, the absorbance value of the sample was measured at a wavelength of 600 nm using a UV-visible spectrophotometer. The percentage of bacterial inactivation is calculated by comparing the absorbance of the sample with the absorbance of the negative control, represented by eqn (10):
2). The sample was illuminated with a mercury lamp (HPL-N 125 W Philips) at a distance of 30 cm for 2 hours with stirring. The sample was incubated for 12 hours. Then, the absorbance value of the sample was measured at a wavelength of 600 nm using a UV-visible spectrophotometer. The percentage of bacterial inactivation is calculated by comparing the absorbance of the sample with the absorbance of the negative control, represented by eqn (10):
![[thin space (1/6-em)]](https://www.rsc.org/images/entities/char_2009.gif) :
:![[thin space (1/6-em)]](https://www.rsc.org/images/entities/char_2009.gif) 0.5 shows the best antibacterial activity with inactivation percentages of S. aureus and P. aeruginosa of 98.60% and 97.44%, respectively. Based on the results, the addition of SiO2 increases the photocatalytic activity of TiO2 as an antibacterial agent. The results of this study provide an alternative antibacterial agent produced by using environmentally friendly natural materials.
0.5 shows the best antibacterial activity with inactivation percentages of S. aureus and P. aeruginosa of 98.60% and 97.44%, respectively. Based on the results, the addition of SiO2 increases the photocatalytic activity of TiO2 as an antibacterial agent. The results of this study provide an alternative antibacterial agent produced by using environmentally friendly natural materials.

