 Open Access Article
Ratiometric fluorescence assay based on carbon dots and Cu2+-catalyzed oxidation of O-phenylenediamine for the effective detection of deferasirox†
Chen-Fang Miao‡
a,
Xian-Zhong Guo‡*b,
Xin-Tian Zhanga,
Yin-Ning Lina,
Wen-Di Hanb,
Zheng-Jun Huanga and
Shao-Huang Weng *a
*a
aDepartment of Pharmaceutical Analysis, School of Pharmacy, Fujian Medical University, Fuzhou 350122, China. E-mail: shweng@fjmu.edu.cn
bDepartment of Pharmacy, First Affiliated Hospital of Fujian Medical University, Fuzhou, Fujian 350005, P. R. China. E-mail: gxzsly@163.com
First published on 25th October 2021
Abstract
The monitoring of deferasirox (DEF) has important clinical roles in patients who need iron excretion. However, analytical methods with practicability and simplicity are limited. Moreover, ratiometric fluorescence strategies based on Förster resonance energy transfer (FRET) from carbon dots (CDs) as a donor are rarely reported as a drug monitor. In this work, CDs with an appropriate emitting wavelength at 480 nm and excitation around 370 nm were prepared by hydrothermal approach and HCl post-treatment. O-Phenylenediamine (OPD) can be oxidized by Cu2+ to produce yellow fluorescent 2,3-diaminophenazine (oxOPD) in the system of Cu2+ and OPD (Cu–OPD). Correspondingly, a remarkable FRET from CDs to oxOPD in the system of CDs, Cu2+ and OPD (CDs–Cu–OPD) was fabricated with the quenching illustration of CDs, but emitting property of oxOPD. Attributed to the chelation ability of DEF on Cu2+, the inhibitory effects of DEF on the Cu2+-triggered oxidative capability reduced the FRET system by the decreased oxOPD. Thus, the recovered CDs at F480 and decreased oxOPD at F560 were found through a ratiometric mode by the addition of DEF in CDs–Cu–OPD for the DEF assay. The FRET behavior of CDs and oxOPD in CDs–Cu–OPD was proved clearly through the calculation of the association constant, binding constant, number of binding sites, and the distance between the donor and acceptor. Furthermore, this ratiometric method exhibited promising analytical performance for DEF with the application in real samples. The implementation of this work expands the application field of CDs and OPD oxidation in drug monitoring, and even other biological analyses through ratiometric strategy.
Introduction
In clinic, patients with severe β-thalassemia or sickle cell disease, which demand chronic blood transfusion treatment, need iron chelating agents for a long time to promote iron excretion.1,2 Correspondingly, deferasirox (DEF), a new oral iron chelator with long half-life and good tolerance, has been used as a first-line drug for the treatment of patients who need iron excretion.2,3 Although DEF has greatly improved the tolerance and compliance of patients with medication,4 it still has the side effects of gastrointestinal diseases, hepatorenal toxicity (elevated creatinine), and even proteinuria.5 Therefore, in order to improve the therapeutic effect with reduced side effects, it is necessary to monitor the concentration of DEF to optimize the dosage. Until now, several techniques, such as capillary electrophoresis ultraviolet (CE-UV),6 electrochemical analysis,7 high performance liquid chromatography (HPLC),8,9 and liquid chromatography mass spectrometry (LC-MS/MS),10 have been developed for DEF detection. However, one or several coexisting defects of time-consuming, complex sample pre-treatment, high instrument cost, and the need of professional and technical personnel operation restrict the wide application of the abovementioned methods.Fluorescence technology has attracted extensive interests in drug monitoring ascribed to its sensitivity, facile operation, fast analysis and controllable sample pre-treatment.11,12 Using the copper ion or terbium ion as a ligand, fluorescence strategies through single changed intensity have been fabricated on the basis of a formed DEF-copper chelator13,14 or DEF–terbium complex1,15 at the specific testing conditions, such as incubation under alkaline conditions.13 In general, most fluorescence sensing systems containing the fluorescence assay for DEF rely on the change of the fluorescence intensity from a single emission centre through a “switch-off” or “signal-on” strategy.16 Although the reported fluorescence methods exhibit acceptable performance for DEF, this single signal sensing strategy is susceptible to the photobleaching defects of the probe, instruments and environmental factors.17,18 Correspondingly, by measuring the ratio of two or more fluorescence emission intensities, ratiometric strategies with self-calibration function have been gradually developed in recent years.19 In general, ratiometric methods can effectively reduce or eliminate the interference of environmental factors on the sensing system, and then significantly improve the reproducibility and accuracy for targets, like ions,20,21 biological components,22,23 and even genes.24,25 Meanwhile, the construction of ratiometric fluorescence methods for the monitoring of DEF or other drugs is worth ongoing examination and discussion.
For the establishment of the ratiometric method through fluorescence signals, the preparation of a probe with effective and appropriate fluorescent properties is the chief consideration.26 Carbon dots (CDs), a new type of fluorescent carbon nanomaterials in analytical applications,27,28 possess the advantages of controllable optical properties, water solubility, simple preparation, and facile surface functionalization.11 Meanwhile, for specific detection applications, synthetic designs of CDs are needed with particular excitation/emission properties,14 enhanced fluorescence quantum yield (QY),29 and other surface properties.13 Correspondingly, with variable sources available, several strategies including the microwave-assisted method, melting procedure, and solvothermal approach have been developed for CDs preparation with modulated physicochemical properties.30,31 Besides the exploitation of the preparation methods of CDs for detection need, the surface modification13,32 and controllable integration33,34 of CDs are also significant strategies for the construction of CDs-based assays. Recently, using CDs as a carrier or aggregate unit, ratiometric fluorescent assays were gradually developed through a specific preparation procedure for testing.25,35,36 Therefore, it is promising to exploit a ratiometric fluorescence method based on controllable CDs for drug monitoring.
Förster resonance energy transfer (FRET) is an important interaction mechanism of fluorescence modulation caused by the energy transfer from the emitting probe (energy donor) to the receptor. The factors for FRET are that the emission spectrum of the donor (fluorescent probe) overlaps the UV absorption of the receptor (quencher or another emitter) with the appropriate binding action and interacting distance.36–38 Combined with fluorescent probes with different emission wavelengths and confinement effect of some agents, several ratiometric fluorescent strategies based on the FRET principle are developed.38–42 O-Phenylenediamine (OPD) can be controllably oxidized to yellow fluorescent 2,3-diaminophenazine (oxOPD) by various oxidants, such as Cu2+,43,44 Ag+,45 MnO2 (ref. 46) and H2O2.47 The modulated contents of the oxidants will quantitatively regulate the produced oxOPD for the detection of variable targets.43–47 As a metal chelating agent, DEF can chelate with Cu2+ to form a stable complex (DEF–Cu).14 Inspired by the fact that Cu2+ can play dual functions of the oxidant for OPD to produce oxOPD and the chelation with DEF to form a complex, a ratiometric sensing strategy for DEF with Cu2+ as a medium is designed for DEF detection based on the competitive role of Cu2+, as shown in Scheme 1. Taking m-phenylenediamine as a source, a green luminescent CDs was prepared through a two-step process of hydrothermal synthesis and the post-treatment of HCl. The CDs are stable to most common metal ions containing Cu2+. With the catalytic oxidation of Cu2+, OPD produces oxOPD, whose excitation spectrum overlaps and acts as the energy receptor of CDs to form a FRET system between CDs and oxOPD in the system of CDs, Cu2+ and OPD (CDs–Cu–OPD). The CDs–Cu–OPD with a simple mixing procedure can be developed as a facile ratiometric fluorescent method for the sensitive detection of DEF, in which DEF plays a significant factor for the FRET between CDs and oxOPD from Cu2+ and OPD (Cu–OPD) on the basis of the chelation of DEF and Cu2+ to be DEF–Cu. It has been successfully used for DEF detection with potential real applications. It is worth noting that this FRET system is fabricated without any external confinement effect34 or any integrated approach48 for the monitoring of important drugs. It opens up new insight into drug monitoring based on a controlled reaction and new applied CDs through a ratiometric strategy.
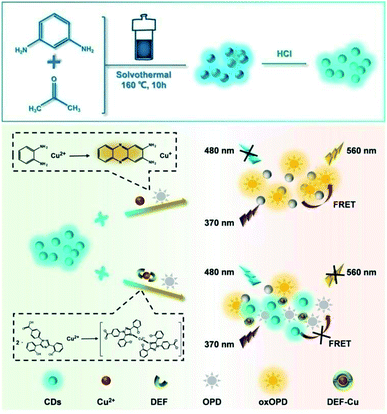 | ||
| Scheme 1 Illustration of the preparation of CDs and the ratiometric fluorescence strategy in response to deferasirox (DEF) via the dual-signal from CDs and Cu2+-catalyzed oxidation of OPD. | ||
Experimental
Chemicals and materials
O-Phenylenediamine (OPD), m-phenylenediamine (MPD), deferasirox (DEF), CuCl2·5H2O, AlCl3, KCl, NiCl2, ZnCl2, MnCl2, CoSO4, CaCl2, CdCl2, MgCl2, AgNO3, FeCl3, FeCl2, NaCl, L-cysteine (Cys), L-ascorbic acid (AA), argininic acid (Arg), proline (Pro), and dopamine hydrochloride (DA) were purchased from Aladdin Reagent Co., Ltd. (Shanghai, China). Trypsin (Try) and hyaluronic acid (HA) were supplied by Shanghai Macleans Biochemical Technology Co., Ltd. Fructose (Fru), glucose (Glu), disodium edetate dehydrate (EDTA), 4-aminobutyric acid, acetone (GABA), methanol, sodium dihydrogen phosphate dihydrate, and disodium phosphate dodecahydrate were obtained from Sinopharm Chemical Reagent Co., Ltd. All reagents were used directly in this work.Apparatus
The fluorescence spectra were recorded by a Cary Eclipse fluorescence spectrophotometer (Agilent Technologies, USA). UV-Vis absorption spectra were measured in a UV-2450 spectrophotometer (Shimadzu Corporation, Japan). Transmission electron microscopy (TEM) images were obtained from FEI Talos F200S (Thermo Fisher Scientific, USA). The fluorescence lifetime decay curves of CDs were recorded by a FS5 fluorescence spectrometer (Edinburgh Instruments, Britain). Fourier transform infrared spectroscopy (FTIR) was obtained from a NICOLET iS50 Infrared Spectrometer (Thermo Fisher Scientific, USA).Synthesis of CDs
A quantity of 0.1 g m-phenylenediamine (MPD) was dissolved in 10 mL acetone using ultrasound to obtain a homogeneous solution. The solution was transferred to a 50 mL hydrothermal reactor and heated at 160 °C for 10 h. After cooling, 2.5% hydrochloric acid solution and the reacting solution were mixed with a ratio of 9![[thin space (1/6-em)]](https://www.rsc.org/images/entities/char_2009.gif) :
:![[thin space (1/6-em)]](https://www.rsc.org/images/entities/char_2009.gif) 1. Then, the mixture was filtered by 0.22 μm filter membrane. The filtrate was purified through dialysis for 24 h with water changed every 4 h. After lyophilization, the obtained CDs were stored at 4 °C.
1. Then, the mixture was filtered by 0.22 μm filter membrane. The filtrate was purified through dialysis for 24 h with water changed every 4 h. After lyophilization, the obtained CDs were stored at 4 °C.
Evaluating the relative fluorescence quantum yields of CDs (QYCDs)
The QYCDs (Ex = 374 nm) was evaluated by using quinine sulfate (QS, Ex = 350 nm) as reference. The absorbance of CDs (aqueous solution) and quinine sulfate (dissolved in 0.1 M H2SO4, QYQs = 54.6%) at 374 nm were determined, respectively. The emission spectra of the above solutions were measured at 374 nm excitation. Finally, the slope ratio of CDs to quinine sulfate (KCDs/KQs) was obtained by taking the absorbance as the X-axis and integral area of the fluorescence spectrum as the Y-axis. Then, the QYCDs was calculated according to formula (1):
 | (1) |
Among them, QYCDs and QYQs, KCDs and KQs and ηCDs and ηQs are the QY, curve slope and solvent refractive index of CDs and quinine sulfate, respectively (ηCDs = ηQs = 1.33).
Detection of DEF
In 200 μL pH 8.0 phosphate buffered saline (PBS), CDs, OPD and Cu2+ were mixed to a final concentration of 50 μg mL−1, 2 mM and 100 μM (CDs–Cu–OPD), respectively. Then, different DEF standard solutions of different concentrations (0, 0.5, 1, 2, 4, 6, 8, 10, 12, 14, 16, 18, 20, 22, 24 μg mL−1) were added to CDs–Cu–OPD and reacted for 30 min at 37 °C. The fluorescence spectra were recorded in the 400–700 nm range with 370 nm excitation.Real application
This method was applied to test the content of DEF in deferasirox disperse tablets and the recovery of DEF in serum.Deferasirox disperse tablets were refined, weighed and added to methanol solvent, then diluted with pH 8.0 PBS as a stock solution. A specific volume of the stock solution was added to CDs–Cu–OPD containing 50 μg mL−1 CDs, 2 mM OPD and 100 μM Cu2+, and its fluorescence intensity was measured in the 400–700 nm range. The content of DEF of the added stock solution was calculated using the measured intensity on the basis of the testing result of section “Detection of DEF”.
Similarly, the recovery of DEF in a diluted serum (1%) with PBS was tested in accordance with the section “Detection of DEF”.
Results and discussion
Characterization of CDs
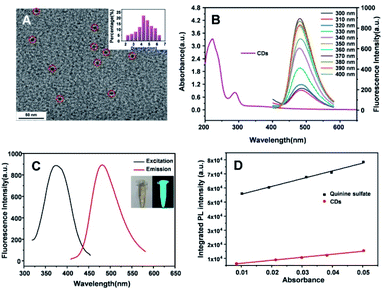
The morphology and optical property of CDs were investigated. As shown in Fig. 1A, the prepared CDs were relatively uniform with the monodisperse spherical structures in the range of 2.3–6.0 nm and an average diameter of 4.5 nm. The UV-vis absorption of CDs (Fig. 1B) exhibited the two absorption bands at 221 nm and 280 nm, ascribed to the π–π* transition of the conjugated sp2 core (conjugated C![[double bond, length as m-dash]](https://www.rsc.org/images/entities/char_e001.gif) C units) of CDs.49,50 With the excitation wavelength ranging from 300 to 400 nm, the CDs exhibited stable emission fluorescent wavelength centered at 480 nm with the modulated intensities, suggesting the excitation-independent luminescence ability of CDs. In addition, CDs had a maximum excitation wavelength of 374 nm with the maximum intensity at the specific emission wavelength of 480 nm (Fig. 1C). The inset showed that CDs appeared as pale yellow under sunlight and green fluorescence under ultraviolet lamps. It is necessary to point out that the CDs were obtained from a two-step reaction containing a hydrothermal reaction and HCl post-treatment. Another kind of carbon dots (b-CDs) was prepared from the same procedure of CDs, except for the HCl post-treatment (shown in ESI†). The maximum excitation and emission wavelengths of b-CDs (Fig. S1†) were 350 nm and 456 nm, respectively. Moreover, b-CDs exhibited the excitation-dependent emission behavior. Compared with the blue luminescence of b-CDs, the HCl post-treatment was the significant process for the preparation of CDs with the red-shift emission behaviour. Furthermore, taking quinine sulfate as the reference (quantum yield of 54.6%), the relative quantum yield of CDs was calculated to be 21.2% (Fig. 1D), implying the favourable luminescent property of the obtained CDs.
C units) of CDs.49,50 With the excitation wavelength ranging from 300 to 400 nm, the CDs exhibited stable emission fluorescent wavelength centered at 480 nm with the modulated intensities, suggesting the excitation-independent luminescence ability of CDs. In addition, CDs had a maximum excitation wavelength of 374 nm with the maximum intensity at the specific emission wavelength of 480 nm (Fig. 1C). The inset showed that CDs appeared as pale yellow under sunlight and green fluorescence under ultraviolet lamps. It is necessary to point out that the CDs were obtained from a two-step reaction containing a hydrothermal reaction and HCl post-treatment. Another kind of carbon dots (b-CDs) was prepared from the same procedure of CDs, except for the HCl post-treatment (shown in ESI†). The maximum excitation and emission wavelengths of b-CDs (Fig. S1†) were 350 nm and 456 nm, respectively. Moreover, b-CDs exhibited the excitation-dependent emission behavior. Compared with the blue luminescence of b-CDs, the HCl post-treatment was the significant process for the preparation of CDs with the red-shift emission behaviour. Furthermore, taking quinine sulfate as the reference (quantum yield of 54.6%), the relative quantum yield of CDs was calculated to be 21.2% (Fig. 1D), implying the favourable luminescent property of the obtained CDs.
The chemical structure of CDs was characterized by XPS and FTIR. In the XPS survey (Fig. 2A) of CDs, there were four main elemental peaks in CDs, which were attributed to C 1s (284.8 eV), N 1s (399.1 eV), O 1s (532.3 eV) and Cl 2p (197.5 eV). The elemental atomic contents of the corresponding four energy spectrum peaks were 77.34% (C), 10.95% (N), 7.44% (O), and 4.26% (Cl). The high-resolution XPS spectrum of C 1s (Fig. 2B) yielded three fitting bands, which were assigned to C![[double bond, length as m-dash]](https://www.rsc.org/images/entities/char_e001.gif) C/C–C (284.2 eV), C–O/C–N (285.1 eV) and C–Cl (286.2 eV).51 The XPS spectrum of N 1s (Fig. 2C) could be deconvoluted into the binding energies of 399.1 eV (pyridine N) and 401.3 eV (N–Cl),52 suggesting the doping effect of N and Cl in CDs. Moreover, the two fitting bands in the high-resolution XPS spectrum of O1s (Fig. 2D) corresponded to 532.3 eV (C
C/C–C (284.2 eV), C–O/C–N (285.1 eV) and C–Cl (286.2 eV).51 The XPS spectrum of N 1s (Fig. 2C) could be deconvoluted into the binding energies of 399.1 eV (pyridine N) and 401.3 eV (N–Cl),52 suggesting the doping effect of N and Cl in CDs. Moreover, the two fitting bands in the high-resolution XPS spectrum of O1s (Fig. 2D) corresponded to 532.3 eV (C![[double bond, length as m-dash]](https://www.rsc.org/images/entities/char_e001.gif) O) and 533.0 eV (C–OH/C–O–C).51 Furthermore, the high-resolution XPS spectrum of Cl2p (Fig. 2E) revealed the peaks of 197.5 eV (C–Cl) and 199.1 eV (N–Cl), suggesting the covalent bond of elemental Cl in CDs.53 In addition, the FTIR spectrum (Fig. 2F) showed that the strong absorption band at 3415 cm−1 belonged to the overlapping of the stretching vibration of O–H and N–H. The peaks at 1600 cm−1 and 1446 cm−1 were the stretching vibrations of C
O) and 533.0 eV (C–OH/C–O–C).51 Furthermore, the high-resolution XPS spectrum of Cl2p (Fig. 2E) revealed the peaks of 197.5 eV (C–Cl) and 199.1 eV (N–Cl), suggesting the covalent bond of elemental Cl in CDs.53 In addition, the FTIR spectrum (Fig. 2F) showed that the strong absorption band at 3415 cm−1 belonged to the overlapping of the stretching vibration of O–H and N–H. The peaks at 1600 cm−1 and 1446 cm−1 were the stretching vibrations of C![[double bond, length as m-dash]](https://www.rsc.org/images/entities/char_e001.gif) O and C
O and C![[double bond, length as m-dash]](https://www.rsc.org/images/entities/char_e001.gif) C on the aromatic ring, respectively. The peaks at 1075 cm−1 and 631 cm−1 were caused by the stretching vibration of C–N/C–O and C–Cl, respectively. The FTIR results were consistent with the XPS characterization, confirming the molecular structure of CDs. Furthermore, XPS and FTIR proved the doping effect of N and Cl in CDs with the coexistence of the hydrophilic functional groups of –NH2/–OH and –COOH.
C on the aromatic ring, respectively. The peaks at 1075 cm−1 and 631 cm−1 were caused by the stretching vibration of C–N/C–O and C–Cl, respectively. The FTIR results were consistent with the XPS characterization, confirming the molecular structure of CDs. Furthermore, XPS and FTIR proved the doping effect of N and Cl in CDs with the coexistence of the hydrophilic functional groups of –NH2/–OH and –COOH.
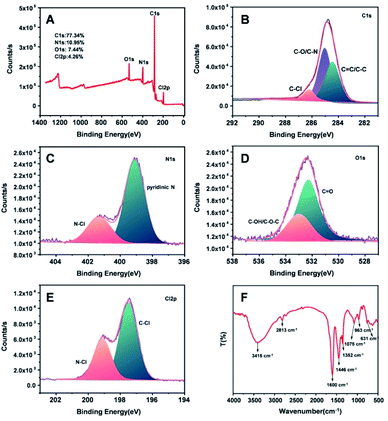 | ||
| Fig. 2 XPS survey (A), XPS high-resolution surveys of C 1s (B), N 1s (C), O 1s (D) and Cl 2p (E), and FTIR spectrum (F) of CDs. | ||
The stability of CDs in different environments was investigated, as shown in Fig. S2.† At variable temperatures, the CDs retained relatively stable intensities (Fig. S2A†). In the range of salt concentrations, the CDs retained intensities of more than 94.0% even at 1 M NaCl (Fig. S2B†). At the same time, the potential response of CDs in different pH environments was studied. CDs retained unchanged luminescence properties in the pH 3–8 range. When the pH was higher than 9, the fluorescence intensities gradually decreased with increased pH, showing that CDs were sensitive to alkaline environments (Fig. S2C†). More importantly, by evaluating the fluorescence stability of CDs stored at room temperature for 90 days, it was found that the fluorescence value of CDs was still higher than 92.8% (Fig. S2D†). The long-term stability of CDs will provide a guarantee for real application. In addition, CDs kept the stable emission strength with the continuous 60 min excitation at 370 nm (Fig. S2E†). Moreover, the anti-photobleaching ability of CDs was evaluated compared with common dyes. As shown in Fig. S2F,† compared with commercial dyes (ROX and FAM), the fluorescence intensity of CDs was higher than 68.0% with the continuous excitation for 90 min under 300 W xenon lamp at 365 nm, while the fluorescence intensity of ROX and FAM decreased to 31.7% and 29.0%, respectively, indicating the much stronger anti-photobleaching ability of CDs than that of ROX and FAM. In general, the response of CDs to common metal ions, like Fe3+, Ag+ and Cu2+, is the main focus of the research on CDs in detection application.54 Thus, the possible effects of different metal ions on CDs were also investigated. Most of the metal ions (including Cu2+) posed negligible quenching effects on CDs (Fig. S3†), while only Ag+, Fe2+ and Fe3+ had a slight quenching effect on CDs. The fluorescent stability of CDs on metal ions will induce some new application insight in biological condition.
The feasibility and the mechanism of the detection strategy
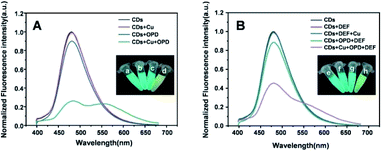
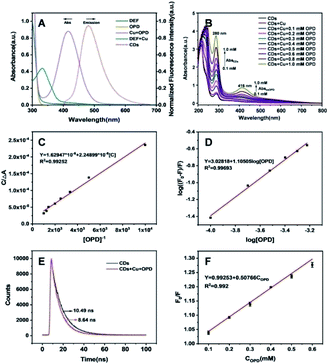
The feasibility of the ratiometric system based on CDs–Cu–OPD for DEF detection was evaluated. As shown in Fig. 3A, the addition of simple Cu2+ or OPD affected the emission property of CDs weakly, suggesting the negligible quenching effect of Cu2+ or OPD on CDs. Meanwhile, the CDs–Cu–OPD exhibited significantly different emission from that of pure CDs (Fig. 3A). The emission of CDs at 480 nm was significantly reduced with a new increased fluorescence signal at 560 nm, which was ascribed to oxOPD from the Cu2+-triggered oxidation of OPD.55 Corresponding images (inset of Fig. 3A) illustrates the new yellowish luminescence phenomenon with a little green luminescence of CDs that was formed from the originally green image of CDs. Considering the imposed excitation at 370 nm, which is very different from the appropriate excitation wavelength of oxOPD,55 the changed fluorescence phenomenon suggested that some interaction happened between CDs and Cu–OPD in CDs–Cu–OPD. Furthermore, the influence of DEF on CDs–Cu–OPD was evaluated, as shown in Fig. 3B. Simple DEF, mixture of DEF and Cu2+ (DEF–Cu), and the coexistence of OPD and DEF posed a negligible effect on the fluorescence emission of CDs. Correspondingly, when DEF was added to CDs–Cu–OPD, compared with CDs–Cu–OPD in Fig. 3A, the intensity at 480 nm recovered significantly, while the fluorescence signal at 560 nm clearly decreased (Fig. 3B). In addition, the yellow luminescence in tube h (inset of Fig. 3B) was significantly weaker than that in tube d (inset of Fig. 3A), while the green luminescence was somewhat recovered. It is known that DEF can chelate with Cu2+ to form DEF–Cu.14 The formed DEF–Cu would decrease the free copper ion, and then the Cu2+-triggered oxidation of OPD was inhibited by the addition of DEF. The reduced oxOPD caused by DEF addition weakened the interaction and quenching effect of oxOPD on CDs with the excitation at 370 nm. The controlled fluorescence spectrum by DEF was also feasible for DEF detection using the modulated ratios of F480 and F560 (F480/F560) through ratiometric mode.The mechanism of the ratiometric strategy was investigated in detail. First, the principle of the changed fluorescence spectrum of CDs–Cu–OPD from that of CDs was investigated. As shown in Fig. 4A, DEF and OPD had no UV absorption at 350–700 nm, while the formed DEF–Cu produced a new UV absorption peak at 332 nm. These absorbance behaviours cannot interact with the emission behaviour of CDs at 480 nm. However, OPD could be selectively oxidized by Cu2+ to produce oxOPD with the maximum absorption at 416 nm, which overlapped the emission spectrum of CDs at 480 nm to a certain degree. This coverage will induce the interaction between CDs and oxOPD. In addition, the increased OPD induced enhanced the absorbance at 416 nm with the fixed Cu2+ in CDs–Cu–OPD (Fig. 4B). Moreover, according to the Benesi–Hildebrand equation (shown as formula (S1) in ESI†), the relationship between C/(ΔA) and 1/([OPD]) was investigated to evaluate the interaction of CDs and oxOPD.56,57 As shown in Fig. 4C, there was a good linear relationship between C/(ΔA) and 1/([OPD]) (R2 = 0.9925), and the association constant (Ka) for CDs and oxOPD is 7.25 × 10² M−1, indicating the strong interaction between CDs and oxOPD.57,58 To further evaluate the degree of the combination of oxOPD and CDs, the binding constant (Kb) and the number of binding sites (n) of oxOPD with CDs were calculated by formula (S2) (shown in ESI†).59 As shown in Fig. 4D, log(F0 − F)/F and log[OPD] showed a good linear relationship (R2 = 0.9969); that is, the Kb and the binding site (n) were calculated to be 1.067 × 10⁴ M−1 and 1.105, respectively. It can be concluded that there was one binding site of oxOPD on the surface of CDs in CDs–Cu–OPD.
The fluorescence lifetime decays of CDs without or with Cu–OPD were further compared. As shown in Fig. 4E, the lifetime of CDs decreases from 10.49 ns to 8.64 ns with the addition of Cu–OPD, suggesting the possible presence of FRET. Moreover, the quenching rate constant Kq of CDs is 4.84 × 10¹⁰ M−1 s−1 (>1010 M−1 s−1) according to the Stern–Volmer curve (Fig. 4F)60 and formula (S3) (shown in ESI†).61 Furthermore, the distance between the CDs (donor) and oxOPD (acceptor) was evaluated. According to formula (S4),† an energy transfer efficiency (E) of 0.165 was obtained. Moreover, the critical transfer distance (R0) between CDs and oxOPD in CDs–Cu–OPD was calculated to be 3.19 nm on the basis of formula (S5) and formula (S6).†62 Thus, according to formula (S7),† the distance (r0) between CDs (donor) and oxOPD (acceptor) was 4.18 nm, which was among the optimal donor–acceptor distance for FRET of 2–9 nm.63 Combined with the overlapped spectra of the emission of CDs and the absorbance of oxOPD, the proved strong interaction, calculated binding constant with one binding site, and the appropriate donor–acceptor distance, we can sum up that the FRET effect between CDs and oxOPD from Cu–OPD occurs in CDs–Cu–OPD.
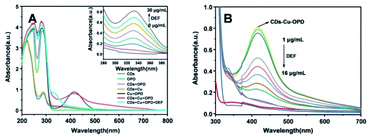
Second, the mechanism of the addition of DEF in CDs–Cu–OPD to modulate the FRET behavior and then fluorescence spectra was evaluated. As shown in Fig. 5A, it was worth noting that when DEF was added to the CDs–Cu–OPD, the absorption peak of oxOPD at 416 nm disappeared with the new absorbance peak of DEF–Cu at 332 nm. Moreover, the inset of Fig. 5A shows that the absorption of DEF–Cu (332 nm) gradually increased with the increased DEF at fixed Cu2+. Moreover, the absorption of CDs–Cu–OPD with increased DEF exhibited weakened absorbance at 416 nm with enhanced DEF, as shown in Fig. 5B. Therefore, the higher the concentration of DEF, the more DEF–Cu formed at the fixed Cu2+, and then a lower amount of oxOPD was produced by the Cu2+-catalyzed OPD. This meant that DEF impeded the generation of oxOPD, thereby reducing the occurrence of FRET between CDs and oxOPD and promoting the recovery of CDs fluorescence, but reducing the fluorescence intensity of oxOPD in CDs–Cu–OPD.
Optimization of the experimental conditions
Several possible factors for the detection were optimized. The concentrations of Cu2+ and OPD for the optimal quenching of CDs in CDs–Cu–OPD were evaluated. As shown in Fig. S4 and S5,† the fluorescence quenching efficiency of CDs ascribed to FRET increased with increasing Cu2+ and OPD concentrations, reaching the maximum and then plateaued at 100 μM and 2 mM, respectively. Some reaction conditions, like the reaction time, incubation temperature and pH, were optimized. The fluorescence ratios at 480 nm and 560 nm (F480/F560) were applied as the evaluating indicator. F480/F560 remained relatively stable with a little fluctuation as the reaction time was extended (Fig. S6A†), the temperature increased (Fig. S6B†) and the pH increased (Fig. S6C†). In general, the reaction conditions of 30 min at 37 °C and pH 8.0 promote the highest F480/F560 for the detection. Thus, these above-mentioned reacting conditions were selected as the appropriate factors for the ratiometric method for DEF.Analytical performance of DEF
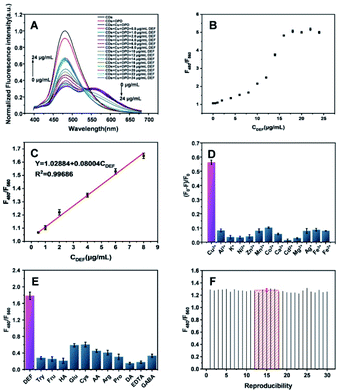
Under the optimal conditions, for CDs–Cu–OPD, the fluorescence intensities increased gradually at 480 nm, but decreased gradually at 560 nm with the increased DEF (Fig. 6A). F480/F560 increased and then reached a plateau with the increase of CDEF (Fig. 6B). In the range of 0.5–8 μg mL−1, F480/F560 presented a good linear relationship with CDEF with the fitting equation of Y = 0.08004CDEF + 1.02884, R2 = 0.99576 (Fig. 6C). The limit of detection (LOD) was 0.38 μg mL−1 based on S/N = 3. Moreover, the selectivity of this method was evaluated. The possible catalytic oxidation of OPD by different metal ions was investigated to assess the potential interfering effect of common metal ions. As shown in Fig. 6D, compared with the excellent catalytic oxidation of Cu2+ on OPD, the common metal ions (Al3+, K+, Ni2+, Zn2+, Mn2+, Co2+, Ca2+, Cd2+, Mg2+, Ag+, Fe3+ and Fe2+) exhibited a negligible effect on the signal modulation of the system containing CDs and OPD. Some substances that may exist in real samples were applied to evaluate the possible interference to the DEF detection. As shown in Fig. 6E, compared with the response of DEF to F480/F560, common interfering substances containing proteins, amino acids and small molecular compounds had little effect on F480/F560 of CDs–Cu–OPD, indicating the good selectivity of this method for DEF. The reproducibility of this sensing strategy for DEF was evaluated. The 3 μg mL−1 DEF was selected for 30 independent measurements at different time points. As shown in Fig. 6F, the standard deviation (SD) and relative standard deviation (RSD) of the testing results were 0.024 and 1.88%, respectively. The result of the multiple determinations showed that the developed CDs–Cu–OPD possessed good reproducibility and reliability for DEF detection.The practicability of the developed strategy in real samples was investigated. The method was used to monitor the DEF content in deferasirox dispersible tablets and human serum samples. As shown in Table S1,† the labeled amount of DEF in the deferasirox dispersible tablet was tested to be 103.6% with the RSD of 4.34%. This result satisfied the requirement of the Chinese Pharmacopoeia (Ch.P 2020) for the quality control of the marked amount (90–110%). The recovery of DEF in serum was further detected. As shown in Table S2,† the recoveries of DEF in human serum samples ranged from 96.50% to 109.5% with the RSD at less than 2.82%. It is expected that this method can be applied to detect DEF accurately in real samples for clinical drug monitoring. Moreover, the analytical performance of the proposed method for DEF was compared with that of reported different analytical methods (Table S3†). The results showed that the ratiometric fluorescence sensing method exhibited an acceptable performance in terms of the linear range and LOD. Considering the fact that the therapeutic concentration of DEF is tens of μg mL−1,6 the linear range, LOD, simple mixing procedure and easy operation of this strategy suggested the expanded application possibility in real samples for blood drug concentration monitoring.
Conclusions
In summary, using m-phenylenediamine as a carbon source, luminescence CDs with specific emission and excitation properties were obtained by sequential processing of the solvothermal reaction and HCl post-treatment. The mixture of CDs and the Cu2+-triggered oxidation of OPD led to a remarkable FRET from CDs to oxidized OPD (oxOPD). Ascribed to the chelation of DEF and Cu2+, the presence of DEF modulated the free Cu2+, followed by the fluorescent intensities of CDs and oxOPD for ratiometric assay. The method exhibited a wide linear range and acceptable LOD for DEF with high reproducibility. Such ratiometric method based on CDs and OPD possessed the following advantages: (1) the facile procedure of the simple mixing step of commercial OPD, Cu2+ and controlled prepared CDs made the bioanalytical system time-saving and cost effective; (2) the elaborate and clarified investigation of the testing mechanism of the FRET from CDs to oxOPD in CDs–Cu–OPD and the inhibition effect of DEF on the FRET; (3) inspiring the importance of the appropriate design of CDs with the specific fluorescent properties of suitable excitation/emission wavelength and response to environmental media for biological applications.Author contributions
Chen-Fang Miao: methodology, data curation, formal analysis, visualization, writing – original draft, writing – review & editing; Xian-Zhong Guo: methodology, formal analysis, supervision, funding acquisition, writing – original draft; Xin-Tian Zhang, Yin-Ning Lin: data curation, formal analysis; Wen-Di Han, Zhengjun Huang: data curation, resources, Shao-Huang Weng: conceptualization, methodology, formal analysis, project administration, supervision, funding acquisition, writing – original draft, writing – review & editing.Conflicts of interest
There are no conflicts to declare.Acknowledgements
The authors gratefully acknowledge financial support from the National Science Foundation of Fujian Province (2020J01626), and the Start Fund for Scientific Research, Fu-jian Medical University (2017XQ1068).References
- J. Manzoori, A. Jouyban, M. Amjadi, V. Panahi-Azar, E. Tamizi and J. Vaez-Gharamaleki, Luminescence, 2011, 26, 244–250 CrossRef CAS PubMed.
- M. Cappellini and A. Taher, Acta Haematol., 2009, 122, 165–173 CrossRef CAS PubMed.
- F. Wimazal, T. Nösslinger, C. Baumgartner, W. R. Sperr, M. Pfeilstöcker and P. Valent, Eur. J. Clin. Invest., 2009, 39, 406–411 CrossRef CAS PubMed.
- H. Chang, M. Lu, S. Peng, Y. Yang, D. Lin, S. Jou and K. Lin, Ann. Hematol., 2015, 94, 1945–1952 CrossRef CAS PubMed.
- C. Quinn, V. Johnson, H. Kim, F. Trachtenberg, M. Vogiatzi, J. Kwiatkowski, E. Neufeld, E. Fung, N. Oliveri, M. Kirby and P. Giardina, Br. J. Haematol., 2011, 153, 111–117 CrossRef CAS PubMed.
- H. Lin, K. Hsieh, S. Chiou, H. Kou and S. Wu, J. Pharm. Biomed., 2016, 131, 497–502 CrossRef CAS PubMed.
- H. Heli, H. Yadegari and K. Karimian, J. Exp. Nanosci., 2011, 6, 488–508 CrossRef CAS.
- M. Golpayegani, R. Akramipour and N. Fattahi, J. Pharm. Biomed., 2021, 193, 113735 CrossRef CAS PubMed.
- C. Onal, S. Tekkeli and A. Sagiroglu, Chromatographia, 2020, 83, 1329–1333 CrossRef CAS.
- T. Li, Z. Cui, Y. Wang, W. Yang, D. Li, Q. Song, L. Sun and L. Ding, J. Pharm. Biomed., 2018, 151, 145–150 CrossRef CAS PubMed.
- G. Ge, L. Li, D. Wang, M. Chen, Z. Zeng, W. Xiong, X. Wu and C. Guo, J. Mater. Chem. B, 2021, 9, 6553–6575 RSC.
- C. Ji, Y. Zhou, R. Leblanc and Z. Peng, ACS Sens., 2020, 5, 2724–2741 CrossRef CAS PubMed.
- C. Wang, P. Huang, H. Kou and S. Wu, Sens. Actuators, B, 2020, 311, 127916 CrossRef CAS.
- W. Han, C. Miao, X. Zhang, Y. Lin, X. Hao, Z. Huang, S. Weng, X. Lin, X. Guo and J. Huang, Anal. Chim. Acta, 2021, 1179, 338853 CrossRef CAS PubMed.
- J. Abolhasani, R. Naderali and J. Hassanzadeh, Anal. Sci., 2016, 32, 381–386 CrossRef PubMed.
- N. Kwon, D. Kim, K. Swamy and J. Yoon, Coord. Chem. Rev., 2021, 427, 213581 CrossRef CAS.
- Z. Wang, Y. Zhang, Z. Meng, M. Li, C. Zhang, L. Yang, Y. Yang, X. Xu and S. Wang, J. Hazard. Mater., 2022, 422, 126891 CrossRef CAS PubMed.
- H. Deng, Z. Wu, Z. Zhao, L. Zhu, M. Tang, R. Yu and J. Wang, Talanta, 2021, 231, 122331 CrossRef CAS PubMed.
- S. Park, N. Kwon, J. Lee, J. Yoon and I. Shin, Chem. Soc. Rev., 2020, 49, 143–179 RSC.
- Y. Fan, L. Han, Y. Yang, Z. Sun, N. Li, B. Li, H. Luo and N. Li, Environ. Sci. Technol., 2020, 54, 10270–10278 CrossRef CAS PubMed.
- M. Li, X. Li, M. Jiang, X. Liu, Z. Chen, S. Wang, T. D. James, L. Wang and H. Xiao, Chem. Eng. J., 2020, 399, 125741 CrossRef CAS.
- A. Kumar, W. Tseng, M. Wu, Y. Huang and W. Tseng, Anal. Chim. Acta, 2020, 1113, 43–51 CrossRef PubMed.
- Y. Fan, X. Deng, M. Wang, J. Li and Z. Zhang, Talanta, 2020, 219, 121349 CrossRef CAS PubMed.
- D. Bahari, B. Babamiri, A. Salimi and A. Rashidi, J. Lumin., 2021, 239, 118371 CrossRef CAS.
- Z. Wang, Z. Xue, X. Hao, C. Miao, J. Zhang, Y. Zheng, Z. Zheng, X. Lin and S. Weng, Anal. Chim. Acta, 2020, 1103, 212–219 CrossRef CAS PubMed.
- K. Wang, L. Liu, D. Mao, S. Xu, C. Tan, Q. Cao, Z. Mao and B. Liu, Angew. Chem., Int. Ed., 2021, 60, 15095–15100 CrossRef CAS PubMed.
- D. Chang, Z. Zhao, L. Shi, W. Liu and Y. Yang, Talanta, 2021, 232, 122423 CrossRef CAS PubMed.
- S. Li and Z. Zhang, Talanta, 2021, 223, 121691 CrossRef CAS PubMed.
- L. Tong, X. Wang, Z. Chen, Y. Liang, Y. Yang, W. Gao, Z. Liu and B. Tang, Anal. Chem., 2020, 92, 6430–6436 CrossRef CAS PubMed.
- J. Liu, R. Li and B. Yang, ACS Cent. Sci., 2020, 6, 2179–2195 CrossRef CAS PubMed.
- J. Zhang, Y. Lin, S. Wu, X. Hou, C. Zheng, P. Wu and J. Liu, Carbon, 2021, 182, 537–544 CrossRef CAS.
- Y. Shen, T. Wu, Y. Wang, S. Zhang, X. Zhao, H. Chen and J. Xu, Anal. Chem., 2021, 93, 4042–4050 CrossRef CAS PubMed.
- Y. Chen, Z. Lin, C. Miao, Q. Cai, F. Li, Z. Zheng, X. Lin, Y. Zheng and S. Weng, RSC Adv., 2020, 10, 26765–26770 RSC.
- J. An, R. Chen, M. Chen, Y. Hu, Y. Lyu and Y. Liu, Sens. Actuators, B, 2021, 329, 129097 CrossRef CAS.
- Z. Wang, L. Zhang, Y. Hao, W. Dong and X. Gong, Anal. Chim. Acta, 2021, 1144, 1–13 CrossRef CAS PubMed.
- W. Yang, J. Ni, F. Luo, W. Weng, Q. Wei, Z. Lin and G. Chen, Anal. Chem., 2017, 89, 8384–8390 CrossRef CAS PubMed.
- Y. Yang, X. Xing, T. Zou, Z. Wang, R. Zhao, P. Hong, S. Peng, X. Zhang and Y. Wang, J. Hazard. Mater., 2020, 386, 121958 CrossRef CAS PubMed.
- W. Shen, H. Xu, J. Feng, W. Sun, G. Hu, Y. Hu and W. Yang, Spectrochim. Acta, Part A, 2021, 263, 120183 CrossRef CAS PubMed.
- Z. Pehlivan, M. Torabfam, H. Kurt, C. Ow-Yang, N. Hildebrandt and M. Yüce, Microchim. Acta, 2019, 186, 563 CrossRef CAS PubMed.
- Z. Suo, X. Liu, X. Hou, Y. Liu, J. Lu, F. Xing, Y. Chen and L. Feng, ChemistrySelect, 2020, 5, 9254–9260 CrossRef CAS.
- Y. Zhang, H. Xu, Y. Yang, F. Zhu, Y. Pu, X. You and X. Liao, J. Photochem. Photobiol., A, 2021, 411, 113195 CrossRef CAS.
- H. Tan, X. Wu, Y. Weng, Y. Lu and Z. Huang, Anal. Chem., 2020, 92, 3447–3454 CrossRef CAS PubMed.
- W. J. Zhang, S. G. Liu, L. Han, H. Q. Luo and N. B. Li, Sens. Actuators, B, 2019, 283, 215–221 CrossRef CAS.
- Z. Wu, R. Chen, S. Pan, H. Liu and X. Hu, Microchem. J., 2021, 164, 105976 CrossRef CAS.
- L. Deng, Q. Liu, C. Lei, Y. Zhang, Y. Huang, Z. Nie and S. Yao, Anal. Chem., 2020, 92, 9421–9428 CrossRef CAS PubMed.
- Q. Yang, C. Li, J. Li, M. Arabi, X. Wang, H. Peng, H. Xiong, J. Choo and L. Chen, J. Mater. Chem. C, 2020, 8, 1–9 Search PubMed.
- W. Jing, F. Kong, S. Tian, M. Yu, Y. Li, L. Fan and X. Li, Analyst, 2021, 146, 4188–4194 RSC.
- F. Li, Y. Chen, R. Lin, C. Miao, J. Ye, Q. Cai, Z. Huang, Y. Zheng, X. Lin, Z. Zheng and S. Weng, Anal. Chim. Acta, 2021, 1148, 338201 CrossRef CAS PubMed.
- R. Guo, B. Chen, F. Li, S. Weng, Z. Zheng, M. Chen, W. Wu, X. Lin and C. Yang, Sens. Actuators, B, 2018, 264, 193–201 CrossRef CAS.
- F. Arcudi, L. Đorđević and M. Prato, Angew. Chem., Int. Ed., 2016, 55, 2107–2112 CrossRef CAS PubMed.
- B. Gu, D. Chen, B. Gao, Z. Liu, Z. Wang, T. Wang, Y. Yang, Q. Guo and G. Wang, ChemistrySelect, 2020, 5, 7155–7163 CrossRef CAS.
- Z. Marković, M. Labudová, M. Danko, D. Matijašević, M. Mičušík, V. Nádaždy, M. Kováčová, A. Kleinová, Z. Špitalský, V. Pavlović, D. Milivojević, M. Medić and B. TodorovićMarković, ACS Sustainable Chem. Eng., 2020, 8, 16327–16338 CrossRef.
- S. Chang, B. Chen, J. Lv, E. Fodjo, R. Qian and D. Li, Microchim. Acta, 2020, 187, 435 CrossRef CAS PubMed.
- M. Batool, H. M. Junaid, S. Tabassum, F. Kanwal, K. Abid, Z. Fatima and A. T. Shah, Crit. Rev. Anal. Chem., 2020, 28, 1–12 CrossRef PubMed.
- J. Sun, B. Wang, X. Zhao, Z. Li and X. Yang, Anal. Chem., 2016, 88, 1355–1361 CrossRef CAS PubMed.
- R. Wang and Z. Yu, Acta Phys. Chim. Sin., 2007, 23, 1353–1359 CrossRef CAS.
- V. Koppal, P. Patil, R. Melavanki, R. Kusanur, U. Afi and N. Patil, J. Mol. Liq., 2019, 292, 111419 CrossRef CAS.
- U. Raghavendra, M. Basanagouda, A. Sidrai and J. Thipperudrappa, J. Mol. Liq., 2016, 222, 601–608 CrossRef CAS.
- M. Magdalena, Spectrochim. Acta, Part A, 2017, 184, 262–269 CrossRef PubMed.
- Y. Fan, S. Liu, Y. Zhang, W. Ren and N. Li, Appl. Surf. Sci., 2020, 526, 146715 CrossRef CAS.
- V. Koppal, R. Melavanki, R. Kusanur and N. Patil, J. Mol. Liq., 2018, 269, 381–386 CrossRef CAS.
- X. Yang, N. Luo, Z. Tan, Z. Jia and X. Liao, Food Anal. Method., 2017, 10, 1308–1316 CrossRef.
- J. R. Lakowicz, in Principles of Fluorescence Spectroscopy, Springer, New York, 3rd edn, 2006 Search PubMed.
Footnotes |
| † Electronic supplementary information (ESI) available: The stability of CDs in different environments: temperatures, NaCl concentrations, pH, storage time, continuous excitation and photobleaching; the fluorescence response of CDs to metal ions; optimization of the concentrations of Cu2+ and OPD, time, temperature and pH in CDs–Cu–OPD with DEF detection; the corresponding equation and the illustration of the equation for the discussion of the mechanism and the supplementary tables. See DOI: 10.1039/d1ra07078a |
| ‡ Equally contributed to this work. |
| This journal is © The Royal Society of Chemistry 2021 |

