 Open Access Article
Fabrication of a surface type humidity sensor based on methyl green thin film, with the analysis of capacitance and resistance through neutrosophic statistics
Usama Afzala,
Naveed Ahmada,
Qayyum Zafar b and
Muhammad Aslam
 *c
*c
aDepartment of Physics, University of Education, Township Campus, Lahore 54000, Pakistan. E-mail: mohammadusamafzal7@gmail.com
bDepartment of Physics, University of Management and Technology, Lahore 54000, Pakistan. E-mail: qayyumzafar@gmail.com
cDepartment of Statistics, Facility of Science, King Abdulaziz University, Jeddah 21551, Saudi Arabia. E-mail: aslam_ravian@hotmail.com
First published on 2nd December 2021
Abstract
In this work, we propose a humidity sensor based on methyl green thin film. A surface-type humidity sensor Al/MG/Al was fabricated by depositing methyl green thin film between aluminum electrodes. The structural, optical and surface morphological properties of the thin film were characterized by XRD, UV Vis and FESEM. The sensing properties with high sensitivity as well as response time 200 s and recovery 60 s of the humidity sensor were investigated by measuring the capacitance and resistance at 1, 10 and 100 kHz with the humidity varying range from 32 to 85% RH. These measured values were analyzed by classical statistics and neutrosophic statistics. As a result, it was observed that neutrosophic statistics were more informative, flexible and adequate than classical statistics for analyzing the measured values of capacitance and resistance.
1. Introduction
The reliable detection and control of humidity is an important requirement of meteorology, pharmaceuticals manufacturing and electronics industry as well as the chemical industry that has increased the use of humidity sensors commercially.1,2 Nowadays, organic semiconductors have gotten importance in the fabrication of humidity sensors due to their remarkable properties such as low dielectric permittivity, electrical characteristics and intrinsic hygroscopic property.3,4 In order to fabricate a humidity sensor, a number of transduction techniques are used including resistive, capacitive, surface acoustic wave optical and field-effect transistor (FET).5–8 All of these techniques have their own performance, but capacitive is dominant due to its low power degeneracy, linear response, cost-effectiveness and device design.9 According to the estimate, about 75% of humidity sensors fabricated by the use of capacitive techniques are available in markets. Similarly, the resistive technique has also been used in a number of humidity sensors.7 Number of researchers have used organic semiconductors in the fabrication of humidity sensors. Fabrication of a humidity sensor with good stability, high sensitivity, quick response and recovery time is highly desirable. Also, an effective and ideal sensing layer that should not peel or swell as relative humidity RH increase, is a core requirement for such fabrication.10 M. I. Azmer et al.,11 reported a capacitive type humidity sensor based on polyvinylpyrrolidone (MEH-PPV:PVP) composite thin film and studied it at 1 volt AC operational bias with relative humidity as the function of broad range 20–90%. It showed a fast response time, i.e., 18 s for adsorption and 8 s for desorption, small rage hysteresis, i.e., 2% RH and exhibited a very high range sensitivity, i.e., 114 f F/%RH @ 100 Hz. A resistive type humidity sensor based on AlPcCl-aluminum phthalocyanine chloride thin films, was fabricated and studied at a relative humidity range of 20 to 92%, by Chani et al.12 Similarly, Ahmad et al.,13 reported a capacitive and resistive type humidity sensor based on organic semiconductor material, i.e., nickel phthalocyanine-NiPc thin film with relative humidity ranges, i.e., 35–95% RH for capacitance and 35–75% RH for resistance. The resistance decreased and capacitance increased as increasing relative humidity RH.Analysis of the data readings of capacitance and resistance of the sensor was performed by the statistics techniques, which may be in the form of graph values or table values. Neutrosophic (introduced by F. Smarandache14) is a reliable technique of statistics, which is the generalization of the fuzzy technique and also more efficient. At the present time, the use of neutrosophic techniques has increased to analyze the data in several fields, i.e., in medicine for diagnoses data measurement,15 in applied sciences,16 in astrophysics, i.e., earth speed17 and in humanistic, etc.18 The neutrosophic technique is used on the interval point value data, i.e., having indeterminacy.19 This is a significant benefit over classical techniques because classical statistic only deals with fixed-point value data, i.e., having no indeterminacy. Moreover, the neutrosophic technique is more helpful than classical techniques, see examples in the following ref. 20, 21 and 22. Different statistical techniques were developed under neutrosophic statistics by Muhammad Aslam.23,24
This work reports the motive study of an organic semi-conductor methyl green MG, which was used for the first time in the fabrication of a humidity sensor and the first-time neutrosophic statistic has been used to analyze the capacitance and resistance on the data. In this study, methyl green in chloroform solution was made and it is optical, structural as well as morphological properties were investigated using different characterization techniques. A surface type humidity sensor (Al/MG/Al) was fabricated, whose capacitance, as well as resistance, were measured simultaneously with respect to the change in the relative humidity (%RH) and analyzed through classical statistics and neutrosophic statistics.
2. Experimental
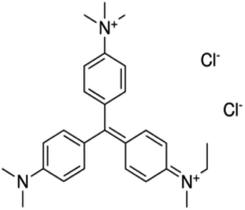
Methyl green [C27H35Cl2N3] MG 99.9% pure was used in this experiment, its structure is shown in Fig. 1.For the fabrication of the device, a glass slide (25 × 25 mm, dimension) was cleaned with acetone and ethanol (15 minutes each) and dried using a nitrogen gun. A 99.9% pure ‘Al’ thin film was deposited on the substrate by thermal evaporation with a shadow mask at 10−5 mbar pressure. In this way, we obtained two ‘Al’ electrodes separated by 50 μm on the substrate. A solution of MG was prepared in chloroform. 40 mg of pure methyl green and 1.6 ml chloroform were used in this solution and the solution was stirred for five hours. The device was fabricated by depositing a 50 μl filtered solution between electrodes and cover the separation of 50 μm with the help of a micropipette. In this way, we fabricated a surface type Al/MG/Al sensor with active sensing layer MG solution of thickness of about 2 μm and surface area of about 8 μm × 25 mm, as shown in Fig. 2.
The structure of the MG thin film sample was characterized using X-ray diffraction (XRD), the optical properties of the sample were studied using the UV Vis technique and the surface morphology was studied using FESEM-Field Emission Scanning Electron Microscopy. Similarly, electrical characterization of the sensor Al/MG/Al was performed in the laboratory at room temperature of about 22 °C. This characterization was associated with the humidity control chamber of dimension 45 cm × 60 cm. For increasing the humidity inside the chamber, a GB-A500LW02 humidifier was used. The capacitance and resistance of the fabricated humidity sensor were measured using the AT2816B LCR meter at different levels of relative humidity %RH. Similarly, for measuring the humidity and temperature inside the chamber, the MT-4014 humidity meter was utilized. We measured all values of capacitance and resistance in intervals (i.e., maximum and minimum change of values) at different points by varying %RH from 32 to 85%. For the neutrosophic technique, we used the same value but for the classical statical technique, we converted these into fix point values by taking the mean of maximum and minimum values at each measured point of %RH. Such type of setup has been used in different research worked to study humidity sensors as shown in ref. 12 and 25. The values of capacitance and resistance as well as, response and recovery times, were measured many times, i.e., daily bases for 17 days at room temperature but we have found minor changes (about 0.5% to 1.7%, which can be neglected) in these values (Fig. 3).
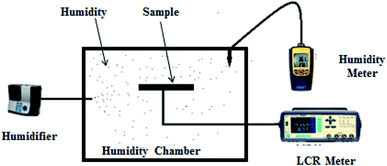 | ||
| Fig. 3 Schematic diagram of the sensing mechanism, utilized for electrical characterization of the capacitance and resistance of the Al/MG/Al humidity sensor. | ||
3. Results and discussion
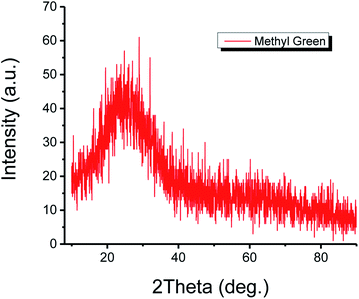
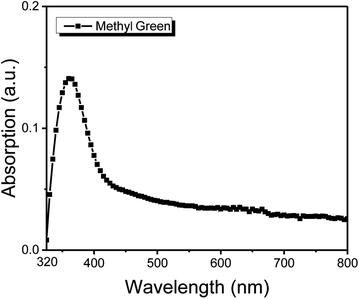
The structure of the thin film of methyl green was studied by the XRD technique. The XRD configuration of the methyl green thin film is shown in Fig. 4. The pattern is observed in the range 5° < 2theta° < 90° with intensity 0 to 70 (a. u.). From the plot, it is seen that there is no characteristic sharp peak but a broad peak at 10° to 30°, which is representing the amorphous structure of the methyl green thin film and also defines a successful deposition of thin film by comparing previously found XRD pattern of methyl green.26The optical absorption properties of the thin film of methyl green, UV Vis characterization, is shown in Fig. 5. A peak between 320 to 400 nm, which indicated that the sample of methyl green is a good absorber of UV-A (known black-light or long-wave UV).27 The efficient absorption of light by methyl green in the visible region indicates that it may also be used for light sensing or solar cell applications.
Surface and hygroscope properties of thin-film are used to determine the sensor performance.28 In the following research work, surface, morphology was studied using the FESEM technique. Fig. 6(A) was taken at 50![[thin space (1/6-em)]](https://www.rsc.org/images/entities/char_2009.gif) 000× magnification with the scale bar indicating 1 μm. A number of nanostructures with hexagonal shapes, which are distributed with indiscriminate directions can be observed. Voids, which will perform an imperative role in the absorption of water molecules were also seen.29 Fig. 6(B) was taken at 100
000× magnification with the scale bar indicating 1 μm. A number of nanostructures with hexagonal shapes, which are distributed with indiscriminate directions can be observed. Voids, which will perform an imperative role in the absorption of water molecules were also seen.29 Fig. 6(B) was taken at 100![[thin space (1/6-em)]](https://www.rsc.org/images/entities/char_2009.gif) 000× magnification with the scale bar indicating 500 nm, which expresses the average size of these nanostructures that is about 100 nm. The SEM of methyl green sensing film showed an irregular surface with large numbers of voids. Such a type of microstructured morphology allows greater ambient water/humidity molecule exposure, which will enhance the sensing property of the sensing film.30
000× magnification with the scale bar indicating 500 nm, which expresses the average size of these nanostructures that is about 100 nm. The SEM of methyl green sensing film showed an irregular surface with large numbers of voids. Such a type of microstructured morphology allows greater ambient water/humidity molecule exposure, which will enhance the sensing property of the sensing film.30
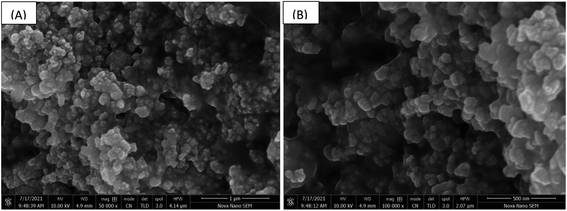 | ||
Fig. 6 (A) SEM of methyl green at 50![[thin space (1/6-em)]](https://www.rsc.org/images/entities/char_2009.gif) 000× magnifications and (B) SEM of methyl green at 100 000× magnifications and (B) SEM of methyl green at 100![[thin space (1/6-em)]](https://www.rsc.org/images/entities/char_2009.gif) 000× magnifications. 000× magnifications. | ||
3.1 Capacitance
The capacitance of the methyl green-based humidity sensor was measured at changed frequencies, such as 1, 10 and 100 kHz by varying humidity from 32 to 85%. It is detected that capacitance increases with increased RH%. At low or initial relative humidity, i.e., 32-RH%, the capacitance for all frequencies is small and about flat curve was obtained with small variations. But, above 60-RH%, the capacitance starts to increase because at this stage there was an increase in the absorption of humidity on the sensing film of the methyl green. So, the immobile layer of the sensing film transforms into the mobile layer.31 The increase in capacitance is expressed as that capacitance is directly proportional to humidity absorption by the sensor. The capacitance of the humidity sensor consists of ‘εd’ dielectric permittivity of methyl green thin film, vacuum permittivity ‘ε0’, distance between ‘Al’ electrodes ‘d’ and area of electrodes ‘A’.
 | (1) |
The capacitance of the sensor varies on varying the %RH level; therefore it can be safely attributed to some aspects as follows: (a) thin film surface morphology (b) water dielectric constant (c) sensing material polarizability and (d) constant area, i.e., distance between sensing material and electrodes.
Water has 80% relative permittivity that is more than that of organic semiconductors.32 Because of such high dielectric permittivity of water, detecting film has significantly high dielectric permittivity. The difference of dielectric permittivity of humid and dry detecting film is the source of the detecting/sensing process of the capacitance of the sensor. The capacitance is the right source to investigate the sensing material's dielectric properties because each other is directly proportional. Theoretically, the relationship between capacitance and dielectrics constant under dry and humid conditions is defined as follows:33
 | (2) |
Here εh and εdare humid and dry sensing dielectric constants, similarly: Ch and Cd are capacitance values of humid and dry factors, correspondingly and ‘n’ is a morphology element of the dielectric. Humidity absorption on the sensing film was studied through hydrogen bonding with a weak VWI-van der Waals interaction of polymer molecules with humidity/water molecules.34 The water molecules' dipole movement changes in the effect of the outside electric field. So, the polarity of the molecule is written as follows:
| P = αE | (3) |
Here ‘P’ is polarity, ‘α’ is polarizability and ‘E’ is an external field. Sensing material polarizability is directly proportional to the dielectric constant of the sensing film.35 It may be electronic, dipolar, or ionic in nature.36 By using the Clausius Mosotti equation37 the relation is expressed as follows:
 | (4) |
Here ε0is a free space permittivity and εd is a relative permittivity. By using this equation we can write an equation of capacitance–humidity simulation.38 This is as follows:
 | (5) |
Here, Ch and Cd are capacitance values of humid and dry conditions, k is capacitive humidity factor having a value of 1.6 × 10⁻² (RH)−1 and H is a relative humidity level.
3.2 Resistance
Similar to capacitance, the resistance of the methyl green-based humidity sensor was measured at changed frequencies, such as 1, 10 and 100 kHz by varying humidity from 32 to 85%. It was observed that the resistance decreases with increased relative humidity RH%. At low or initial relative humidity, i.e., 32-RH%, the resistance for all frequencies have high variations. But above 60-RH%, the variation becomes very small and we get approximately flat curves because at this stage there was an increase in the absorption of humidity on the sensing film of the methyl green. The change in resistance is directly related to humidity absorption on the sensing film. The water/humidity molecules lead to an increase in charge carriers because these molecules work as dopants. Moreover, this absorption may also dissociate ions, which increases the conductivity of a material. Conductance is inversed by resistance, so, the resistance of the detecting film decreases as the conductivity increases.2 The resistance of the sensor depends on (a) the rate of water/humidity molecules' absorption on the sensing film (b) cross-section area of the sensing film ‘A’ (c) the conductivity of the sensing material ‘α’(d) the length of sensing film ‘l’. So, the relation between the conductivity and resistance is expressed as follows:
 | (6) |
As the concentration of humidity/water molecules increases in the methyl green thin film, it is the probability that first of all this concentration changes the surfaces resistance ‘Rs’ and then it changes the bulk resistance ‘Rs’.
3.3 Relationship between capacitance and resistance of the sensor
As the capacitance of the sensor is defined by C = Q/V, where ‘C’ is capacitance, ‘Q’ is charge and ‘V’ is applied voltage. Also, the resistance of the sensor is defined by V = IR, where ‘V’ is applied voltage, ‘I’ is current and ‘R’ is the resistance of the sensor. As we are dealing with the AC circuit so the impedance ‘Z’ w.r.t capacitance is as follows:| Z = 1/(j2πfC) | (7) |
Here f is the frequency, which is equal to f = ω/2π so (by ignoring the complex no. j =  )
)
| Z = 1/(ωC) | (8) |
As the resistance and impedance of the circuit are equal i.e. Z = R so
| R = 1/(ωC) | (9) |
If we choose a constant frequency then the relation is:
| R α 1/C | (10) |
This means that the capacitance and resistance of the humidity sensor are inversely proportional to each other. The proposed sensor is satisfying the following relation, i.e., at high resistance the capacitance is low and vice versa.
3.4 Response and recovery time of humidity sensor
Response/comeback and recover/repeat times of sensor consisted on methyl green thin were estimated through the dynamic investigation procedure. Fig. 7 is showing the graphs of the recovery and response time. The dynamic investigation was performed between two RH levels, i.e., the low level was 40% and the high level was 80%. The comeback times are time periods to attain about ninety-nine % of steady/stable values as soon as suddenly the sensor is put into a chamber full of water vapors/humidity.39 Same as the repeat time of the sensor is a time duration required to attain its initial value as humidity is removed. For dynamic investigation, a humidification and dehumidification cycle was studied at 100 KHz operational AC bias frequency (to avoid the complexity). In the following work, we found the response time of 200 s and recovery time of 60 s for the humidity sensor. For observing the repeatability, we repeated the cycle of humidification and dehumidification but we obtained the same values of response and recovery time for the proposed sensor.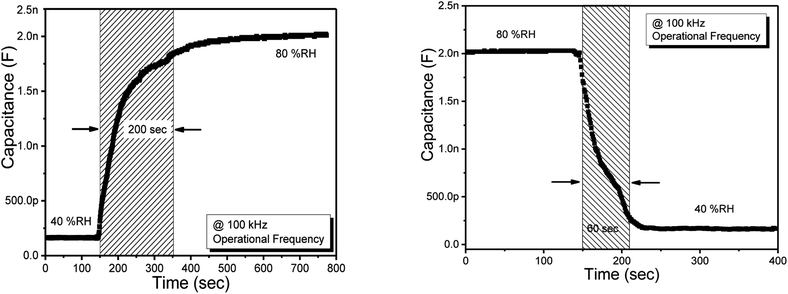 | ||
| Fig. 7 Response (left side) and recovery (right side) time of the humidity sensor based on methyl green. | ||
From Fig. 7, it is seen that the response time of the sensor is a bit high at about 200 s this is due to the surface morphology of the methyl green sensing film, i.e., the voids on the surface are very small having nanosize. So, the thin film takes more time for the absorption of water molecules/humidity drops, which is the reason for the high response time.
3.5 Sensitivity of humidity sensor
Sensitivity is the main characteristic of the sensor that is used to determine the transmission of the sensor. The sensitivity for both capacitance and resistance type at 1, 10 and 100 kHz is shown in Table 1. Moreover, we found better sensitivity than for the previously reported sensors.11–13| Frequencies | Band gap | Sensitivity | |
|---|---|---|---|
| For resistance (KΩ/% RH) | For capacitance (pF/% RH) | ||
| 1 kHz | 32–85% | 31.69 | 122.37 |
| 10 kHz | 32–85% | 28.51 | 91.30 |
| 100 kHz | 32–85% | 12.7 | 46.214 |
Similarly, the comparison of the proposed sensor with the previous study is shown in Table 2. From this table, it is seen that there are many sensors have low response and recovery time, but the sensitivity of our sensor is more than that of others.
| Nano-material | Response time | Recovery time | Band width | Sensitivity |
|---|---|---|---|---|
| α-Fe2O3 (ref. 40) | 60 s | 350 s | — | — |
| γ-Fe2O3 (ref. 41) | 150 s | 450 s | — | — |
| ZnO (ref. 42) | 36 s | 530 s | — | — |
| SnO2 (ref. 43) | 120–170 s | 20–60 s | 30–85% | About 2–33 RH% |
| Methyl red44 | 10 s | 10 s | 30–95% | 16.92 pF/% RH 0.307 MΩ/% RH |
| TDTBPPNI45 | 35 s | 57 s | 39–85% | 102.61 pF/% RH −333.07 KΩ/% RH |
| Multi-wall carbon nanotubes46 | 45 s | 15 s | 11–97% | 0.026 pF/% RH |
| Cobalt(II) phthalocyanine47 | — | — | 30–95% | 0.023 pF/% RH |
| Methyl green (present study) | 200 s | 60 s | 40–80% | 122.37 pF/% RH 31 KΩ/% RH |
3.6 Analysis of data (capacitance and resistance) through classical statistics
As mentioned above, we measured all readings in intervals. So, for the classical statistics technique, we have converted the readings of capacitance and resistance into the fixpoint values by taking the mean of the maximum and minimum values at each measured point of %RH with different frequencies, i.e., 1, 10, 100 kHz.For example, we have observed the value of capacitance [150, 170] with 32% RH at 1 kHz. As it is in interval form, so we convert it into a fixed point value, i.e., 160 by using the classical statistics mean formula. In this way, we apply classical statistics analysis on the measured values of capacitance and resistance w.r.t relative humidity %RH changing from 32 to 85% at 1, 10 and 100 kHz.
3.7 Analysis of data (capacitance and resistance) through neutrosophic statistics
For applying the neutrosophic statistics, we have developed the proper formula. For developing the formula first we see the preliminaries.Similarly, neutrosophic mean ȲN = [ȲL, ȲU] is defined as follows:
| ȲN = ȲL + ȲUIN; IN ∈ [IL, IU] | (11) |
| CN = CL + CUIN; IN ∈ [IL, IU] | (12) |
The above-described measurement CN ∈ [CL, CU] is an extension under the classical. The above equation consists of two parts, i.e., CL determined and CUIN indeterminate parts. Also, IN ∈ [IL, I] is known as indeterminacy interval. Moreover, the measurement CN ∈ [CL, CU] was reduced to the classical or determined part by choosing IL = 0.
For example, at 32% RH, we observed the value of capacitance as 150 and 170 at 1 kHz. So, here CL is equal to 150 and CU is equal to 170. Similarly, indeterminacy IL = 0 as mentioned above and IU can be found by IU = (CU − CL)/CU. So, the value of IU at a given capacitance interval is 0.118. The neutrosophic approach for the above capacitance interval is written as:
| C32%RHat1kHz = 150 + 170IN; IN ∈ [0, 0.118] | (13) |
If we choose IN = 0 then we gets a minimum value, i.e., 150, and if we choose IN = 0.118, we get a maximum value of 180, otherwise, we get a value between them. Similarly, we apply neutrosophic statistics on the measured values of capacitance w.r.t relative humidity %RH changing from 32 to 85% at 1, 10 and 100 kHz.
| RN = RL + RUIN; IN ∈ [IL, IU] | (14) |
The above-described measurement RN ∈ [RL, RU] is an extension under the classical. The above equation consists of two parts, i.e., RL determined and RUIN indeterminate part. Also IN ∈ [IL, IU] is known as indeterminacy interval. Moreover, the measurement RN ∈ [RL, RU] was reduced to the classical or determined part by choosing IL = 0.
For example, at 32% RH, we observed the values of resistance as 1430, 1930 at 1 kHz. So, here RL is equal to 1430 and RU is equal to 1930. Similarly, indeterminacy IL = 0 as mentioned above and IU can be found by IU = (RU − RL)/RU. So, the value of IU at a given resistance interval is 0.260. The neutrosophic approach for the above resistance interval is written as:
| R32%RHat1kHz = 1430 + 1930IN; IN ∈ [0, 0.260] | (15) |
If we choose IN = 0, then we get a minimum value, i.e., 1430, and if we choose IN = 0.260, we get a maximum value 1930, otherwise we get a value between them. Similarly, we apply neutrosophic statistics on the measured values of resistance w.r.t relative humidity %RH changing from 32 to 85% at 1, 10 and 100 kHz.
3.8 Comparison between classical analysis and neutrosophic analysis
The plots of capacitance and resistance measured value analyses through classical statistics are shown in Fig. 8 and 9, respectively.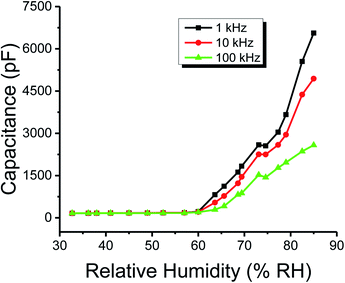 | ||
| Fig. 8 The capacitance of the humidity sensor based on methyl green at 1, 10 and 100 kHz operational frequencies. | ||
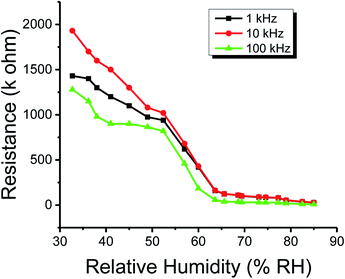 | ||
| Fig. 9 The resistance of the humidity sensor based on methyl green at 1, 10 and 100 kHz operational frequencies. | ||
Similarly, the plots of capacitance and resistance measured value analyses through neutrosophic statistics are shown in Fig. 10 and 11, respectively.
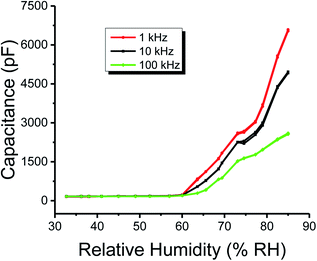 | ||
| Fig. 10 Neutrosophic graphs of the capacitance of the humidity sensor based on methyl green measured at 1, 10 and 100 kHz operational frequencies. | ||
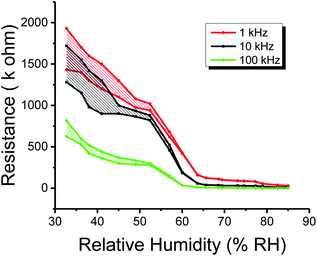 | ||
| Fig. 11 Neutrosophic graphs of resistance of the humidity sensor based on methyl green measured at 1, 10 and 100 kHz operational frequencies. | ||
From the classical graphs shown in Fig. 8 and 9, it is directly seen that resistance and the capacitance of the sensor are following the relation, as described in eqn (10) (section 3.3), i.e., the resistance and capacitance are inversely increased or decreased, respectively, to each other. Neutrosophic graphs are shown in Fig. 10 and 11, as can be seen, in Fig. 10 the capacitance from 32.5 to 60% RH is lower, this is because the neutrosophic statistics deal with the variation. In this region, the variation for all 1, 10 and 100 kHz is very small, so in the neutrosophic graph capacitance in this region looks the same. But in fact, the capacitance is increasing slowly w.r.t change in the relative humidity %RH. It is seen that resistance and capacitance have an inverse relationship as to where resistance has high variation capacitance, has small variations, and where capacitance has high variation resistance and has small variations.
Similarly, the stability of the proposed sensor was checked by varying the temperature. The sensor shows good stability for both the magnitude of resistance and capacitance with variation in temperature until 57 °C with a small change of about 1.5% (which can be negligible). But as the temperature increases, the values of both capacitance and resistance change about 2 times from initial.
Moreover, from the above graphs, a comparison between the neutrosophic and classical statistical analysis of capacitance and resistance of the humidity sensor can be made. It is seen that graphs of classical analysis are not much flexible because these graphs are drawn at fixed-point values. But graphs of the neutrosophic analysis show more flexibility. This means that neutrosophic statistics are more effective to analyze the capacitance and resistance of the said humidity sensor. As a result, it is found that neutrosophic statistics are informative, flexible and adequate than classical statistics.
4. Conclusions
A surface-type humidity sensor based on an organic semi-conductor methyl green thin film has been fabricated, whose capacitance and resistance have been studied. The sensor shows higher sensitivity. The capacitance and resistance of the sensors were measured w.r.t the variation in relative humidity (%RH) from 32 to 85% at 1, 10 and 100 kHz. These values were analyzed through classical statistics and neutrosophic statistics. It is observed that capacitance was increased but resistance was decreased with the increase in humidity absorption on sensing of the thin film. Moreover, it was observed that the analysis of capacitance and resistance of the humidity sensor through the neutrosophic statistics was informative, flexible and adequate than the analysis through classical statistics.Conflicts of interest
There are no conflicts to declare.Acknowledgements
The authors are deeply thankful to the editor and reviewers for their valuable suggestions to improve the quality of the paper.References
- Y. Zhang, et al., Zinc oxide nanorod and nanowire for humidity sensor, Appl. Surf. Sci., 2005, 242(1–2), 212–217 CrossRef CAS.
- N. M. Kiasari, et al., Room temperature ultra-sensitive resistive humidity sensor based on single zinc oxide nanowire, Sens. Actuators, A, 2012, 182, 101–105 CrossRef.
- I. Murtaza, et al., Humidity sensitive organic field effect transistor, J. Semicond., 2010, 31(5), 054001 CrossRef.
- K. S. Karimov, et al., Humidity sensing properties of Cu2O-PEPC nanocomposite films, J. Semicond., 2012, 33(7), 073001 CrossRef.
- Z. Chen and C. Lu, Humidity sensors: a review of materials and mechanisms, Sens. Lett., 2005, 3(4), 274–295 CrossRef CAS.
- C.-Y. Lee and G.-B. Lee, Humidity sensors: a review, Sens. Lett., 2005, 3(1–2), 1–15 CrossRef CAS.
- Z. Rittersma, Recent achievements in miniaturised humidity sensors—a review of transduction techniques, Sens. Actuators, A, 2002, 96(2–3), 196–210 CrossRef CAS.
- Y. Yao, et al., Graphene oxide thin film coated quartz crystal microbalance for humidity detection, Appl. Surf. Sci., 2011, 257(17), 7778–7782 CrossRef CAS.
- M. Saleem, et al., Synthesis and photocapacitive studies of Cu(II) 5,10,15,20-tetrakis(4′-isopropylphenyl)porphyrin, J. Optoelectron. Adv. Mater., 2008, 10(6), 1468 CAS.
- M. Hijikagawa, et al., A thin-film resistance humidity sensor, Sens. Actuators, 1983, 4, 307–315 CrossRef.
- M. I. Azmer, et al., Humidity sensor based on electrospun MEH-PPV:PVP microstructured composite, RSC Adv., 2016, 6(42), 35387–35393 RSC.
- M. T. S. Chani, et al., Humidity sensors based on aluminum phthalocyanine chloride thin films, Phys. E, 2012, 45, 77–81 CrossRef CAS.
- Z. Ahmad, et al., Integrated capacitive and resistive humidity transduction via surface type nickel phthalocyanine based sensor, Int. J. Electrochem. Sci., 2017, 12, 3012–3019 CrossRef CAS.
- F. Smarandache, Introduction to neutrosophic measure, neutrosophic integral, and neutrosophic probability, 2013, infinite study Search PubMed.
- J. Ye, Improved cosine similarity measures of simplified neutrosophic sets for medical diagnoses, Artif. Intell. Med., 2015, 63(3), 171–179 CrossRef PubMed.
- V. Christianto, R. N. Boyd and F. Smarandache, Three possible applications of neutrosophic logic in fundamental and applied sciences, 2020, infinite study Search PubMed.
- M. Aslam, Enhanced statistical tests under indeterminacy with application to earth speed data, Earth Sci. Inform., 2021, 1–7 Search PubMed.
- F. Smarandache, The Neutrosophic Research Method in Scientific and Humanistic Fields, 2010 Search PubMed.
- M. Aslam, A study on skewness and kurtosis estimators of wind speed distribution under indeterminacy, Theor. Appl. Climatol., 2021, 143(3), 1227–1234 CrossRef.
- F. Smarandache, Introduction to neutrosophic statistics: Infinite Study, Romania-Educational Publisher, Columbus, OH, USA, 2014 Search PubMed.
- J. Chen, J. Ye and S. Du, Scale effect and anisotropy analyzed for neutrosophic numbers of rock joint roughness coefficient based on neutrosophic statistics, Symmetry, 2017, 9(10), 208 CrossRef.
- J. Chen, et al., Expressions of rock joint roughness coefficient using neutrosophic interval statistical numbers, Symmetry, 2017, 9(7), 123 CrossRef.
- M. Aslam, Design of the Bartlett and Hartley tests for homogeneity of variances under indeterminacy environment, J. Taibah Univ. Sci., 2020, 14(1), 6–10 CrossRef.
- M. Aslam, On detecting outliers in complex data using Dixon's test under neutrosophic statistics, J. King Saud Univ. Sci., 2020, 32(3), 2005–2008 CrossRef.
- Q. Zafar, et al., Evaluation of humidity sensing properties of TMBHPET thin film embedded with spinel cobalt ferrite nanoparticles, J. Nanoparticle Res., 2016, 18(7), 1–12 CrossRef CAS.
- A. Ebrahiminezhad, et al., Green synthesis and characterization of zero-valent iron nanoparticles using stinging nettle (Urtica dioica) leaf extract, Green Process. Synth., 2017, 6(5), 469–475 CAS.
- Z. A. Hussein, S. K. Abbas and L. M. Ahmed, UV-A activated ZrO2 via photodecolorization of methyl green dye, in IOP Conference Series: Materials Science and Engineering, IOP Publishing, 2018 Search PubMed.
- M. Tahir, et al., Enhancement in the sensing properties of methyl orange thin film by TiO2 nanoparticles, Int. J. Mod. Phys. B, 2014, 28(5), 1450032 CrossRef.
- F. Muhammad, et al., Cadmium selenide quantum dots: Synthesis, characterization and their humidity and temperature sensing properties with poly-(dioctylfluorene), Sens. Actuators, B, 2019, 285, 504–512 CrossRef CAS.
- H. Farahani, R. Wagiran and M. N. Hamidon, Humidity sensors principle, mechanism, and fabrication technologies: a comprehensive review, Sensors, 2014, 14(5), 7881–7939 CrossRef PubMed.
- C.-L. Dai, A capacitive humidity sensor integrated with micro heater and ring oscillator circuit fabricated by CMOS–MEMS technique, Sens. Actuators, B, 2007, 122(2), 375–380 CrossRef CAS.
- R. M. Metzger, Unimolecular and Supramolecular Electronics I: Chemistry and Physics Meet at Metal-Molecule Interfaces, 2012, vol. 312, Springer Science & Business Media Search PubMed.
- J. Korvink, et al., Accurate 3D capacitance evaluation in integrated capacitive humidity sensors, Sens. Mater., 1993, 4, 323 CAS.
- M. Matsuguchi, et al., Characterization of polymers for a capacitive-type humidity sensor based on water sorption behavior, Sens. Actuators, B, 1998, 49(3), 179–185 CrossRef CAS.
- M. A. Omar, Elementary solid state physics: principles and applications, Pearson Education India, 1975 Search PubMed.
- M. Tahir, et al., Humidity, light and temperature dependent characteristics of Au/N-BuHHPDI/Au surface type multifunctional sensor, Sens. Actuators, B, 2014, 192, 565–571 CrossRef CAS.
- M. Shah, et al., Carbon nanotubes' nanocomposite in humidity sensors, Solid-State Electron., 2012, 69, 18–21 CrossRef CAS.
- P. Li, et al., Humidity sensor based on electrospun (Na0.5Bi0.5)0.94TiO3–Ba0.06TiO3 nanofibers, Ceram. Int., 2015, 41(10), 14251–14257 CrossRef CAS.
- A. Tripathy, et al., Role of morphological structure, doping, and coating of different materials in the sensing characteristics of humidity sensors, Sensors, 2014, 14(9), 16343–16422 CrossRef PubMed.
- R. G. Deshmukh, S. S. Badadhe and I. S. Mulla, Microwave-assisted synthesis and humidity sensing of nanostructured α-Fe2O3, Mater. Res. Bull., 2009, 44(5), 1179–1182 CrossRef CAS.
- P. V. Adhyapak, et al., Influence of Li doping on the humidity response of maghemite (γ-Fe2O3) nanopowders synthesized at room temperature, Ceram. Int., 2013, 39(7), 8153–8158 CrossRef CAS.
- Y. Qiu and S. Yang, ZnO nanotetrapods: controlled vapor-phase synthesis and application for humidity sensing, Adv. Funct. Mater., 2007, 17(8), 1345–1352 CrossRef CAS.
- Q. Kuang, et al., High-sensitivity humidity sensor based on a single SnO2 nanowire, J. Am. Chem. Soc., 2007, 129(19), 6070–6071 CrossRef CAS PubMed.
- Z. Ahmad, et al., Humidity-dependent characteristics of methyl-red thin film-based Ag/methyl-red/Ag surface-type cell, Phys. E, 2008, 41(1), 18–22 CrossRef CAS.
- Z. Farooq, et al., Investigation of relative humidity-sensing performance of capacitive and resistive type sensor based on TDTBPPNi metalloporphyrin dielectric layer, Bull. Mater. Sci., 2021, 44(2), 1–10 Search PubMed.
- W.-P. Chen, et al., A capacitive humidity sensor based on multi-wall carbon nanotubes (MWCNTs), Sensors, 2009, 9(9), 7431–7444 CrossRef CAS PubMed.
- T. Qasuria, et al., Poles apart gravity based planar organic multifunctional sensor using cobalt(II) phthalocyanine, Mater. Res. Express, 2019, 6(9), 095062 CrossRef CAS.
| This journal is © The Royal Society of Chemistry 2021 |

