 Open Access Article
Non-enzymatic electrochemical determination of salivary cortisol using ZnO-graphene nanocomposites†
Sherin Risonab,
Rijo Rajeevb,
Vinay S. Bhat c,
Agnus T. Mathewsb,
Anitha Varghese
 *b and
Gurumurthy Hegde
 *bd
*bd
aChrist Academy Institute For Advanced Studies, Christ Nagar, Bangalore, 560083, India
bDepartment of Chemistry, CHRIST (Deemed to be University), Bangalore, 560029, India. E-mail: anitha.varghese@christuniversity.in; murthyhegde@gmail.com
cCentre for Nano-materials and Displays, B.M.S College of Engineering, Bull Temple Road, Bangalore, 560019, India
dCentre for Advanced Research and Development (CARD), CHRIST (Deemed to be University), Bangalore, 560029, India
First published on 24th November 2021
Abstract
Electrochemically deposited ZnO nanoparticles on a pencil graphite electrode (PGE) coated with graphene generate a noteworthy conductive and selective electrochemical sensing electrode for the estimation of cortisol. Electrochemical techniques such as cyclic voltammetry (CV) analysis and electrochemical impedance spectroscopic (EIS) tests were adopted to analyze and understand the nature of the modified sensor. Surface morphological analysis was done using various spectroscopic and microscopic techniques like X-ray photoelectron spectroscopy (XPS), transmission electron microscopy (TEM), and scanning electron microscopy (SEM). Structural characterization was conducted by X-ray diffraction (XRD) and Fourier transform infrared spectroscopy (FTIR). The effect of scan rate, concentration, and cycle numbers was optimized and reported. Differential pulse voltammetric (DPV) analysis reveals that the linear range for the detection of cortisol is 5 × 10⁻¹⁰M − 115 × 10−10 M with a very low-level limit of detection value (0.15 nM). The demonstrated methodology has been excellently functional for the determination of salivary cortisol non-enzymatically at low-level concentration with enhanced selectivity despite the presence of interfering substances.
Introduction
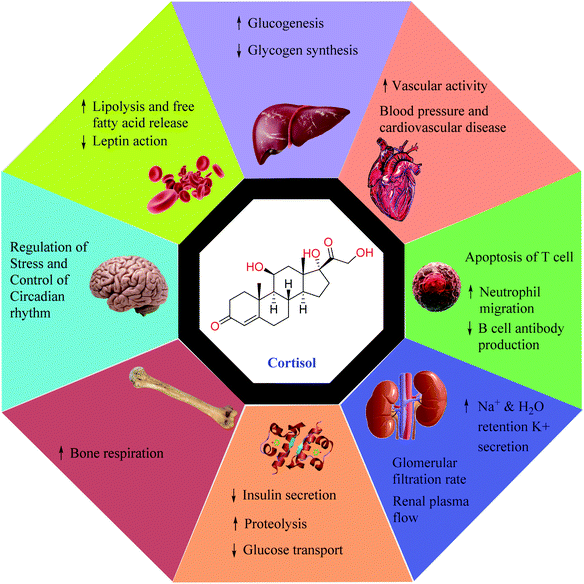
Cortisol, a glucocorticoid hormone synthesized by the adrenal gland has a prominent role in physiological processes such as energy metabolism, electrolytic balance, blood pressure, reproductive cycles, the stress-immune response, and carbohydrate metabolism.1,2 It is a life-sustaining adrenal hormone that is widely known as the body's stress hormone as its secretion can be generally influenced by psychological and physical stress.3,4 A very high concentration of cortisol in the human body can lead to Cushing's disease with the symptoms of obesity, fatigue, and bone fragility, whereas the lower levels of cortisol can trigger Addison's disease whose symptoms include weight loss, fatigue, and darkening of skin creases, folds, and scars.5 Cortisol can almost affect every organ system such as the musculoskeletal, cardiovascular, respiratory, endocrine, and nervous system since glucocorticoid receptors are present in almost all tissues in the body.6 Fig. 1 depicts some of the important physiological effects that cortisol has on the human body. Therefore, understanding abnormal levels of cortisol for developing highly sensitive sensors for its detection is highly recommended. The measurement of cortisol has been recently gaining attention from the scientific community to establish the utilization of cortisol variation as a precursor for studying psychological events namely stress, behavioral patterns, and post-traumatic stress disorder (PTSD).7 Presently, total cortisol, which is defined as the total of free and protein-bound fractions, is estimated in the healthcare system. However, it is the free cortisol, which is the biologically active fraction,8 liable for entire cortisol-associated actions in our body making its accurate diagnosis and treatment highly desirable for greater well-being.Presently various analytical methods such as fluorescent enzyme-linked immunosorbent assays (ELISA) or radioimmunoassay (RIA) have been used for the clinical study of cortisol.9–11 Additional techniques such as surface plasmon reference sensor (SPR) and electrochemical sensors have been reported to be effective in estimating cortisol.12,13 However, limitations associated with existing strategies such as being laborious, long-winded, a requirement of highly expensive laboratory techniques, and highly skilled experts have led to their underutilization. Also, most of the above-mentioned methods are not compatible with producing miniaturized automated systems for the healthcare industry. Therefore, the production of a facile, economic, electrochemical sensor with high sensitivity and selectivity is a pressing priority.
Significant reports exist in the literature for the detection of cortisol using enzymes like hydroxysteroid dehydrogenases (HSDs) and cytochrome P450s (CYPs).14,15 Several other interesting studies of cortisol detection techniques utilizing metalloporphyrins and multi-walled carbon nanotubes, nanocomposite functionalized electrodes, a paper-based analytical biosensor chip developed from graphene-nanoplatelet-amphiphilic-di-block-co-polymer composite, and a chemiresistor graphene oxide sensor has been reported.3,12,16,17 The complexity associated with these techniques creates a research gap which has eventually highlighted the attention of researchers. Electrochemical analysis on the other hand has various advantages over the conventional methods as it is economic, has low power consumption, can be easily modified, and adjusted according to our needs, and showcases ameliorated selectivity and sensitivity towards the analyte. In recent years, EIS and CV analysis have been reported to be highly effective in electrochemical sensing of cortisol.18,19 The cortisol molecule has 5 oxygen atoms in its molecular structure at carbon position numbers 3, 11, 17, 20, and 21 as hydroxyl or ketone group. (Fig. 2). In 2010, Goyal and co-workers reported that reduction of isolated keto group is preferable in keto steroids which have carbonyl group in conjugation with a double bond.20 Thus, in cortisol molecule, position C3 having isolated keto group is the preferable site for reduction (2e−, 2H+) and converts into a hydroxyl group.21
Various modifications such as doping, metallization, and functionalization of carbonaceous electrodes have been revealed to resolve the tedious electrode preparation and surface cleaning steps associated with conventional electrodes being Glassy carbon electrodes (GCE) and carbon paste electrodes (CPE).22–24 Among the various carbon-based electrodes, pencil graphite electrode (PGE) is acknowledged as an efficient and emerging concept for overcoming the limitations related to the conventional electrodes. When compared to their conventional counterparts, PGE has higher sensitivity, requires no pre-treatment, is economic, reliable, and allows ultra-level detection of various compounds with enhanced accuracy.
As a single atomic plane of honeycomb lattice with tight packing of carbon atoms, graphene has created a new focal point in the current scientific research. Graphene is contemplated as a prospective nanoscale building block for a variety of applications including gas sensors, field-effect transistors, and electromechanical resonators with its distinctive electronic properties originating because of the electron confinement.25 Graphene-modified electrodes were prepared by Kim et al. for the electrochemical detection of dopamine in the presence of ascorbic acid.26 Similarly, Jahani and co-workers employed NiO nanoparticles decorated on the graphene nanosheets modified screen-printed electrodes for selective detection of dopamine in presence of uric acid.27 Recently, non-precious metal oxide modifiers have been observed to extend their properties into the field of electrocatalytic reactions. Among the various metal oxide modifiers, ZnO nanoparticles have gained considerable attention in the field of electrochemical sensing due to their distinctive mechanical features and their non-toxic nature.28,29 Another study wherein ZnO nanoparticles were employed was in the development of a stable and sensitive electrochemical sensor based on ZnO nanoparticles, multi-walled carbon nanotubes (MWCNTs) on glassy carbon electrode towards the electrochemical sensing of epinephrine in human serum and pharmaceutical formulation. The developed sensor exhibited a linear dynamic range in the range of 0.4 μM to 2.4 μM with a detection limit of 0.016 μM.30 In another study, Shaikshavali and co-workers reported the fabrication of MWCNTs supported CuO–Au hybrid nanocomposite for the effective application towards the electrochemical determination of acetaminophen and 4-aminophenol with detection limits of 0.016 μM and 0.105 μM respectively.31 Palanisamy et al. reported a novel reduced graphene oxide/ZnO composite modified electrode for non-enzymatic H2O2 sensing.32
In this present investigation, the authors have reported a facile, economic, and highly efficient electrochemical sensor for quantitative analysis of cortisol in human saliva. The constructed electrochemical sensor design involves a combination of electrochemically deposited ZnO nanoparticles on graphene-coated pencil graphite electrodes that under optimum conditions were utilized for selective and sensitive nanomolar level detection of cortisol.
Results and discussion
Fabrication and electrochemical studies of ZnO/GR/PGE
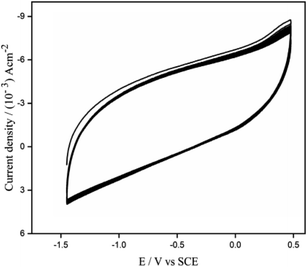
ZnO was electrochemically deposited on GR/PGE by a cyclic voltammetric technique using 0.01 M KNO3 containing 0.01 M ZnO3, sweeping the potential between −1.5 V to 0.55 V at 50 mV s−1 for 15 cycles (Fig. 3.) giving the reduction peak at −0.77 V. It can be observed that the cathodic deposition of ZnO nanoparticle from zinc nitrate solution has occurred by virtue of the following mechanistic pathway.33| Zn(NO3)2 → Zn2+ + 2NO3− | (1) |
| 2NO3− + H2O + 2e− → NO2− + 2OH− | (2) |
| Zn2+ + 2OH− → Zn(OH)2 | (3) |
| Zn(OH)2 → ZnO + H2O | (4) |
 | ||
| Fig. 3 CV profile depicting the electrodeposition of ZnO on GR/PGE electrode by 15 cycles in ZnNO3 (0.01 M) and KNO3 (0.01 M) underscan rate of 0.05 V s−1. | ||
In the above mechanism Zn(NO3)2 solution acts as the precursor to both zinc and oxygen. Nitrate ions furnished from eqn (1) gets electrochemically reduced to nitrite ion (eqn (2)). Zn2+ ions adsorbed onto the surface of the substrate electrode catalyze this cathodic reaction and liberates hydroxide anions. The Zn2+ ions finally precipitate along with the hydroxide ions leading to the production of zinc hydroxide which eventually dehydrates into zinc oxide. The above-mentioned multi-step reactions are summarized and given below as eqn (5)
| Zn2+ + NO3− + 2e− → ZnO + NO2− | (5) |
The electrochemical performance of [Fe(CN)6]4−/[Fe(CN)6]3− on bare and modified were analyzed at 50 mV s−1 (Fig. 4). The cyclic voltammetric data was used to estimate the active surface area of the electrode under study. A plot of anodic peak current vs. (scan rate)1/2 was generated. The electrode surface area was then calculated by means of the Randles–Sevcik eqn (6) using the slopes, concentration, and diffusion coefficient ((6.70 ± 0.02) × 10−6 cm2 s−1).34
| ip = 2.69 × 10⁵ ADo1/2n3/2ν1/2C | (6) |
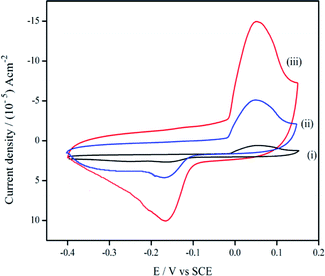 | ||
| Fig. 4 CV plot of 1 mM potassium ferro/ferricyanide in 1 M KCl at (i) bare PGE, (ii) GR/PGE, and (iii) ZnO/GR/PGE electrodes. | ||
EIS is considered a highly efficient method utilized for portraying the interfacial properties of electrodes. The Nyquist impedance plots of modified and bare PGE in 1 mM potassium ferro/ferricyanide is given in Fig. S1.† The bare PGE shows very high charge transfer resistance, Rct of 2100.4 Ω which implies lowered conductivity and weakened sensitivity of PGE. On modification with graphene, the Rct value was reduced to 998.5 Ω indicating the improved conductive nature. With the subsequent electrodeposition with ZnO, the modified electrode ZnO/GR/PGE shows an increase in conductivity with the drastically reduced Rct value, 29.62 Ω. The outcome derived from EIS studies indicates the effectiveness of the electrochemical modification technique of bare PGE with graphene and ZnO, which increased the conductivity towards the electrochemical oxidation of K4[Fe(CN)6]/K3[Fe(CN)6]. The preliminary outcomes acquired suggest that the modified electrode can become an effective substrate for cortisol oxidation electrocatalytically.
Physico-chemical characterization of the modified electrode
![[double bond, length as m-dash]](https://www.rsc.org/images/entities/char_e001.gif) C in an aromatic ring. The sp2 CH stretching peak of the aromatic ring is evident at 2850 cm−1. The presence of the metal oxide group was proved by the new peak at 472 cm−1 in ZnO/GR/PGE. In addition, the new peak also indicates the Zn–O–C vibrational mode as a part of an interaction between ZnO and the carbon atom of GR.
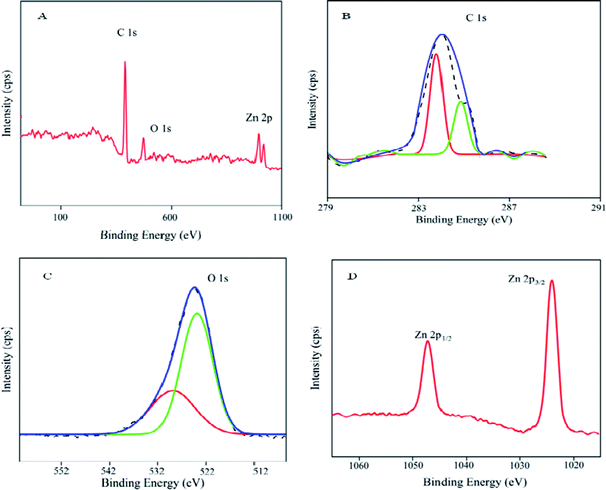
C in an aromatic ring. The sp2 CH stretching peak of the aromatic ring is evident at 2850 cm−1. The presence of the metal oxide group was proved by the new peak at 472 cm−1 in ZnO/GR/PGE. In addition, the new peak also indicates the Zn–O–C vibrational mode as a part of an interaction between ZnO and the carbon atom of GR.![[double bond, length as m-dash]](https://www.rsc.org/images/entities/char_e001.gif) C bonds respectively. The O 1s core level spectrum proves the appearance of Zn oxides, as observed in Fig. 6C. The existence of O2− and the bond between Zn and O is also confirmed by the peak at 528.7 eV. The O 1s spectra were fitted with Gaussian function, which deconvoluted into two peaks at 528.7 and 529.9 eV.
C bonds respectively. The O 1s core level spectrum proves the appearance of Zn oxides, as observed in Fig. 6C. The existence of O2− and the bond between Zn and O is also confirmed by the peak at 528.7 eV. The O 1s spectra were fitted with Gaussian function, which deconvoluted into two peaks at 528.7 and 529.9 eV.
The peak observed at 528.7 eV can be ascribed to the lattice oxygen binding to zinc in the form of Zn–O while the peak observed at 529.9 eV could be associated with the oxygen vacancy defects. Fig. 6D of Zn 2p. XPS spectra reveal core level spin orbits peak at 1045.2 and 1022.2 eV, each of which corresponds to Zn 2p1/2 and Zn 2p3/2 peaks of ZnO respectively. The two peaks are separated by a spin-energy separation of ∼23 eV which agrees with the documented data in Zn 2p1/2 and Zn 2p3/2 of ZnO.
Electrocatalytic oxidation of cortisol at different electrodes
The electrochemical determination of cortisol at bare PGE, GR/PGE, and ZnO/GR/PGE were studied by means of CVs. The tests were conducted at a scan rate of 50 mV s−1 in PBS (pH 7). Fig. 7 indicates that the current response to bare (i) and GR/PGE (ii) electrodes is relatively lower, while a wide cyclic voltammogram (iii) was observed in case ZnO/GR/PGE.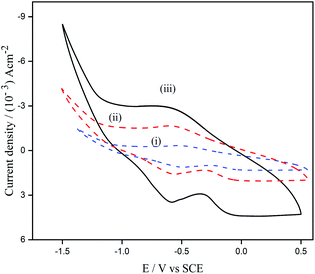 | ||
| Fig. 7 Cyclic voltammogram of cortisol detection at (i) bare PGE, (ii) GR/PGE, and (iii) ZnO/GR/PGE in PBS (pH 7) anodic peak. | ||
Cortisol did not give a strong current signal at GR/PGE and bare PGE whereas in ZnO/GR/PGE cortisol has given a significant lift in the current peak at −0.58 V, representing improved electron transfer kinetic rates at ZnO/GR/PGE. The presence of high-energy electro-active surface sites created by ZnO deposited GR/PGE attracted cortisol molecules to the electrode surface. Schematic representation of the electrocatalytic determination of cortisol at ZnO/GR/PGE is given in Fig. 8. The electrocatalytic efficiency of modified senor was revealed to be improvised with the increased electro-active surface area through the metal oxide deposition. As explained by Goyal and co-workers the carbonyl group present at the carbon number 3 position was reduced to the hydroxyl group (Fig. 2). Different electrochemical and physical characterization studies conducted showcase that ZnO/GR/PGE has improved roughness and surface defects and due to the same reason the ZnO/GR/PGE attracts the analyte towards its surface resulting in the enhancement of the cathodic current response.
Optimisation of operational parameters
Fig. 4SA† represents cyclic voltammograms of 6 nM cortisol at ZnO/GR/PGE at different scan rates in the range from 0.01 V s−1 to 0.10 V s−1 in PBS pH 7. A linear increase of the reduction peak current of cortisol with scan rate was observed. When the logarithm of peak currents was plotted against the logarithm of scan rates a straight-line plot was produced which confirms the involvement of an electrode mechanism based on diffusion-controlled (Fig. 4SB†).
log![[thin space (1/6-em)]](https://www.rsc.org/images/entities/char_2009.gif) ipa (μA) = 0.3981 ipa (μA) = 0.3981![[thin space (1/6-em)]](https://www.rsc.org/images/entities/char_2009.gif) log log![[thin space (1/6-em)]](https://www.rsc.org/images/entities/char_2009.gif) υ (V s−1) − 2.1324; (R2 = 0.9280) υ (V s−1) − 2.1324; (R2 = 0.9280)
| (7) |
The involvement of 2 electrons in the electro-catalytic determination of cortisol can be derived using eqn (8),
| Ep − Ep/2 = 0.0564/n | (8) |
The application of CV analysis was also effective in identifying the number of cycles required to deposit ZnO on GR/PGE for the electrochemical determination of cortisol. The CV profile of cortisol estimation at different intervals between 1 to 15 cycles has been plotted in Fig. 5S.† The cathodic peak current of cortisol was observed to rise when the number of cycles was increased for the deposition of ZnO on GR/PGE. The peak current response remained constant after 15 cycles; hence 15 cycles were fixed to be optimal for efficient ZnO deposition on GR/PGE for cortisol determination.
Analytical parameters
The linearity range, detection limit (LOD), and limit of quantitation (LOQ) were measured to authenticate the cortisol estimation process. Differential Pulse Voltammetry (DPV) studies indicate a significant cathodic peak current at −0.58 V (Fig. 9A). The reduction current peak value was observed to rise as the concentration of cortisol was increased (5 × 10⁻¹⁰ M − 115 × 10−10 M). The linearity calibration curve for the cortisol quantification is exhibited in Fig. 9B. The linear regression equation is as follows:| ipa (mA) = 3.39869 × 10⁻⁴ [cortisol] − 0.00419 (R2 = 0.9963) |
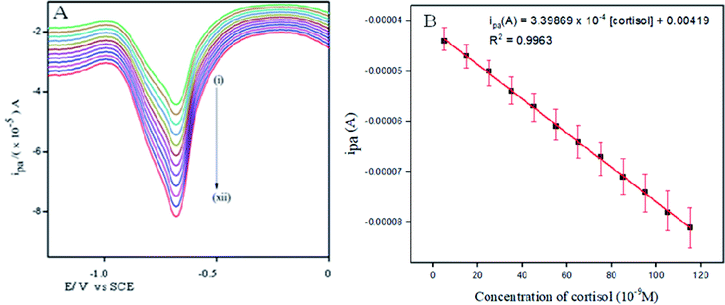 | ||
| Fig. 9 DPVs of cortisol at different concentrations from (i) 5 × 10⁻¹⁰ M to (xii) 115 × 10−10 M in the potential range −1.55 V–0.0 V vs. SCE in PBS (pH 7.0). | ||
The proposed method was estimated to have a sensitivity of 339![[thin space (1/6-em)]](https://www.rsc.org/images/entities/char_2009.gif) 869 μA μM−1 cm−2. LOD and LOQ values were obtained using the statistical formulae 3σ/S and 10σ/S respectively, where S being the slope of the calibration curve and σ is the standard deviation of the peak current observed at more than one analyte concentration. The LOD and LOQ values for the cortisol determination were revealed to be 0.15 nM and 0.5 nM respectively.
869 μA μM−1 cm−2. LOD and LOQ values were obtained using the statistical formulae 3σ/S and 10σ/S respectively, where S being the slope of the calibration curve and σ is the standard deviation of the peak current observed at more than one analyte concentration. The LOD and LOQ values for the cortisol determination were revealed to be 0.15 nM and 0.5 nM respectively.
Interference studies
The selectivity of modified electrode ZnO/GR/PGE towards the electrocatalytic determination of cortisol (6 nM) in PBS pH 7 was explored against the common interfering substance such as LDL, ascorbic acid, lactic acid, uric acid, urea, and glucose. As given in Fig. 6S,† the reduction peak current along with the interfering substances demonstrate less than 5% variation from that of cortisol. Thus, the modified PGE performed well towards the sensing of an analyte with not much interference from those closely related interferents. Moreover, the proposed methodology was validated by estimating cortisol in human saliva. The amount of cortisol in the real samples was measured employing the DPV technique with the standard addition method. The spiked cortisol sample was diluted in PBS (pH 7.0) and a sufficient portion was employed for the estimation. A significant reduction peak of cortisol was seen at ∼−0.58 V on the DPV profile during the real sample analysis (Table 1). The percentage of recovery was found between 99.3% to 100% with a minimum value of Relative Standard Deviation (RSD). A comparative study of linear range and limit of detection for the determination of cortisol has been provided in Table 1S.† The same was investigated utilizing ELISA assay. An acceptable concordance in result occurred between the electrochemical studies and ELISA analysis.| Cortisol added μg ml−1 | Expected μg ml−1 | Cortisol founda μg ml−1 | Recovery (%) | Relative error (%) | RSDa (%) | Cortisol found by ELISA | RSDa (%) |
|---|---|---|---|---|---|---|---|
| a Mean value obtained for five determinations. | |||||||
| 0 | 4.73 | 4.75 | |||||
| 5 | 9.73 | 9.68 | 99.4 | 0.42 | 1.03 | 9.69 | 1.02 |
| 10 | 14.73 | 14.75 | 100.0 | −0.13 | 1.14 | 14.74 | 1.15 |
| 15 | 19.73 | 19.60 | 99.3 | 0.76 | 1.18 | 19.62 | 1.17 |
Reproducibility and stability
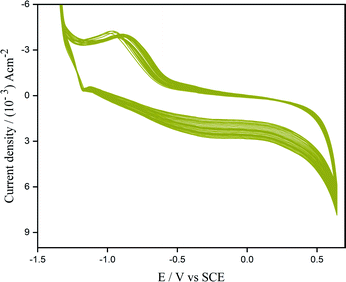
The reproducibility of the prepared electrode was investigated by fabricating five modified electrodes and analyzing their electrochemical response towards cortisol (6 nM) detection, for 30 days with 5 days of interval (Table 2S†). The study conducted could explain that the ZnO/GR/PGE was stable for a longer time and the reproducibility of ZnO/GR/PGE for cortisol analysis was also observed to be satisfactory. The stability of ZnO/GR/PGE was analyzed by investigating the steadiness of the modified electrode after continuous 50 cycles of scanning in PBS electrolyte of pH 7 (Fig. 10). A reduction by only less than 3.3% in cyclic voltammetric response of the modified electrode could substantiate the profound stability of ZnO/GR/PGE.Experimental procedure
![[thin space (1/6-em)]](https://www.rsc.org/images/entities/char_2009.gif) :
:![[thin space (1/6-em)]](https://www.rsc.org/images/entities/char_2009.gif) 1) acids H2SO4
1) acids H2SO4![[thin space (1/6-em)]](https://www.rsc.org/images/entities/char_2009.gif) :
:![[thin space (1/6-em)]](https://www.rsc.org/images/entities/char_2009.gif) HNO3 for 48 hours followed by cleaning with a plentiful quantity of water and dried at 120 °C for 4 hours in an oven. The dried graphene was exfoliated at 800 W for 20 seconds in small portions in a microwave oven followed by a solvent purification process in a mixture of acetone: dimethyl sulfoxide: water in a 5
HNO3 for 48 hours followed by cleaning with a plentiful quantity of water and dried at 120 °C for 4 hours in an oven. The dried graphene was exfoliated at 800 W for 20 seconds in small portions in a microwave oven followed by a solvent purification process in a mixture of acetone: dimethyl sulfoxide: water in a 5![[thin space (1/6-em)]](https://www.rsc.org/images/entities/char_2009.gif) :
:![[thin space (1/6-em)]](https://www.rsc.org/images/entities/char_2009.gif) 2
2![[thin space (1/6-em)]](https://www.rsc.org/images/entities/char_2009.gif) :
:![[thin space (1/6-em)]](https://www.rsc.org/images/entities/char_2009.gif) 3 ratio. The crude exfoliated graphite was then mixed and subjected to sonication for 4 hours to get a 3–6-layer graphene. The above-mentioned process was repeated to trim down the graphene layer for achieving improved-quality graphene.25,35–37
3 ratio. The crude exfoliated graphite was then mixed and subjected to sonication for 4 hours to get a 3–6-layer graphene. The above-mentioned process was repeated to trim down the graphene layer for achieving improved-quality graphene.25,35–37Graphene synthesized by the exfoliation method was brush coated on the electrode substrate surface for the formation of GR/PGE. Afterward, polyvinylidene fluoride (PVDF) and N-methyl-2pyrrolidene (NMP) solvent were utilized for making graphene into a paste for brush coating. PGE brush coated with graphene (95%) was then placed in hot air for 24 hours. The cyclic voltammetric technique was adopted for the electrochemical deposition of ZnO, by changing the potential from −1.5 V to 0.55 V at a scan rate of 50 mVs−1 for 15 cycles in a 0.01 M ZnNO3 solution in 0.01 M KNO3. Once deposition was performed, excess ZnO adsorbed on the electrode surface was rinsed with distilled water and then dried.
Experimental method for electrocatalytic detection of cortisol by ZnO/GR/PGE
The performance of bare PGE, GR/PGE, and ZnO/GR/PGE towards electrocatalytic detection of cortisol (6 nM) was investigated by CV at a scan rate of 50 mV s−1 in PBS pH 7 electrolyte within the potential range −1.75 to 0.55 V. DPV analysis in a potential range of −1.55–0.55 V was used for cortisol quantification, at pulse amplitude-50 mV, pulse width −60 ms with a 0.5 s pulse period. The cathodic current density of cortisol was measured using DPV and a calibration plot for sensing of cortisol was also generated. Characterization studies of modified electrode after their use is given in Fig. 7S.†Cortisol reference sample and human saliva sample preparation
Conclusion
Quantitative analysis of cortisol in human saliva was successfully performed by the proposed facile and selective non-enzymatic electrochemical technique. The electrocatalytic action of ZnO deposited graphene-covered PGE improved with the increase in electroactive surface area of the modified electrode. The ZnO/GR/PGE favors the electrocatalytic detection of cortisol at −0.58 V that promotes the enhanced electron transfer kinetic rates at the ZnO/GR/PGE. Moreover, the deposition of ZnO onto the GR/PGE leads to the generation of high-energy electro-active surface sites resulting in attracting cortisol molecules towards the electrode surface. The proposed method is capable of an accurate nanomolar level detection of cortisol using ZnO/GR/PGE even in the presence of associated biomolecules. This method was well employed to estimate cortisol in saliva samples and was validated using a standard ELISA assay.Funding sources
The authors are thankful to CeNSe, IISc, Bengaluru for providing XPS and TEM analysis. We also thank CHRIST (Deemed to be University) for providing the necessary facilities to conduct this work.Author contributions
Sherin Rison: conceptualization, methodology, investigation, data curation, writing – original draft, Writing – review and editing. Rijo Rajeev: methodology, formal analysis, writing – review and editing. Vinay S Bhat: data curation, writing – original draft. Agnus T Mathews: writing – review and editing Anitha Varghese: writing – original draft, writing – review and editing, visualization, supervision, Gurumurthy Hegde: writing – review and editing, visualization, project administration.Conflicts of interest
The authors declare that they have no known competing financial interests or personal relationships that could have appeared to influence the work reported in this paper.References
- Y. H. Kim, K. Lee, H. Jung, H. K. Kang, J. Jo, I. K. Park and H. H. Lee, Biosens. Bioelectron., 2017, 98, 473–477, DOI:10.1016/j.bios.2017.07.017.
- R. Fraser, M. C. Ingram, N. H. Anderson, C. Morrison, E. Davies and J. M. C. Connell, Hypertension, 1999, 33, 1364–1368, DOI:10.1161/01.HYP.33.6.1364.
- D. S. Charney, Am. J. Psychiatry, 2004, 161, 195–216, DOI:10.1176/appi.ajp.161.2.195.
- Z. Djuric, C. E. Bird, A. Furumoto-Dawson, G. H. Rauscher, M. T. Ruffin, I. V. R. P. Stowe, K. L. Tucker and C. M. Masi, Open Biomarkers J., 2008, 1, 7–19, DOI:10.2174/1875318300801010007.
- B. S. McEwen, J. Clin. Endocrinol. Metab., 2002, 87, 1947–1948, DOI:10.1210/jcem.87.5.9999.
- H. Yaribeygi, Y. Panahi, H. Sahraei, T. P. Johnston and A. Sahebkar, EXCLI J., 2017, 16, 1057–1072, DOI:10.17179/excli2017-480.
- D. Delahanty, A. Raimonde and E. Spoonster, Biol. Psychiatry, 2000, 48, 940–947, DOI:10.1016/s0006-3223(00)00896-9.
- C. W. le Roux, G. A. Chapman, W. M. Kong, W. S. Dhillo, J. Jones and J. Alaghband-Zadeh, J. Clin. Endocrinol. Metab., 2003, 88, 2045–2048, DOI:10.1210/jc.2002-021532.
- J. G. Lewis and P. A. Elder, J. Steroid Biochem., 1985, 22, 673–676, DOI:10.1016/0022-4731(85)90222-5.
- L. Manenschijn, J. W. Koper, S. W. Lamberts and E. F. van Rossum, Steroids, 2011, 76, 1032–1036, DOI:10.1016/j.steroids.2011.04.005.
- K. Sun, N. Ramgir and S. Bhansali, Sens. Actuators, B, 2008, 133, 533–537, DOI:10.1016/j.snb.2008.03.018.
- J. S. Mitchell, T. E. Lowe and J. R. Ingram, Analyst, 2009, 134, 380–386, 10.1039/b817083p.
- P. Zucca, C. Neves, M. Simões, M. Neves, G. Cocco and E. Sanjust, Molecules, 2016, 21, 964, DOI:10.3390/molecules21070964.
- T. Shingaki, K. Miura, T. Higuchi, M. Hirobe and T. Nagano, Chem. Commun., 1997, 7, 861–862, 10.1039/A700096K.
- H. Wu, S. Fan, X. Jin, H. Zhang, H. Chen, Z. Dai and X. Zou, Anal. Chem., 2014, 86, 6285–6290, DOI:10.1021/ac500245k.
- T. M. B. F. Oliveira, M. Fá Tima Barroso, S. Morais, P. De Lima-Neto, A. N. Correia, M. B. P. P. Oliveira and C. Delerue-Matos, Talanta, 2013, 106, 137–143, DOI:10.1016/j.talanta.2012.12.017.
- S. K. Tuteja, C. Ormsby and S. Neethirajan, Nano-Micro Lett., 2018, 10, 1–10, DOI:10.1007/s40820-018-0193-5.
- M. Sekar, M. Pandiaraj, S. Bhansali, N. Ponpandian and C. Viswanathan, Sci. Rep., 2019, 9, 1–14, DOI:10.1038/s41598-018-37243-w.
- B. A. Cardinell, M. L. Spano and J. T. L. Belle, Crit. Rev. Bioeng., 2019, 47, 207–215, DOI:10.1615/CritRevBiomedEng.2019026109.
- R. N. Goyal, S. Chatterjee and A. R. S. Rana, Talanta, 2010, 83, 149–155, DOI:10.1016/j.talanta.2010.08.054.
- H. S. De Boer, J. Den Hartigh, H. H. J. L. Ploegmakers and W. J. Van Oort, Anal. Chim. Acta, 1978, 102, 141–155, DOI:10.1016/S0003-2670(01)93468-3.
- A. Rana and A. N. Kawde, J. Chin. Chem. Soc., 2016, 63, 668–676, DOI:10.1002/jccs.201600119.
- S. Sharma, R. Jain and A. N. Raja, JES, 2020, 167, 037501–037510, DOI:10.1149/2.0012003JES.
- F. Azadmehr and K. Zarei, Bioelectrochem, 2019, 127, 59–67, DOI:10.1016/j.bioelechem.2019.01.001.
- S. Rison, K. B. Akshaya, V. S. Bhat, G. Shanker, T. Maiyalagan, E. K. Joice, G. Hegde and A. Varghese, Electroanal, 2020, 32, 2128–2136, DOI:10.1002/elan.202000049.
- Y. R. Kim, S. Bong, Y. J. Kang, Y. Yang, R. K. Mahajan, J. S. Kim and H. Kim, Biosens. Bioelectron., 2020, 25, 2366–2369, DOI:10.1016/j.bios.2010.02.031.
- S. Jahani and H. Beitollahi, Electroanal, 2016, 28, 2022–2028, DOI:10.1002/elan.201501136.
- S. K. Arya, S. Saha, J. E. Ramirez-Vick, V. Gupta, S. Bhansali and S. P. Singh, Anal. Chim. Acta, 2012, 737, 1–21, DOI:10.1016/j.aca.2012.05.048.
- S. Madhu, A. J. Anthuuvan, S. P. Ramasamy, P. Manickam, S. Bhansali, P. Nagamony and V. Chinnuswamy, ACS Appl. Electron. Mater., 2020, 2, 499–509, DOI:10.1021/acsaelm.9b00730.
- P. Shaikshavali, T. M. Reddy, T. V. Gopal, G. Venkataprasad, V. S. Kotakadi, V. N. Palakollu and R. Karpoormath, Colloids Surf., A, 2020, 584, 124038–124049, DOI:10.1016/j.colsurfa.2019.124038.
- P. Shaikshavali, T. Madhusudana Reddy, V. N. Palakollu, R. Karpoormath, Y. Subba Rao, G. Venkataprasad, T. V. Gopal and P. Gopal, Synth. Met., 2019, 252, 29–39 CrossRef CAS.
- S. Palanisamy, S. M. Chen and R. Sarawathi, Sens. Actuators, B, 2012, 166, 372–377, DOI:10.1016/j.snb.2012.02.075.
- S. Dai, Y. Li, Z. Du and K. R. Carter, JES, 2013, 160, D156–D162, DOI:10.1149/2.064304jes.
- S. Rison, K. B. Akshaya, A. T. Mathew, E. K. Joice, A. Varghese and L. George, SN Appl. Sci., 2020, 2, 1–10, DOI:10.1007/s42452-020-03540-1.
- W. S. Hummers and R. E. Offeman, J. Am. Chem. Soc., 1952, 80, 1339, DOI:10.1021/ja01539a017.
- M. S. Dresselhaus and G. Dresselhaus, Adv. Phy., 2002, 51, 1–186, DOI:10.1080/00018730110113644.
- J. Wu, W. Pisula and K. Mullen, Chem. Rev., 2007, 107, 718–747, DOI:10.1021/cr068010r.
- Saliva Collection Handbook – Salimetrics, https://www.salimetrics.com/salivacollection-handbook/, accessed 23 August, 2018 Search PubMed.
Footnote |
| † Electronic supplementary information (ESI) available. See DOI: 10.1039/d1ra07366d |
| This journal is © The Royal Society of Chemistry 2021 |

