 Open Access Article
Effect of the electron donating group on the excited-state electronic nature and epsilon-near-zero properties of curcuminoid-borondifluoride dyes†
Kyu-Ri Choia,
Dae Hyeon Kima,
Yeon Ui Leeb,
Virginie Placidea,
Steven Huynha,
Dandan Yaoc,
Gabriel Canard c,
Elena Zaborovac,
Fabrice Mathevetd,
Loïc Magere,
Benoît Heinrich
 e,
Jean-Charles Ribierref,
Jeong Weon Wu*a,
Frédéric Fages
 *c and
Anthony D'Aléo*ce
aDepartment of Physics, Ewha Womans University, Seoul 03760, Republic of Korea. E-mail: jwwu@ewha.ac.kr
bDepartment of Physics, Chungbuk National University, Chungbuk 28644, Republic of Korea
cAix Marseille Univ, CNRS, CINaM UMR 7325, Campus de Luminy, Case 913, 13288 Marseille, France. E-mail: frederic.fages@univamu.fr
dSorbonne Universités, Faculté des Sciences, CNRS, Parisien de Chimie Moléculaire (IPCM), UMR 8232, Chimie des Polymères, 75005 Paris, France
eUniversité de Strasbourg, CNRS, Institut de Physique et Chimie des Matériaux de Strasbourg, UMR 7504, F-67000 Strasbourg, France. E-mail: anthony.daleo@ipcms.unistra.fr
fCenter for Organic Photonics and Electronics Research (OPERA), Kyushu University, Fukuoka 819-0395, Japan
First published on 29th November 2021
Abstract
Epsilon-near-zero (ENZ) properties have been reported in organic molecular films. In particular, cyanine and squaraine films have been shown to exhibit ENZ properties in the visible spectral region with a strong 3rd order nonlinear optical response near the ENZ spectral region. Noting both cyanine and squaraine belong to the polymethine family, a series of six curcuminoid borondifluoride (Curc) derivatives were developed to examine whether such a polymethine character is positively correlated with the ENZ property of the organic films. Those Curc derivatives possess a Donor–Acceptor–Donor (D–A–D) architecture with acceptor, AcacBF2, located at the molecular center. The backbone of Curc is designed such that the donor strength can be tuned to transit between charge transfer (CT) and polymethine character. This balance between CT and polymethine character of the Curc series is examined based on the Lippert–Mataga plot. As donor strength in the D–A–D structure increases, CT character is less marked resulting in a more dominant polymethine character. The structural and optical properties of the Curc films with a thickness in the order of 30 nm were examined to correlate the polymethine character with the ENZ response. The results obtained in isotropic Curc thin films demonstrate that an increase of polymethine character associated with a stronger donor strength leads to an appearance/enhancement of the ENZ property in the visible spectrum range from 500 to 670 nm. Overall, this study provides useful guidelines to engineer new organic materials showing ENZ properties in a desired spectral range.
1. Introduction
Epsilon-near-zero (ENZ) materials, characterized by their permittivity close to zero within a certain spectral range, have recently attracted growing interest for their linear and large non-linear optical properties.1–3 Their unique features make them indeed particularly appealing for different types of optical applications including nonlinear fast optical switching, radiation pattern tailoring or directional light emission.4–6 Those ENZ properties have been observed in a variety of optical media. Examples include noble metals with Drude-type permittivity, hyperbolic metamaterials composed of multi-stack of metal and dielectric layers,7 hyperbolic metamaterials composed of metallic nano-rods embedded in oxide,8 oxide films,2,9,10 etc. In addition, a few examples of organic materials with ENZ properties have been reported by us and others,11–17 including monolithic natural hyperbolic material,11 polymethine dye,12–15 porphyrin16 and polyaromatic octupolar molecule.17 Such organic ENZ materials present some advantages compared to their inorganic counterparts, for instance, in terms of ease of processing and mechanical flexibility but further works are still required to establish their structure–property relationship and unlock their potential for photonic applications.Among the organic ENZ materials previously reported in the literature,12 sodium[5,6-dichloro-2-[[5,6-dichloro-1-ethyl-3-(4-sulphobutyl)-benzimidazol-2-ylidene]-propenyl]-1-ethyl-3-(4-sulphobutyl)-benzimidazolium hydroxide] (TDBC) cyanine and [2,4-bis[8-hydroxy-1,1,7,7-tetramethyljulolidin9-yl]squaraine] (HTJSq) are of interest, since a strong 3rd order nonlinear optical response was observed in spin-coated films near ENZ spectral range in the visible part of the spectrum. Noting that both TDBC and HTJSq belong to the class of polymethine dyes (i.e. molecule composed of odd number of carbons in the alternation of single and double bonds), it is tempting to make the correlation between the polymethine character of the molecules and their ENZ properties in films in order to find a strategy to develop new organic ENZ molecules. For this purpose, donor–acceptor–donor (D–A–D) curcuminoid borondifluoride derivatives represent excellent candidates since their polymethine character can be chemically tuned by the donor strength.18
In fact, this research work addresses two important issues that are particularly relevant for the future development of organic ENZ materials. First, in order to establish the structure–property relationship of donor strength and polymethine character, six new curcuminoid borondifluoride (Curc) dyes are synthesized. All the six Curc dyes contain the AcacBF2 motif as strong electron withdrawing group at the center of the D–A–D structure and varied donor groups on each end, allowing to relate the donor strength with charge transfer (CT) character vs. polymethine character. Second, in order to identify the correlation between the polymethine character of the molecules and their ENZ property in film, the six Curc dyes were deposited into thin films on the order of 30 nm using spin-coating. For each of the six films, the presence of ENZ property is examined and the feature of ENZ spectral range and polymethine character of Curc dye is compared. This study allows us to clearly establish the impact of the electron donor strength on the polymethine character in solution and the ENZ property in the solid state, providing a useful indication of the structure–property relationship in this family of curcuminoid derivatives and should be taken into account in further works devoted to the ENZ properties of organic materials.
2. Synthesis of curcuminoid-borondifluoride series with varied donors
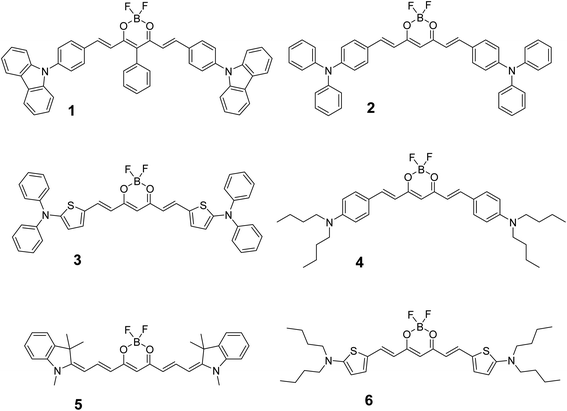
A recent study has shown that curcuminoid borondifluoride can exhibit polymethine character by tuning the acceptor strength.18 Now, to investigate the correlation between the donor strength and polymethine character, we designed and synthetized a series of curcuminoid derivatives. The D–A–D structures of those dyes were designed by keeping the acceptor strength constant (acetyl acetonate boron difluoride, AcacBF2) and changing the donor strength to produce six D–A–D Curc as shown in Fig. 1. Therefore, this series allows to estimate the effect of donor groups on the polymethine character of Curc.2.1. Electrochemistry of Curc series
Cyclic voltammetry (CV) of the six Curc series in dichloromethane solution was performed to determine oxidation and reduction waves that are centred on the end-group donor and central acceptor, respectively, as shown in Table 1 (and Fig. S1†). Therefore, the oxidation potential allowed to roughly rank the selected donors in this study.| Compound | E1/2 red1 (V) | E1/2 ox1 (V) | HOMO–LUMO gap (eV) | Published |
|---|---|---|---|---|
| 1 | −1.10 | 0.92 | 2.02 | Herein |
| 2 | −1.27 | 0.58 | 1.85 | Ref. 26 |
| 3 | −1.27 | 0.26 | 1.53 | Herein |
| 4 | −1.44 | 0.31 | 1.75 | Herein |
| 5 | −1.67 | 0.07 | 1.74 | Herein |
| 6 | −1.49 | 0.02 | 1.51 | Herein |
As can be seen, the oxidation potential varies from 0.92 V to 0.02 V (for 1 and 6, respectively), clearly assessing that the carbazole (in 1) is the weakest donor and the dibutylaminothiophene (in 6) is the strongest donor. Following those experiments, the following donor strength ranking can be assessed: 1 < 2 < 4 < 3 < 5 < 6.
Here, it is interesting to note that the reduction potential (i.e., the ability for AcacBF2 to accept an electron) becomes lower as the donor strength is increased, suggesting that either the electron density increases at the location of the boron atom or the polymethine form is reached resulting in the presence of B−. Overall, those electrochemistry results show that this series of six curcuminoid derivatives is well suited to examine the effects of the donor strength on their optical and photophysical properties.
2.2 Photophysical properties and solvatochromism study of six Curc series
To examine the dependence of photophysical properties on the donor strength, UV/visible absorption and photoluminescence (PL) spectra of six Curc series were measured in diluted dichloromethane solution. As can be seen in Fig. 2a, for UV/vis absorption spectrum, the absorption band is red-shifting when increasing the donor strength of the dye with maxima spanning from 518 to 692 nm, respectively (for 1 and 6, respectively). This red-shift is consistent with the donor strength, yielding 1 (518 nm) < 2 (594 nm) < 4 (619 nm) < 5 (659 nm) < 3 (665 nm) < 6 (692 nm). It is to be noted that only the compound 3 (λ = 665 nm) is not in line with the donor strength determined by the oxidation potential obtained from CV which might be due to the lower aromatic stabilization energy of the thiophene (compared to benzene). On the other hand, an inspection of full-width-at-half-maximum (FWHM) reveals a decrease of FWHM of the lowest absorption band in energy, which results in the same type of progression as that of absorption maxima such as 1 (3802 cm−1) > 2 (2805 cm−1) > 3 (2399 cm−1) > 4 (2303 cm−1) > 6 (1605 cm−1)> 5 (1457 cm−1). Note that the spectra of 1–2 possess the characteristic feature of a broad and structure-less charge transfer (CT) transition, which is not observed in the spectra of 3–6. In other words, the spectra of 3–6 are not consistent with the notion that an increased donor strength correlates with a pronounced CT transition. Such results support the fact that first excited state of 1–2 and 3–6 do not have the same nature of electronic configuration.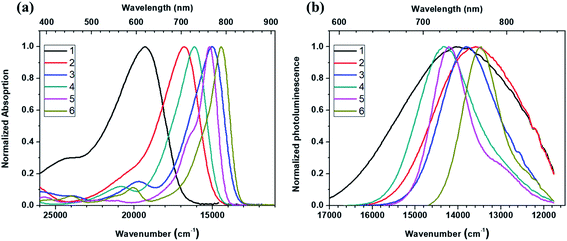 | ||
| Fig. 2 (a) Normalized absorption spectra and (b) normalized photoluminescence spectra of compound 1 (exc. λ = 490 nm), compound 2 (560 nm), compound 3 (630 nm), compound 4 (580 nm), compound 5 (580 nm), and compound 6 (620 nm) Curc series dissolved in dichloromethane (DCM) at concentration < 10−6 mol L−1. See Table 2 for FWHM of absorption and photoluminescence spectra. | ||
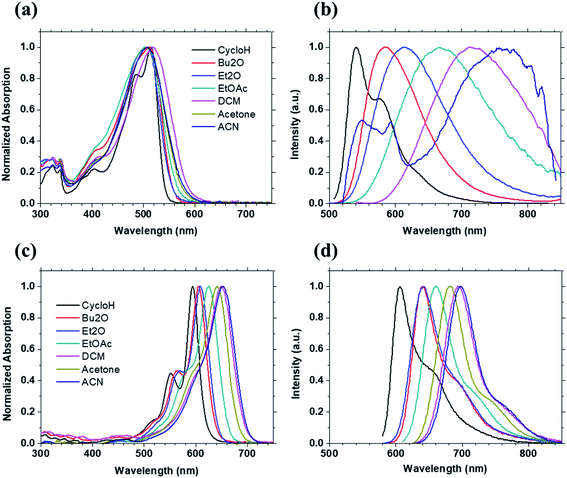 | ||
| Fig. 3 Absorption spectra and photoluminescence spectra of compound 1 (a) and (b), compound 5 (c) and (d) in 7 solvents with different polarity (see Table S3† for the values of orientation polarizability). | ||
Upon looking at PL spectra of 1–6 in DCM solution (Fig. 2b), no spectral shift consistency is observed as donor strength increases. Red-shift occurs for 1 (714 nm) and 2 (736 nm) as expected. On the other hand, 3 (724 nm), 4 (698 nm) and 5 (703 nm) are blue-shifted compared to 2. Such a discrepancy is also supported by the drastic change of FWHM going from the weakest donor (1) to the strongest one (6) as can be seen from Fig. 2b. In more details, FWHM decreases from 3267 cm−1 to 2399 cm−1 when the donor strength is increased slightly from 1 to 2. Then, FWHM gradually decreases down to 1032 cm−1 and 1013 cm−1 for 5 and 6, respectively. In addition, it is important to notice that, while the emission for 1 and 2 is broad and structure-less as expected for CT emission, the emission for 3–6 is well-structured and not in line with CT-like emission. Those results also strongly suggest that, in solution, the electronic configuration nature of the lowest excited states for 1–2 is different from that of 5–6. While for 1–2 CT excited states are involved in solution, for 5–6 polymethine-like character seems to be predominant in the lowest excited state Table 2.
| Compound | 1 | 2 | 3 | 4 | 5 | 6 |
|---|---|---|---|---|---|---|
| Absorption FWHM (cm−1) | 3802 | 2805 | 2399 | 2303 | 1457 | 1605 |
| Photoluminescence FWHM (cm−1) | 3267 | 2399 | 1567 | 1561 | 1032 | 1013 |
To get a better insight into the nature of the lowest excited state, solvatochromism of six Curc series is measured in solvents with different polarity as illustrated for 1 and 5 in Fig. 3. Those data are analysed by using Lippert–Mataga formalism which gives the difference of dipole moment between the ground state and excited state by considering the variation of Stokes shift (Δν) as a function of the orientation polarizability of solvents (Δf′).19,20 Solvatochromisms of all six Curc series are shown as Lippert–Mataga plots in Fig. 4. When increasing the polarity of the solvent, a large change of Stokes shift takes place for the weakest donor (slope of 21![[thin space (1/6-em)]](https://www.rsc.org/images/entities/char_2009.gif) 364 cm−1 for 1, see Fig. 4) while no substantial change of Stokes shift takes place for the strongest donor (slope of 1675 cm−1 for 6, see Fig. 4).
364 cm−1 for 1, see Fig. 4) while no substantial change of Stokes shift takes place for the strongest donor (slope of 1675 cm−1 for 6, see Fig. 4).
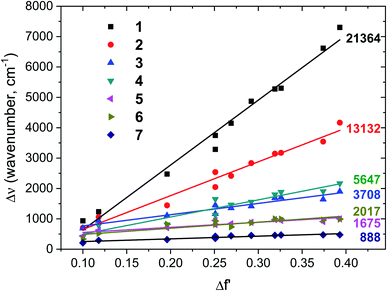 | ||
| Fig. 4 Lippert–Mataga plots of six Curc series molecules (1–6) are shown along with polymethine squaraine dye 7. Numbers on the right of straight lines are slope value. Orientation polarizabilites Δf′ of 11 solvents are listed in Table S3.† | ||
By comparing Lippert–Mataga plot (Fig. 4) and PL spectra (Fig. 2), the decrease of slope in Lippert–Mataga plot by almost 13-fold when the donor strength increased from 1 to 6 leads to the notion that the excited state nature of 6 is different from that of 1. For 1, the large Lippert–Mataga slope is accompanied by a broad and structure-less emission revealing a clear CT emission, while for 6 the small Lippert–Mataga slope is reinforced by the structuration of the emission band which is inconsistent with CT emission and more associated with polymethine-type emission. In fact, such behaviour is in line with charge delocalization and polymethine-type emission. Noticeably, a gradual decrease of the Lippert–Mataga slope upon increasing donor strength for 2, 4 and 3 (see Fig. 4) along with the structuration of emissions for 3 and 4 (See Fig. 2b) indicates an increase of polymethine character compared to CT character. It is to be noted that a similar conclusion was drawn theoretically by Brédas et al. in literature on a dye of the same family as 221 and on a dye containing a cyano unit in meso position of curcuminoid.18 To support further this statement, Stokes shift of a polymethine model squaraine (see Fig. S2† for molecular structure compound 7) was examined. As displayed in Fig. S3,† structured UV/vis absorption and emission spectra are observed for this polymethine model squaraine, similar to those observed for compounds 5 and 6 in solvents with ten different polarities. Together with the small Lippert–Mataga slope of 888 cm−1 observed with the polymethine model squaraine in Fig. 4 and 6, these results support well our claim that the increase of donor strength shifts the electronic configuration from CT excited state to polymethine-type excited state in the six Curc series.
Therefore, we conclude that while a clear CT emission is observed for 1, this CT character of the emission gradually decreases upon increasing donor strength of the side groups, resulting in an increased polymethine character of Curc series. That is, CT character follows in sequence of 1 > 2 > 4 > 3 > 5 > 6.
3. Donor strength dependence of optical property in thin film
The structural and optical properties of the series of six Curc in thin films were investigated to determine how the electron donor strength relates to their ENZ response. Each Curc dye was dissolved in chloroform at the concentration of 0.34 wt% (5 mg mL−1) and was spin-coated onto a fused silica substrate at the rate of 1000 rpm for 30 s. The spin-coated Curc films showed thickness of 29.5 nm, 34.3 nm, 39.0 nm, 33.5 nm, 39.6 nm and 30.5 nm, respectively in the order of 1, 2, 3, 4, 5, and 6. Structural and ENZ properties of the six Cur series were characterized by measurements such as 2D grazing incidence X-ray scattering (GIWAXS), spectroscopic ellipsometry (SE), linear optical spectroscopy, and attenuated total reflection (ATR).3.1 Grazing incidence wide angle X-ray scattering (GIWAXS) measurement
Characterization of the structural and morphology properties of the spin-coated thin films of six Curc series was performed by 2D grazing incidence X-ray scattering experiments (Fig. S4 and S5†). Such experiments were done to determine whether the spin-coated films were structured or not. Therefore, the obtained data were allowed to determine if the ellipsometry should be fitted as isotropic (no structuration) or uniaxial (for structured films). Films of 1 and 6 are found to be optically uniaxial, as they are partly structured in lamellar phases with lamellae parallel to substrate and without in-plane alignment. Films of 2, 3, 4, and 5 are found to be isotropic. See SI for more description of the film investigation.3.2 Spectroscopic ellipsometry measurement
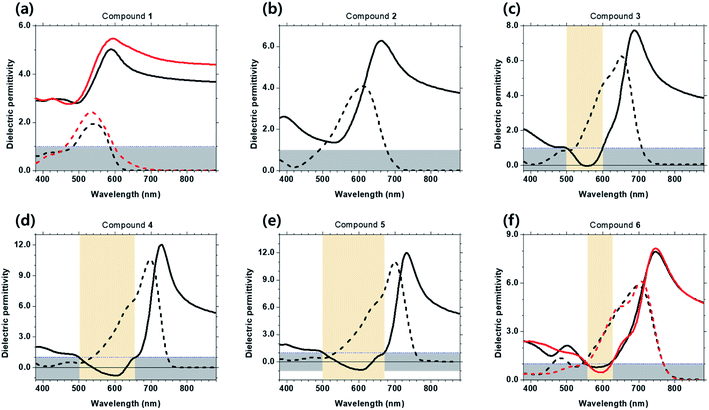
The real and imaginary parts of the dielectric constants of the six Curc films were determined using spectroscopic ellipsometry (SE). This type of measurements was used to assess whether the real part of the permittivity is below 1 and thus conclude on the ENZ properties in a certain wavelength range. Magnitude tan![[thin space (1/6-em)]](https://www.rsc.org/images/entities/char_2009.gif) Ψ and phase eiΔ of the complex ratio of reflection coefficients Rs to Rp are measured and fitted to obtain the real part n and imaginary part k of refractive index. Based on the GIWAXS results, we adopted a uniaxial optical model to fit the data obtained in the anisotropic films of 1 and 6 while those of the films of 2, 3, 4, and 5 were fitted by adopting an isotropic model. The real and imaginary parts of dielectric permittivity (Re{ε} and Im{ε}, respectively) were then obtained from the real part n and imaginary part k of refractive index. Refer to experimental section/methods and ESI† for more details.
Ψ and phase eiΔ of the complex ratio of reflection coefficients Rs to Rp are measured and fitted to obtain the real part n and imaginary part k of refractive index. Based on the GIWAXS results, we adopted a uniaxial optical model to fit the data obtained in the anisotropic films of 1 and 6 while those of the films of 2, 3, 4, and 5 were fitted by adopting an isotropic model. The real and imaginary parts of dielectric permittivity (Re{ε} and Im{ε}, respectively) were then obtained from the real part n and imaginary part k of refractive index. Refer to experimental section/methods and ESI† for more details.
As shown in Fig. 5, for films of 1 and 2, Re{ε} is well above 1 with no ENZ spectral region. Differently, for isotropic films of 3, 4, 5 and anisotropic film 6, there exists spectral regions where Re{ε} is less than 1, with corresponding ENZ features over the spectral range of 500–600 nm, 500–655 nm, 510–670 nm, and 550–625 nm, for 3, 4, 5, and 6, respectively. Table 3 also reports on the lowest value of Re{ε} with the corresponding spectral position in wavelength and ENZ spectral range (nm) −1 < Re{ε} < 1 of six Curc series. We note that the width of the ENZ spectral region is broadened as donor strength increases for isotropic films of 3, 4, 5. Notably, for isotropic films of 4 and 5 a double zero-crossing of Re{ε} takes place, similar to that observed in dielectric spectrum of squaraine indolenine triethyleneglycol molecular film.22 That is, in films of 4 and 5, as wavelength increases from blue to red spectral region, Re{ε} changes sign from positive to negative (ENZ) at short wavelength, while from negative to positive (epsilon-near-pole, ENP) at long wavelength.27,28 The presence of ENP is associated with a high value of refractive index n, and in fact the maximum value of n is over 3 in films of 4 and 5. See Fig. S7(d) and (e).† When ENZ properties of anisotropic film 6 (the highest donor strength) and isotropic film 5 (the next highest donor strength) films are compared, we find that anisotropic structural formation significantly diminishes the imaginary part k of refractive index in film of 6, resulting in no zero-crossing of Re{ε} in both parallel and perpendicular components. See Fig. S7† for dispersion of n and k.
| Lowest value of Re{ε} | Wavelength (nm) | ENZ spectral range (nm) −1 < Re{ε} < 1 | |
|---|---|---|---|
| Compound 1 | 2.8 | 495 | N/A |
| Compound 2 | 1.2 | 531 | N/A |
| Compound 3 | −0.1 | 560 | 500–600 |
| Compound 4 | −0.9 | 600 | 500–655 |
| Compound 5 | −1.0 | 605 | 500–670 |
| Compound 6 | 0.2 | 600 | 550–625 |
3.3 Linear optical spectroscopy of reflection, transmission, and absorption
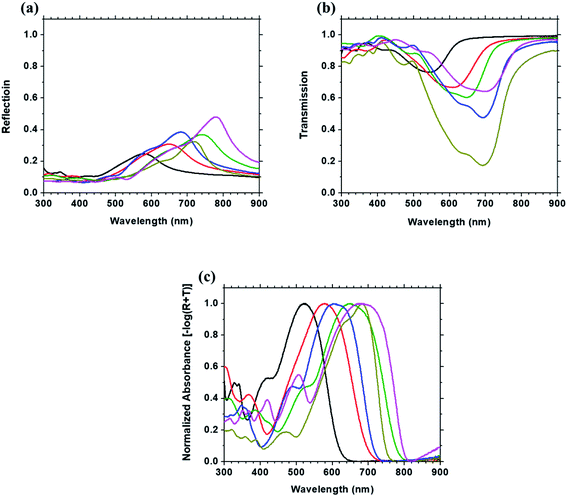
Linear optical spectra of six Curc series thin films are shown in Fig. 6, including (a) reflection, (b), transmission, and (c) normalized absorbance (−log(R + T)). Several features in those linear spectra are noted. First, it is found that the reflections of 3, 4, 5 and 6 are more intense than those of 1 and 2, indicating that the reflection becomes stronger as the donor strength increases. Second, a larger red-shift of the absorption peak takes place as the donor strength increases. This is due to the auxochrome function of the end groups on the phenyl or thiophene as well as the longer polymethine. Together with the ellipsometric data, those results clarify the impact of the donor strength and the polymethine character on the optical properties of the films.3.4 FDTD simulation of linear optical spectra of film 5 and attenuated total reflection measurement
Measured reflection and transmission spectra of film 5 are shown in Fig. 7. Reflection in the visible spectral range is observed with maximum peak location of 735 nm for a value of 55%. In parallel, the transmission exhibits the lowest value of 17.4% at a wavelength of 694 nm. Those spectra were also simulated using finite-difference time domain (FDTD) and the calculated spectra well correlated with the experimental data confirm the adequacy of the permittivity values extracted from SE measurements.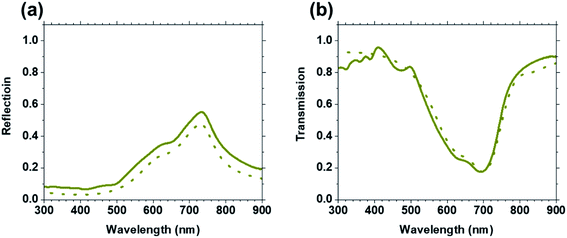 | ||
| Fig. 7 Experimental (solid curve) and FDTD simulated (dashed curve) reflection (a) and transmission (b) spectra of film 5 are compared. | ||
Attenuated total internal reflection (ATR) measurements were carried out to identify surface exciton polariton excitation in the Curc films.11 The films spin-coated on top of fused silica substrate were combined with a coupling prism in the Kretschmann geometry where the reflectivity is measured as a function of the angle of incidence. In this measurement, a sharp minimum in the reflectivity can be observed under the resonant conditions when the light is coupled to the surface exciton polaritons.
ATR spectra of six Curc series shown in Fig. 8 were measured at the wavelength of the minimum Re{ε} (see Table 3) and show that the ATR resonance takes place in the spectral region of Re{ε} < −1. In particular, among ATR spectra of the isotropic films of 2, 3, 4, and 5 in Fig. 8 (b), (c), (d), and (e), it can be seen that ATR resonance is more pronounced in sequence of (c), (d), and (e) following the lowest Re{ε} value, i.e., −0.1, −0.9, and −1.0, for compound 3, 4, and 5, respectively. Notably, Fig. 8 (d) and (e) show a well-defined ATR resonance as a function of incidence angle. In ATR spectra of the anisotropic films of 1 and 6 in Fig. 8 (a) and (f), both spectra do not show ATR resonance, where the lowest Re{ε} values are above 0, i.e., 2.8 and 0.2 for compound 1 and 6, respectively. Importantly, it can be seen that the experimental ATR data are in good consistency with FDTD calculations, providing further evidence of the ENZ response supporting surface exciton polaritons in some of the Curc films.
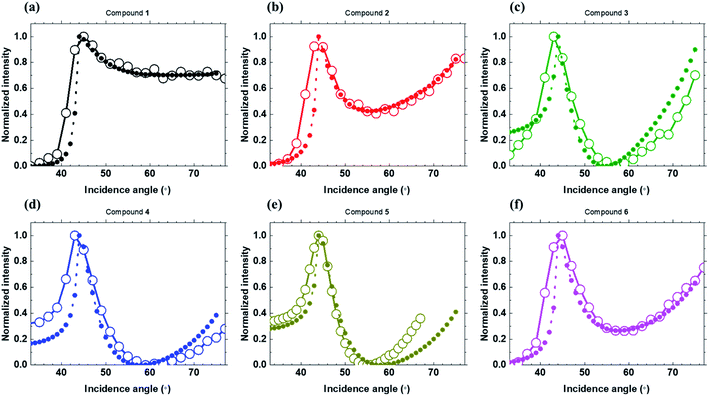 | ||
| Fig. 8 Experimental (open circle) and FDTD simulated (closed circle) ATR spectra for six Curc series. | ||
4. Discussion
By varying the donor strength at the end groups of Curc series, the structure–property relationship between donor strength and polymethine character is clearly identified. As the donor strength increases, the polymethine character in solution becomes dominant while the CT character diminishes. Within the examples reported here, we showed that the polymethine character can be correlated to some extend to the presence and the broadening of ENZ spectral region in pristine thin film. The dyes with CT character work efficiently for emissive organic electronics applications21,23,24 while not showing ENZ properties. On the other hand, the polymethine character in Curc dyes is associated with characteristics related to ENZ materials. In other words, the identification of excited-state electronic nature in solution guides which dye might possess ENZ properties in their pristine form: (i) the dye with CT character can be excluded as candidates for ENZ thin film and (ii) the dyes having polymethine character can be tested to see whether the ENZ properties exist in thin film, which seems to be effective all the time in the present case. The reason why those Curc with polymethine character shows ENZ properties is still under investigation: this might be related to (i) the intense and narrow absorption of the polymethine (however, this is not observed experimentally in the thin films) or (ii) to the presence of intermolecular CT states formed when strong electron-donor side groups stacks on strong electron-withdrawing groups (i.e. central AcacBF2).25 In the latter case, photoinduced hole and electrons are formed.Based on the analysis of film structure obtained from GIWAXS and SE measurements, it is found that the tiny structuration induces an optically uniaxial films which possess ENZ spectral region narrower than optically isotropic films. In other words, even though polymethine character in solution is more dominant in compound 6 than compound 5, ENZ property is more prominent in isotropic film of compound 5 than uniaxial film of compound 6.
Therefore, two factors of the strong donor strength (dominant polymethine character in solution) in Curc dye and the isotropy in film structure are key in obtaining a prominent ENZ property with a broader spectral range. Finally, in the case of Curc ENZ film, the surface exciton polariton excitation within the ENZ spectral range was confirmed by use of ATR technique and FDTD simulations, ensuring that the observed ENZ region (resulting from the SE fits) presents a pronounced ATR resonance. This study opens a novel path toward the development of new organic materials with ENZ properties in the visible and near infrared spectral range.
5. Conclusion
In conclusion, through increasing the donor strength in a Curc series with a D–A–D structure, the CT character diminishes and the polymethine character became more pronounced and dominant. The compounds with the strong polymethine character in solution were found to exhibit an ENZ spectral region in pristine molecular film. Furthermore, the manner of how the molecules are arranged on the film is shown to determine optical anisotropy as well as the feature of ENZ response. Out of the six Curc thin films four showed an ENZ response, all in the visible spectrum range, ranging from 500 nm to 670 nm. Overall with increasing polymethine character in solution, we were able to design, synthetize and characterize Curc dyes forming ENZ response exhibiting ENP as well as ENZ. These results provide new important guidelines that should be taken into account when designing molecular systems with ENZ properties in thin films.6. Experimental section/methods
6.1 Materials and methods
All solvents for synthesis were of analytic grade. NMR spectra (1H and 13C) were recorded at room temperature on JEOL JNM ECS 400 operating at 400 and 100 MHz for 1H and 13C, respectively. Data are listed in parts per million (ppm) and are reported relative to tetramethylsilane (1H and 13C); residual solvent peaks of the deuterated solvents were used as internal standards. Mass spectra were realized in Spectropole de Marseille (http://www.spectropole.fr/). Compound 2 has been reported elsewhere.26The UV/vis absorption spectra were measured using Hitachi spectrophotometer U-3900 with a double beam single monochromator system. Reflection and transmission were measured independently for films. The absorptance was calculated by using absorptance = −log(R + T). The fluorescence spectra were measured using a Horiba Jobin Yvon fluorimeter (FluoroMax-4).
6.2 Grazing-incidence wide-angle X-ray scattering
The characterization of the structural and morphology properties of the spin-coated Curc thin films was performed by 2D grazing incidence X-ray scattering experiments at PLS-II 9A 9A U-SAXS beamline of Pohang Accelerator Laboratory in Korea. The thin films were studied on silicon substrates and the X-rays coming from the in-vacuum Undulator (IVU) were monochromated using Si(111) double crystals and focused on a detector consisting of a 2D CCD detector (Rayonix SX165). The distance between sample and detector was around 221 mm for a beam energy of 11.055 keV (1.100 Å).6.3 Spectroscopic ellipsometry
A J. A. Woollam Co. alpha-SE spectroscopy ellipsometer was used to measure Ψ and Δ between 381 and 887 nm at an angle of incidence of 70°, both parameters describing the output elliptical polarization state after linearly polarized light is reflected off of the thin film. Note that the light beam illuminating the samples had a diameter of ∼2 mm. After measuring ψ and Δ, a model was built using the analysis software CompleteEASE® program in order to determine the optical constants and the dielectric permittivity of the films. Average mean-square-error (MSE) is from 2 to 3. See ESI† for detailed analysis of modeling and fitting of each film.6.4 Attenuated total reflection
Home-built setup of a Kretschmann geometry is used with a fiber-coupled Deuterium-Halogen lamp (Ocean Optics, DH2000) light source with a polarizer allowong the light to be p-polarized at a wavelength range of 400–800 nm. The beam is focused using a convex lens and a BK-7 glass prism mounted on a rotating holder with a varying incidence angle from 30° to 80°. The thin films, prepared on fused silica, are coupled to the prism with index-matching oil (n = 1.51). The reflected light is detected using a fiber-coupled spectrometer (Ocean Optics, HR4000CG-UVNIR).6.5 Finite difference time domain
Finite-difference time-domain (FDTD, Lumerical) simulations were used to calculate the reflection, transmission, and ATR and were then compared to the experiment data. The film thickness of the organic thin films obtained through surface profilometry (Dektak) measurements were used along with the permittivity values obtained through spectroscopy ellipsometry for simulation.6.6 Synthesis of 1 and 4
In a 100 mL flask, acetylacetone (5.0 mmol, 1 eq.) and BF3·Et2O (600 μL, 5.25 mmol, 1.05 eq.) in 3 mL of ethyl acetate were heated for 30 min at 50–60 °C in air. Dissolved aldehyde (10.1 mmol, 2.1 eq.) and B(n-OBu)3 (10.1 mmol, 2.1 eq.) into 40 mL ethyl acetate, then the solution was injected into the first mixture. The reaction was kept at 50–60 °C for another 30 min. First portion of butylamine (2.0 mmol, 0.4 eq.) was added dropwise into the reaction and the reaction was kept heating at 50–60 °C overnight. All the solvents were evaporated. The crude product could be obtained by flash column chromatography (silica, CH2Cl2). Further purification was done by many times' precipitation in CH2Cl2/petroleum ether, giving dark green powder.9,9′-(((1E,1′E)-(2,2-Difluoro-5-phenyl-2H-1l3,3,2l4-dioxaborinine-4,6-diyl)bis(ethene-2,1-diyl))bis(4,1-phenylene))bis(9H-carbazole) 1 (992 mg, 77% yield). 1H NMR (400 MHz, CDCl3, ppm): 8.21(d, 3J = 15.6 Hz, 2H), 8.14 (d, 3J = 8.0 Hz, 4H), 7.72 (d, 3J = 8.8 Hz, 4H), 7.64 (d, 3J = 8.8 Hz, 4H), 7.59 (m, 3H), 7.45 (m, 10H), 7.31 (dt, 3J = 8.0 Hz, 4J = 1.5 Hz, 4H), 6.70 (d, 3J = 15.6 Hz, 2H); 13C NMR (100 MHz, CDCl3, ppm): not soluble enough. HRMS (ESI†) [M + Na]+ calcd for C49H33N2O2BF2Na+ m/z = 753.2504, found m/z = 753.2502.
4,4′-((1E,1′E)-(2,2-Difluoro-2H-1l3,3,2l4-dioxaborinine-4,6-diyl)bis(ethene-2,1-diyl))bis(N,N-dibutylaniline) 4 (712 mg, 22% yield). 1H NMR (400 MHz, CD2Cl2, ppm): 7.87 (d, 3J = 15.2 Hz, 2H), 7.50 (d, 3J = 9.2 Hz, 4H), 6.66 (d, 3J = 9.2 Hz, 4H), 6.46 (d, 3J = 15.2 Hz, 2H), 5.90 (s, 1H), 3.36 (t, 3J = 8.0 Hz, 8H), 1.61 (m, 8H), 1.38 (m, 8H), 0.97 (t, 3J = 7.6 Hz, 12H); 13C NMR (100 MHz, CD2Cl2, ppm): 177.25, 151.18, 146.21, 131.70, 121.47, 114.08, 111.66, 100.70, 50.87, 29.40, 20.28, 13.75. HRMS (ESI†) [M + Na]+ calcd for C49H33N2O2BF2Na+ m/z = 601.3753, found m/z = 601.3757.
6.7 Synthesis of 3, 5 and 6
The synthesis of 3, 5 and 6 were done similarly to the ones of 1 and 4 by substituting n-butylamine by morpholine.5,5′-((1E,1′E)-(2,2-Difluoro-2H-1l3,3,2l4-dioxaborinine-4,6-diyl)bis(ethene-2,1-diyl))bis(N,N-diphenylthiophen-2-amine) 3 (521 mg, 43% yield). 1H NMR (400 MHz, CD2Cl2, ppm): 7.91 (d, 3J = 15.9 Hz, 2H), 7.38 (m, 8H), 7.22 (m, 14H), 6.39 (d, 3J = 4.0 Hz, 2H), 5.98 (d, 3J = 15.9 Hz, 2H), 5.63 (s, 1H); 13C NMR (100 MHz, CDCl3, ppm): 176.49, 161.47, 146.67, 139.02, 137.37, 130.31, 129.11, 126.56, 125.85, 114.88, 114.81, 101.57. HRMS (ESI†) [M + Na]+ calcd for C39H29N2O2S2BF2Na+ m/z = 693.1629, found m/z = 693.1635.
(2E,2′E)-2,2′-((2E,2′E)-(2,2-Difluoro-2H-1l3,3,2l4-dioxaborinine-4,6-diyl)bis(prop-2-en-3-yl-1-ylidene))bis(1,3,3-trimethylindoline) 5 (448 mg, 32% yield). 1H NMR (400 MHz, DMSO-d6, ppm): 8.30 (t, 3J = 13.6 Hz, 3J = 13.2 Hz, 2H), 7.95 (d, 3J = 7.2 Hz, 4H), 7.15 (t, 3J = 7.0 Hz, 4H), 6.69 (s, 1H), 6.12(d, 3J = 14.0 Hz, 2H), 5.94 (d, 3J = 13.2 Hz, 2H), 3.50 (s, 6H) 1.57 (s, 12H); 13C NMR (100 MHz, DMSO-d6, ppm): not soluble enough. HRMS (ESI†) [M + Na]+ calcd for C31H33N2O2BF2Na+ m/z = 537.2501, found m/z = 537.2507.
5,5′-((1E,1′E)-(2,2-Difluoro-2H-1l3,3,2l4-dioxaborinine-4,6-diyl)bis(ethene-2,1-diyl))bis(N,N-dibutylthiophen-2-amine) 6 (616 mg, 29% yield). 1H NMR (400 MHz, CDCl3, ppm): 7.90 (d, 3J = 14.8 Hz, 2H), 7.10 (d, 3J = 4.0 Hz, 2H), 5.85 (d, 3J = 4.4 Hz, 2H), 5.81 (d, 3J = 14.4 Hz, 2H), 5.99 (s, 1H), 3.33 (t, 3J = 7.6 Hz, 8H), 1.65 (m, 8H), 1.36 (m, 8H), 0.97 (d, 3J = 7.2 Hz, 12H); 13C NMR (100 MHz, CDCl3, ppm): 174.49, 164.04, 138.67, 138.09, 123.36, 110.75, 103.92, 99.67, 53.61, 29.16, 20.17, 13.83. HRMS (ESI†) [M + Na]+ calcd for C39H57N2O2BF2Na+ m/z = 613.2881, found m/z = 613.2878.
6.8 Film fabrication
The organic ENZ thin films of curcuminoid were prepared on fused silica and silicon substrates. The fused silica substrates were cut in advance into square pieces with the size of 2.0 cm × 2.0 cm in order to fully cover the prism area of the ATR experiment. The substrates were washed using acetone, isopropyl alcohol (IPA), and chloroform each for 10 minutes in an ultrasonic bath, afterwards the excess liquid was dried off with N2 gas. The synthesized organic potential ENZ molecules of 5 mg are dissolved in 1 mL of chloroform. The ENZ thin films were prepared by spin-coating the solution onto fused silica or silicon substrates at 1000 rpm for 30 s. As a result, approximate film thicknesses were between 30 and 40 nm for each film determined by Dektak and also Spectroscopic Ellipsometry. No further processing such as thermal annealing of the thin film was made in this study.Author contributions
Kyu-Ri Choi, Dae Hyeon Kim and Steven Huynh prepared the films, optimized film thickness, and carried out spectroscopic ellipsometry measurement. Kyu Ri Choi and Yeon Ui Lee set up ATR measurement and performed FDTD. Virginie Placide, Fabrice Mathevet, and Benoît Heinrich performed GIWAXS measurement. Dandan Yao, Elena Zaborova, Frédéric Fages, and Anthony D'Aléo synthesized molecules. Gabriel Canard performed electrochemistry characterization. Loïc Mager helped on the optics of ATR measurement. Jean-Charles Ribierre helped on physics of ENZ film. Jeong Weon Wu, Jean-Charles Ribierre, Frédéric Fages, and Anthony D'Aléo wrote the manuscript. Anthony D'Aléo and Frédéric Fages worked on photophysics of the dyes. Jeong Weon Wu, Frédéric Fages, and Anthony D'Aléo designed project.Conflicts of interest
There are no conflicts of interest to declare.Acknowledgements
This work is supported by funding of the Ministry of Science, ICT & Future Planning, Korea (2014M3A6B3063708, 2017R1E1A1A01075394). YUL acknowledges National Research Foundation for funding (2021R1F1A1062916). This work was carried out in the framework of CNRSUMI2002 2B-FUEL “Building Blocks for Future Electronics Laboratory”. We further thank Pohang Accelerator Laboratory (PAL) for giving us the opportunity to perform the GIWAXS measurements, MEST and POSTECH for supporting these experiments, Dr Hyungju Ahn for adjustments and help, and other colleagues from the 9A USAXS beamline for assistance. Part of this work was also supported by the CNRS (PICS No 8085), France.References
- I. Liberal and N. Engheta, Near-zero refractive index photonics, Nat. Photonics, 2017, 11(3), 149–158 CrossRef CAS.
- M. Z. Alam, I. De Leon and R. W. Boyd, Large optical nonlinearity of indium tin oxide in its epsilon-near-zero region, Science, 2016, 352(6287), 795–797 CrossRef CAS PubMed.
- N. Kinsey and J. Khurgin, Nonlinear epsilon-near-zero materials explained: opinion, Opt. Mater. Express, 2019, 9(7), 2793–2796 CrossRef CAS.
- M. Z. Alam, et al., Large optical nonlinearity of nanoantennas coupled to an epsilon-near-zero material, Nat. Photonics, 2018, 12(2), 79–83 CrossRef CAS.
- A. Alù, et al., Epsilon-near-zero metamaterials and electromagnetic sources: Tailoring the radiation phase pattern, Phys. Rev. B: Condens. Matter Mater. Phys., 2007, 75(15), 155410 CrossRef.
- S. Enoch, et al., A Metamaterial for Directive Emission, Phys. Rev. Lett., 2002, 89(21), 213902 CrossRef PubMed.
- R. Maas, et al., Experimental realization of an epsilon-near-zero metamaterial at visible wavelengths, Nat. Photonics, 2013, 7(11), 907–912 CrossRef CAS.
- R. Atkinson, et al., Anisotropic optical properties of arrays of gold nanorods embedded in alumina, Phys. Rev. B: Condens. Matter Mater. Phys., 2006, 73(23), 235402 CrossRef.
- L. Caspani, et al., Enhanced Nonlinear Refractive Index in Epsilon-Near-Zero Materials, Phys. Rev. Lett., 2016, 116(23), 233901 CrossRef CAS PubMed.
- N. Kinsey, et al., Epsilon-near-zero Al-doped ZnO for ultrafast switching at telecom wavelengths, Optica, 2015, 2(7), 616–622 CrossRef CAS.
- Y. U. Lee, et al., Organic Monolithic Natural Hyperbolic Material, ACS Photonics, 2019, 6(7), 1681–1689 CrossRef CAS.
- Y. U. Lee, et al., Strong Nonlinear Optical Response in the Visible Spectral Range with Epsilon-Near-Zero Organic Thin Films, Adv. Opt. Mater., 2018, 6(14), 1701400 CrossRef.
- M. J. Gentile, S. Núñez-Sánchez and W. L. Barnes, Optical Field-Enhancement and Subwavelength Field-Confinement Using Excitonic Nanostructures, Nano Lett., 2014, 14(5), 2339–2344 CrossRef CAS PubMed.
- A. Cacciola, et al., Subdiffraction Light Concentration by J-Aggregate Nanostructures, ACS Photonics, 2015, 2(7), 971–979 CrossRef CAS.
- B. H. Woo, et al., Dispersion Control of Excitonic Thin Films for Tailored Superabsorption in the Visible Region, ACS Photonics, 2017, 4(5), 1138–1145 CrossRef CAS.
- L. Gu, et al., Quest for organic plasmonics, Appl. Phys. Lett., 2013, 103(2), 021104 CrossRef.
- G. Zhu, et al., Gigantic Optical Nonlinearity: Laser-Induced Change of Dielectric Permittivity of the Order of Unity, ACS Photonics, 2015, 2(5), 622–627 CrossRef CAS.
- V. Polishchuk, et al., D–π–A–π–D Dyes with a 1,3,2-Dioxaborine Cycle in the Polymethine Chain: Efficient Long-Wavelength Fluorophores, Eur. J. Org. Chem., 2018, 2018(2), 240–246 CrossRef CAS.
- E. Lippert, Dipolmoment und Elektronenstruktur von angeregten Molekülen, Z. Naturforsch., 1955, 10(7), 541–545 CrossRef.
- M. Noboru, K. Yozo and K. Masao, Solvent Effects upon Fluorescence Spectra and the Dipolemoments of Excited Molecules, Bull. Chem. Soc. Jpn., 1956, 29(4), 465–470 CrossRef.
- D.-H. Kim, et al., High-efficiency electroluminescence and amplified spontaneous emission from a thermally activated delayed fluorescent near-infrared emitter, Nat. Photonics, 2018, 12(2), 98–104 CrossRef CAS.
- M. Kim, K. R. Choi, Y. Ui Lee, B. Heinrich, S. Y. Ko, F. Mathevet, J. Ribierre, A. D’Aléo, J. W. Wu and V. Placide, Natural hyperbolic dispersion with anisotropic epsilon-near-zero and epsilon-near-pole in squaraine molecular film, Adv. Opt. Mater., 2021, 9(22), 2101091 CrossRef CAS.
- H. Ye, et al., Near-Infrared Electroluminescence and Low Threshold Amplified Spontaneous Emission above 800 nm from a Thermally Activated Delayed Fluorescent Emitter, Chem. Mater., 2018, 30(19), 6702–6710 CrossRef CAS.
- R. Aoki, et al., Realizing Near-Infrared Laser Dyes through a Shift in Excited-State Absorption, Adv. Opt. Mater., 2021, 9(6), 2001947 CrossRef CAS.
- A. J. Gillett, et al. Spontaneous exciton dissociation enables spin state interconversion in delayed fluorescence organic semiconductors. 2021. arXiv:2106.15512 Search PubMed.
- F. Archet, et al., Synthesis of Bioinspired Curcuminoid Small Molecules for Solution-Processed Organic Solar Cells with High Open-Circuit Voltage, ACS Energy Lett., 2017, 2(6), 1303–1307 CrossRef CAS.
- P. Shekhar, J. Atkinson and Z. Jacob, Hyperbolic metamaterials: fundamentals and applications, Nano Convergence, 2014, 1(1), 1–17 CrossRef PubMed.
- R. Starko-Bowes, et al., Optical characterization of epsilon-near-zero, epsilon-near-pole, and hyperbolic response in nanowire metamaterials, J. Opt. Soc. Am. B, 2015, 32(10), 2074–2080 CrossRef CAS.
Footnote |
| † Electronic supplementary information (ESI) available. See DOI: 10.1039/d1ra08025c |
| This journal is © The Royal Society of Chemistry 2021 |

