 Open Access Article
Multifunctional sensors based on liquid crystals scaffolded in nematic polymer networks†
Xiyun Zhan ab,
Dan Luo
 *b and
Kun-Lin Yang
 *a
*a
aDepartment of Chemical and Biomolecular Engineering, National University of Singapore, 4 Engineering Drive 4, Singapore 117576, Singapore. E-mail: cheyk@nus.edu.sg
bDepartment of Electrical and Electronic Engineering, Southern University of Science and Technology, Xueyuan Road 1088, Shenzhen 518055, China. E-mail: luod@sustech.edu.cn
First published on 1st December 2021
Abstract
Stimuli-responsive liquid crystal (LC) materials have attracted great attention due to their unique characteristics and anisotropic properties. They are not only important for fundamental studies, but also have many potential applications in the electro-optical and biochemical fields. Herein, the interference color obtained from a nematic polymer network-stabilized liquid crystal (PNLC) system is demonstrated to reflect the environmental conditions, including temperature and the presence of volatile organic vapors. The polymerization of LC monomers forms a stable network to template the LCs, while still maintaining the dynamic nature and thermal tunability of LCs. Via adjusting the concentration of LC monomer, a wide temperature sensing range can be achieved between 36 °C and 100 °C with visible color. The same sensor can be used to detect concentration profiles of toluene vapor in a microchannel with a limit of detection of 2300 ppm. This stimuli-responsive PNLC system is expected to be potentially useful for many other naked-eye sensing applications.
Introduction
The orientational response of thermotropic liquid crystal (LC) to external stimuli has been widely investigated in the literature. In general, mesogens in a thermotropic LC change their orientations from a planar to a homeotropic alignment or undergo a phase transition under a specific condition. In recent years, nematic liquid crystal polymer networks (LCNs) have received great attention due to their thermal stability and programmable mechanical properties. A LCN is a polymeric material with LC properties. It can be formed through photopolymerization of LC monomers with reactive groups.1 The LC monomers are similar to low-molar-mass LCs and exhibit long-range orders and anisotropic properties.2 More recently, a hybrid system with LC and LCN has been studied and exploited to fabricate functional devices. With the existence of a small amount of LCN, the LC molecules can be templated and stabilized in the polymer matrix while exhibiting responses to multiple stimuli, such as an electric field.3,4 For instance, a smart window based on a polymer-stabilized LC (PSLC) system with electrical tunability has been widely studied.5,6 It can switch between a voltage-off transparent state and a voltage-on scattering state with a low voltage. In addition, a dye-doped PSLC light shutter has been demonstrated to change from a clear to an opaque state due to dye adsorption, making it a good candidate in see-through displays.7,8Meanwhile, a thermotropic LC exhibits nematic-to-isotropic (N–I) phase transition with increasing temperature or exposure to volatile organic vapors (VOCs). Therefore, it has great potential for making temperature sensors and VOC sensors. Nematic LC-based temperature sensors have been reported by many research groups. Some sensors were based on temperature-dependent dielectric permittivity of LC. In general, for a positive nematic LC, the absolute dielectric permittivity (ε‖ − ε⊥) is increased with temperature. For example, Marcos et al. reported a temperature–frequency converter with an LC cell. The dielectric permittivity changed with temperature, resulting in different output frequency in the oscillator circuit.9 It showed a broad sensing range from −6 °C to 110 °C, but low sensitivity at low temperature compared with high temperature. The sensitivity was then improved by Algorri et al. by converting changes in permittivity into hyperbolic cosine functions.10 Meanwhile, a micrometric structure electrode was designed to produce high-voltage output. Another sensing mechanism is optical birefringence. In that case, LCs are often incorporated with Fabry–Perot cavities, photonic crystal fibers (PCFs) or waveguides,11–14 and the resonance wavelength shift was measured as a temperature-dependent signal. For example, Hu et al. reported a nematic LC filled PCF structure with −3.90 nm/°C sensitivity within 44–53 °C.15 Wang et al. designed a highly tunable polymer PCF filled with 5CB and achieved a sensitivity of 30.9 nm/°C from 25.1 °C to 34.8 °C.16 However, even though many works have been conducted to increase the sensitivity, dynamic detection ranges are somewhat limited, and the fabrication processes are complicated.
Recently, a thermal sensor based on LC confined in a polymer network liquid crystal (PNLC) was demonstrated by Colin et al.17 The temperature-induced second-order phase transition and birefringence change of LC E7 were measured. Yet, they only reported the thermal response within a narrow temperature range from 330 K to 340 K. Moreover, it is difficult to read out the temperature information directly. Thus, a platform to transfer the birefringence value into colors and to broaden the detection range of LC temperature sensors is highly desirable.
As for a nematic LC-based VOC sensor, past studies have revealed that the phase transition of LC can be induced by VOCs when the concentration reaches a threshold value. This phenomenon can be used to make practical VOC sensors.18 However, so far only the bulk transformation of the LC near the N–I point has been investigated. It is necessary to couple changes in order parameters of LC into vapor concentrations. Pantoja et al. have demonstrated a microwell confined LC film on a modified substrate.19 An orientational transition of a 0.7 μm LC film can be triggered by 316 ppm toluene vapor due to the decrease of anchoring energy of LC on the substrate. Bolleddu et al. presented a pattern-directed LC phase transition induced by solvent vapors. With the help of 5CB–AuNP composites, the phase change was converted into electric signal, which can reflect the order parameter of LC. LC/polymer fibers have been exploited to detect VOCs as well.20,21 Wang et al. showed that absorption of vapors by LC changes the optical transmittance of the fiber mat.21 Agra-Kooijman et al. developed an acetone sensor based on LC core polymer fiber mats with 16 ppm sensitivity.22 However, this LC/polymer composite fiber only shows a macro-response in transparency and it is hard to distinguish the concentration of VOCs. Liu et al. reported a concentration profile of toluene vapor through a polymer-stabilized nematic LC.23 Through this device, the toluene vapor concentration can be monitored inside a microchannel and reflected as visible colors.
In this paper, we prepared LC in a scaffold of a nematic polymer network and termed it a PNLC. By using the PNLC, we can obtain better thermal sensitivity and obtain a wider temperature detection range. Meanwhile, this multifunctional sensing system can also be applied for VOC sensing. Initially, the thermal properties were characterized and the laddered thermochromic effects of the PNLC with different concentrations of RM257 were investigated. The PNLC confined the nematic-to-isotropic phase transition of LC, resulting in a wider temperature sensing range. We further explored the effect of LCN on toluene vapor-induced color profile in microchannels encapsulated with the nematic PNLC. Effects of RM257 concentrations on the diffusion distance of toluene vapor were studied and compared.
Experimental
Materials
LC 4-cyano-4′-pentylbiphenyl (5CB) was purchased from Merck (Singapore). LC monomer RM257 was purchased from Sdyano (China). Detergent Decon 90 was purchased from VWR (Singapore). N,N-Dimethyl-n-octadecyl-3-aminopropyltrimethoxysilyl chloride (DMOAP) and photoinitiator 2,2-dimethoxy-2-phenylacetophenone (DMPA) were purchased from Sigma-Aldrich (Singapore). Polyimide (PI) (5.0 wt% solution) was obtained from Fisher (China). Poly(ethylene glycol) diacrylate (PEGDA, Mw = 575 g mol−1) was purchased from Macklin (China). Deionized (DI) water was prepared by using a Milli-Q system (Millipore, USA). Toluene (99.5% purity) was purchased from Sigma Aldrich (Singapore). A rectangular microcapillary (ID 0.05 × 1.0 mm) was obtained from VitroCom (Japan). A microsyringe (1700 series) was obtained from Hamilton (USA). A PHD Ultra syringe pump was obtained from Harvard Apparatus (USA) and a rubbing machine (LHC-MC-V2) was purchased from Hongchao Precision Mechanical Equipment (China). The UV pen lamp (ENF-260C) came from Spectroline (USA).Liquid crystal cell preparation
To fabricate an LC cell with a planar alignment, we first cleaned glass substrates with 5% (v/v) Decon 90 and washed them with DI water. Then, PI solution was spin-coated on the surface at 2500 rpm for 30 s by using a spin coater (SpinMaster 100) from Chemat Technology (China). After baking at 200 °C for 1 h, the PI-coated glass substrates were rubbed by using a rubbing machine unidirectionally. A precursor solution was prepared by mixing 6% RM257, 93.5% 5CB and 0.5% DMPA (Table 1). Another mixture with 6% PEGDA, 93.5% 5CB and 0.5% DMPA was prepared for control experiments. All precursor solutions were heated to 80 °C and stirred for 2 h to ensure uniformity. Subsequently, the precursor solutions were injected into an LC cell assembled by two PI-rubbed glass substrates. The distance between the two substrates was controlled by blending 45 μm spacer (Nano-Micro, China) with optical adhesive NOA65 (Norland, USA). Then, the LC cell was exposed to UV light (365 nm) at 10 mW cm−2 for 10 min to initiate polymerization. The UV power was determined by using a PW100A power meter from Thorlabs (USA).| A | B | C | D | E | F | |
|---|---|---|---|---|---|---|
| Liquid crystal (5CB) | 97.5% | 95.5% | 93.5% | 91.5% | 89.5% | 87.5% |
| Liquid crystal monomer (RM257) | 2% | 4% | 6% | 8% | 10% | 12% |
| Photoinitiator (DMPA) | 0.5% | |||||
Optical characterization and measurements
The optical characterization of the PNLC film was performed with a thermal stage (INSTEC, mK2000) by using an optical microscope (Nikon, Eclipse Ci-POL) under transmission mode with crossed polarizers. The morphology of the polymer films was measured by field emission scanning electron microscopy (SEM; Zeiss GeminiSEM 300, Germany). Transmittance spectra were obtained through a fiber optical spectrometer (Ocean Optics USB2000+, USA). Differential scanning calorimetry (DSC) measurement was performed with a Discovery DSC (TA, USA). The samples were equilibrated at 0 °C at first, and ramped at 10 °C min−1 to 200 °C. The birefringence Δn was measured by using the Michel-Levy chart.24Preparation of microchannels
A rectangular microchannel was washed with DI water three times and soaked in a 5% (v/v) Decon 90 solution overnight to clean the surface. Next, the microchannel was washed with DI water and functionalized by immersing it in 0.1% (v/v) DMOAP solution for 2 h. After that, the microchannel was washed with DI water several times to remove the excess DMOAP and dried under nitrogen gas. Finally, a DMOAP-coated microchannel was obtained after baking in a vacuum oven at 100 °C for 30 min.Fabrication of toluene vapor sensors
To fabricate a toluene vapor sensor, a syringe driven by a syringe pump was connected to the microchannel through a piece of rubber tubing. The LC mixtures were injected inside the microchannels at a flow rate of 20 nL min−1 to achieve planar alignment inside. Then, the microchannels were exposed to a UV lamp (365 nm) for 10 min at 10 mW cm−2 (measured by a PW100A power meter, Thorlabs, USA) to polymerize the LC monomer. All the steps were performed at room temperature.Results and discussion
Polymer network formation and characterization
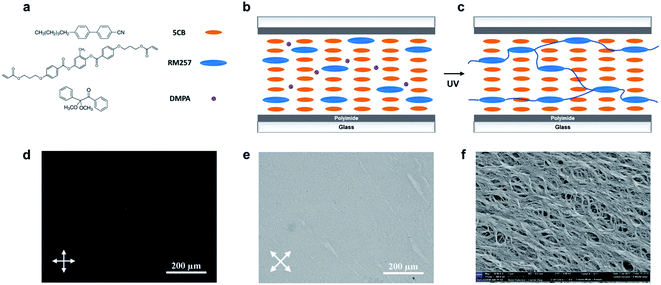
We prepared the nematic PNLC system by injecting a precursor solution of 5CB, RM257 and DMPA into a PI-rubbed cell, followed by photopolymerization. Fig. 1 depicts the chemical structures of the molecules and fabrication process for the preparation of the PNLC system. Initially, the LC mixture consisting of 5CB and RM257 was in a nematic phase with a planar alignment. Upon UV exposure, the RM257 cross-linked through the reactive acrylate end groups into LCN. Under a polarized microscope, a dark field was observed when the angle between the polarizer and alignment direction was 90°, while a bright field was apparent when the angle was 45°. The result suggests that the planar arrangement of LC was preserved by the polymer network. The SEM image in Fig. 1f shows that the polymer network has a fibrous structure with linear polymer threads aligning in the same direction as 5CB.Next, we explored the phase transition behavior of the LC mixtures by using DSC. As shown in Fig. 2a, nematic-to-isotropic phase transition temperatures (TN–I) for the mixtures with 2%, 4%, 6%, 8%, 10% and 12% RM257 were 38.2 °C, 39.7 °C, 41.1 °C, 42.5 °C, 44.3 °C, and 45.9 °C, respectively. With the addition of RM257, TN–I of the binary system increased. This result is expected since the TN–I for pure 5CB is about 36 °C and for RM257 is about 120 °C.25 When they were blended, they became a homogeneous mixture in a coexisting LC phase.
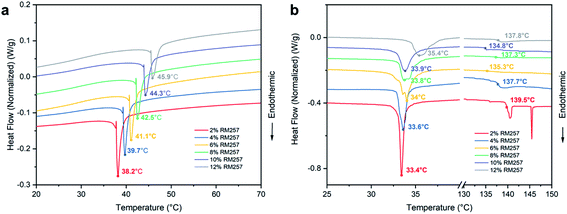 | ||
| Fig. 2 DSC traces of LC mixtures with 2–12% RM257 (a) prior to polymerization and (b) after polymerization. | ||
After polymerization, the phase transition temperatures for the mixtures with 2% to 12% RM257 became 33.4 °C, 33.6 °C, 34.0 °C, 33.8 °C, 33.9 °C, and 35.4 °C, respectively. We noted that the new transition temperature range was closer to that of pristine 5CB, suggesting that 5CB phase-separated from the polymer network. Additionally, a second peak between 137 and 140 °C can be observed in Fig. 2b. It suggests that the polymerized RM257 formed a separate phase as a polymer network. This is because RM257 is a LC polymer with mesogenic units in the backbone (Fig. 1c). Hence, we proposed that the second peak can be attributed to the nematic-to-isotropic phase transition of LCN. The increased melting temperature of the polymerized RM257 suggests that it has a broad range of liquid-crystalline phase with good thermal stability.
Thermal response of the PNLC system
To investigate the thermal response of the PNLC system, we captured optical images of a sample containing 6% of RM257 under a crossed polarizer and compared its response to heat before and after polymerization. Fig. 3 shows that the unpolymerized LC mixture with 6% RM257 coexisted in a nematic phase and became isotropic immediately when it was heated above TN–I at 42 °C.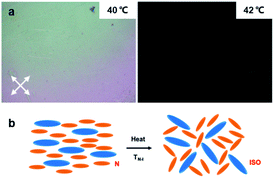 | ||
| Fig. 3 (a) Thermo-optical responses of the unpolymerized LC mixture with 6% RM257. (b) The N–I phase transition of the LC mixture before polymerization. | ||
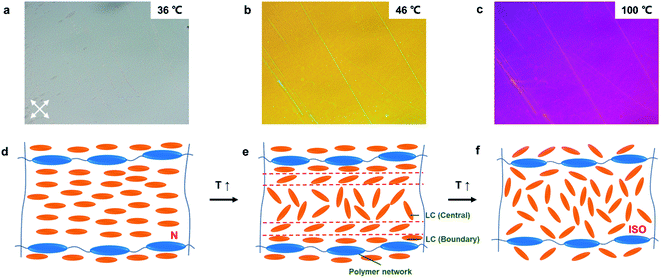
In contrast, after the system was polymerized, the phase transition at 42 °C was not observed. Fig. 4a–c shows the PNLC with 6% RM257 under different temperatures. When the temperature was higher than 36 °C, a continuous color variation was observed. A schematic of the two-stage transition of the PNLC is illustrated in Fig. 4d–f.
At the initial stage, both 5CB and polymerized LC network form a planar alignment in a nematic phase. When the temperature exceeded the TN–I of 5CB, the 5CB in the central domain became isotropic first, since it was not anchored by LCN and behaved like normal 5CB. However, the 5CB close to the polymer chain remained planar. It was due to strong anchoring energy imposed by LCN. With a continuous increase in the temperature, the thermal energy gradually overcame the anchoring energy of LCN and the orientational change of 5CB propagated from the central to the boundary region. This orientational change then resulted in the decrease of birefringence and color variation. As the temperature continued to rise, 5CB in the central and boundary regions became isotropic eventually.
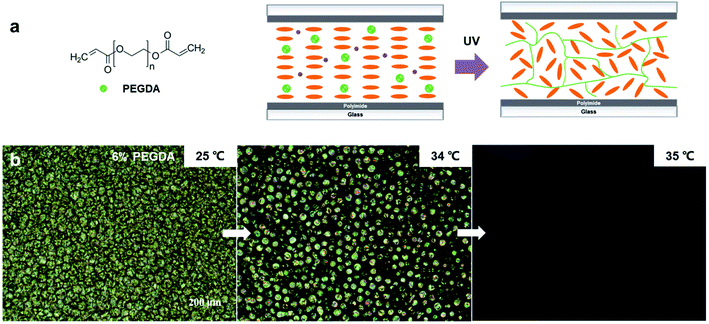
Furthermore, to explore whether the anchoring effect comes from the mesogenic units or the polymer backbone of RM257, we replaced the RM257 component with PEGDA, which is a diacrylate oligomer without a central mesogenic unit. The polymerization shown in Fig. 5a could be initiated with the same photoinitiator, DMPA.26 After the polymerization, phase separation in the PEGDA/5CB mixture occurred, resulting in a separate 5CB phase and a polymer matrix phase, as supported by the DSC measurement (Fig. S1†). This is known as a polymer-dispersed LC.27 In this case, 5CB was not stabilized by the polymer matrix, and it became an isotropic liquid at 35 °C as shown in Fig. 5b. Hence, it can be concluded that the anchoring effect of LCN to LC comes from the mesogenic units of RM257, leading to the continuous orientational change of LC.
Thermochromic effect of PNLC with planar orientation
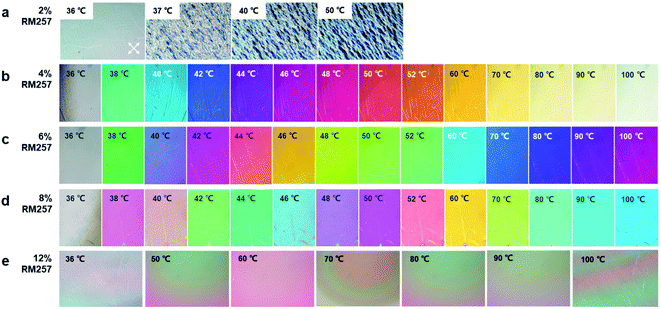
Next, based on the anchoring effect of LCN on LC, we further explored the laddered thermochromic effect of PNLC with different concentrations of RM257. Fig. 6a shows the result for a sample with 2% RM257 heated from 36 °C to 50 °C under crossed polars. At 36 °C, the sample showed a uniform gray color. When the temperature was raised to 37 °C, some part of the sample became dark. We propose that it was due to the nematic-to-isotropic phase transition of 5CB. When the temperature was increased further, the dark region expanded, leaving only white polymeric threads on the surface. Based on the result, we concluded that 2% of RM257 was insufficient to stabilize 5CB.When the sample with 4% RM257 was heated from 36 °C to 100 °C, continuous color changes were observed. The color gradually changed from cyan (38 °C), indigo (42 °C), purple (44 °C) to magenta (48 °C), orange (52 °C), yellow (70 °C), and white (100 °C). The color of the sample remained almost unchanged in this state when the temperature was further increased beyond 100 °C. Unlike the previous sample with 2% RM257, there was no sharp nematic-to-isotropic transition of 5CB observed at 37 °C. We hypothesized that 5CB was stabilized and anchored by the mesogenic units of the polymer formed by RM257. The hypothesis was consistent with the trend shown in Fig. 6b–d. With an increase in the RM257 concentration, the color transition became more gradual. For the 6% RM257 sample, the magenta color at 100 °C was similar to that of the 4% RM257 sample at 48 °C. In addition, we found that different RM257 concentrations resulted in different interference colors at the same temperature. For example, at 50 °C, the interference colors of the samples with 4%, 6%, and 8% RM257 were orange, green, and pink, respectively. At 80 °C, the interference colors were light yellow, violet, and indigo. Notably, once the concentration of RM257 was increased to 12%, the temperature-induced color change was not observed. As shown in Fig. 6e, the interference color of the sample with 12% RM257 had almost no variation until 100 °C. This is because 5CB was controlled by the strong anchoring energy imposed by the LCN, and only little birefringence variation could be obtained even at a high temperature. Moreover, it should be noted that when the temperature increased above 100 °C, the color variations of the samples were very small, resulting in low sensitivity. When the temperature decreases, there could be a return to the nematic phase, showing good reusability. Therefore, the color of PNLC has higher sensitivity to temperature in the range 36 °C to 100 °C when the concentration of RM257 was between 4% and 10%.
Temperature-dependent birefringence of PNLC
Next, we used the Michel-Levy chart to obtain the corresponding birefringence from each interference color of samples with 45 μm thickness as shown in Fig. 7.24 Initially, the birefringence Δn0 at 36 °C was 0.06. With an increase of temperature, Δn decreased. The decreasing rate slowed down gradually and became almost unchanged at a higher temperature. At 120 °C, the estimated Δn of samples with 4%, 6%, 8% and 10% RM257 were 0.004, 0.007, 0.009, and 0.011, respectively. For a higher RM257 concentration, a higher Δn was obtained in the end. As a comparison, for pure 5CB without RM257, the birefringence was always zero above TN–I.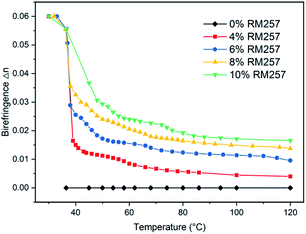 | ||
| Fig. 7 Birefringence (Δn) of the PNLC with different concentrations of RM257 at different temperatures from 36 °C to 120 °C. The estimated Δn values were obtained from the colorimetric responses shown in Fig. 6 according to the Michel-Levy chart. | ||
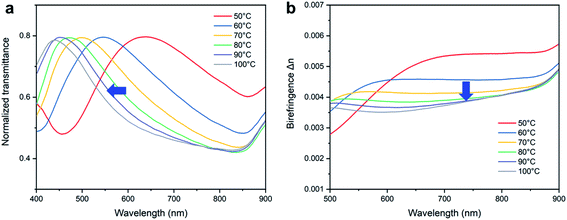
A better way to analyze the birefringence quantitatively is through transmission spectra and light retardance. In order to enhance the accuracy of the naked-eye sensor, we measured the transmission spectra of the PNLC films at different temperatures. The normalized transmittance I/I0 represents the light intensity transmitted through the birefringent nematic PNLC under crossed polars, which can be expressed by:28
 | (1) |
| R = Δnd | (2) |
The transmittance curves in Fig. 8a shifted towards shorter wavelength with an increase of temperature. By using the transmittance curve, the birefringence value can be estimated according to eqn (1) and (2). The resulting birefringence values (Δn) for the PNLC at different temperatures are depicted in Fig. 8b. Birefringence decreased with increasing temperature, which was close to the change in interference color obtained from the Michel-Levy chart.
Moreover, we noted that the decrease of Δn became slower and smaller with an increase of RM257 concentration in the sample. This is because higher RM257 concentration led to a denser LCN and provided stronger anchoring energy to LC, making the orientation of LC at the boundary harder to disturb. In this case, we speculated that a further color change of a sample with a higher RM257 concentration should be induced by higher temperature. Therefore, it should be possible to achieve a temperature sensing range from 36 °C until the phase transition temperature (140 °C) of the LCN.
Effect of LCN on the toluene-vapor-induced color profile in PNLC
It is known that LC shows a nematic-to-isotropic phase transition upon exposure to VOCs,19 which is similar to the thermal effect. Therefore, we hypothesized that the nematic PNLC system can be applied to toluene vapor sensing as well. It has been reported that the concentration of toluene vapor can be monitored with PNLC in a microchannel.23 To examine the toluene vapor-induced color profile in the PNLC, we prepared microchannels encapsulating PNLCs with different concentrations of RM257 through flow-driven planar alignment and polymerization (Fig. S2†). In this case, PNLC had a planar alignment due to the flow motion of the LC mixture in the microchannel.29The response of PNLC (with 4% to 10% of RM257) inside a microchannel to toluene vapor was investigated (Fig. 9). The toluene vapor concentration was 11![[thin space (1/6-em)]](https://www.rsc.org/images/entities/char_2009.gif) 500 ppm in the environment. The toluene vapor diffused from the open end of the microchannel into the PNLC, triggering an orientational change of the PNLC. The resulting gradient color profile along the long axis of the microchannel was light green, blue, purple, orange and yellow for the PNLC with 6% RM257, showing the decrease of Δn from the inner to the outer side.
500 ppm in the environment. The toluene vapor diffused from the open end of the microchannel into the PNLC, triggering an orientational change of the PNLC. The resulting gradient color profile along the long axis of the microchannel was light green, blue, purple, orange and yellow for the PNLC with 6% RM257, showing the decrease of Δn from the inner to the outer side.
We noted that despite the concentrations of RM257 in these samples being different, the diffusion length of toluene was almost the same. This result suggests that the diffusivity of toluene was not affected by the presence of the polymer network. It suggests that the toluene vapor diffused through 5CB, not through the polymer network. The result also implies that the concentration profiles of toluene in the microchannel were similar in all three cases. Interestingly, the color profiles of PNLCs were different (despite of the same toluene concentration profiles). As shown in Fig. 9, while the color at the open end of the sample containing 4% of RM257 was white, the open end of samples containing 6–10% of RM257 showed light yellow, magenta, and purple, respectively. But for the sample containing only 2% RM257, we did not observe the gradient color profile (Fig. S3†). The black part inside the strip suggests that the LC transfers into isotropic phase directly. For the sample containing 12% of RM257, the interference color through the channel has little variation even at high toluene vapor concentration.
Like the thermochromic effect, this phenomenon could also be explained by the anchoring effect of LCN. After exposure to toluene vapor, 5CB in the central domain of LCN entered an isotropic phase first. On the other hand, 5CB near the polymer chain underwent a different order of orientational change and transformed to an isotropic phase layer by layer. As discussed earlier, a denser polymer network provided stronger anchoring energy to 5CB, making it more stable and difficult to change orientation. Since the color at the open end of the microchannel represents the toluene vapor concentration in the environment, it can be used to detect toluene vapor effectively. The relationship between the estimated birefringence and toluene vapor concentration of each sample was obtained, as shown in Fig. S4.† With an increase of toluene vapor concentration, the birefringence decreases. The Δn of samples containing 4%, 6%, 8% and 10% RM257 at 11![[thin space (1/6-em)]](https://www.rsc.org/images/entities/char_2009.gif) 500 ppm are 0.004, 0.007, 0.009 and 0.011, respectively.
500 ppm are 0.004, 0.007, 0.009 and 0.011, respectively.
We also noticed that when the toluene vapor concentration decreased to a certain value, the color response was no longer visible and a dark band appeared at the open end. It is hard to determine the low toluene vapor concentration from the dark band. Therefore, the practical limit of detection of the toluene vapor sensor can be expressed by the dark band at the open end, as it indicates the smallest variation of Δn. We found that the dark band of the PNLCs with 4–10% RM257 appeared when exposed to 2300 ppm, 2800 ppm, 3300 ppm and 3500 ppm toluene vapor, respectively. Therefore, the sample with 4% RM257 will be more sensitive to toluene vapor due to the weaker anchoring energy of LCN to LC.
Conclusions
In summary, we demonstrated a temperature sensor based on a nematic PNLC with good sensitivity, a broad sensing range, reusability, and visualized colors. This system can also be applied to VOC sensing. The interference color variation came from the continuous change of birefringence of 5CB stabilized by mesogenic units in the backbone of LCN. Via adjusting the concentration of RM257 between 4% and 10%, we were able to obtain different interference color sequences in a wide temperature range from 36 °C to 100 °C with good sensitivity. Additionally, through an extended study of the toluene-vapor-induced color response in PNLC, we found that the presence of LCN would affect the birefringence of 5CB but would not hinder toluene vapor diffusion. This system can achieve a low limit of detection at 2300 ppm with 4% RM257. Our study shows that the stimuli-responsive nematic PNLC system has great potential for many naked-eye sensing applications.Author contributions
The manuscript was written through contributions from all authors.Conflicts of interest
There are no conflicts to declare.Acknowledgements
This work is supported by the Agency for Science, Technology and Research (A*STAR) in Singapore (1421200079), the Natural National Science Foundation of China (NSFC) (61875081), the Guangdong Basic and Applied Basic Research Foundation (2021B1515020097), and the Shenzhen Science and Technology Innovation Commission (JCYJ20180305180700747).References
- T. J. White and D. J. Broer, Nat. Mater., 2015, 14, 1087–1098 CrossRef CAS PubMed.
- D. Liu and D. J. Broer, Langmuir, 2014, 30, 13499–13509 CrossRef CAS PubMed.
- Y. Sasaki, M. Ueda, K. V. Le, R. Amano, S. Sakane, S. Fujii, F. Araoka and H. Orihara, Adv. Mater., 2017, 29, 1703054 CrossRef PubMed.
- R. Yamaguchi, K. Inoue and R. Kurosawa, J. Photopolym. Sci. Technol., 2016, 29, 289–292 CrossRef CAS.
- X. Hu, X. Zhang, W. Yang, X. F. Jiang, X. Jiang, L. T. Haan, D. Yuan, W. Zhao, N. Zheng, M. Jin, L. Shui, A. P. H. J. Schenning and G. Zhou, J. Appl. Polym. Sci., 2020, 137, 48917 CrossRef CAS.
- H. Sun, Z. Xie, C. Ju, X. Hu, D. Yuan, W. Zhao, L. Shui and G. Zhou, Polymers, 2019, 11, 694 CrossRef CAS PubMed.
- B.-H. Yu, S.-M. Ji, J.-H. Kim, J.-W. Huh and T.-H. Yoon, Opt. Mater., 2017, 69, 164–168 CrossRef CAS.
- S. Liu, Y. Li, P. Zhou, Q. Chen and Y. Su, Opt. Express, 2018, 26, 3394–3403 CrossRef CAS PubMed.
- C. Marcos, J. M. Sanchez Pena, J. C. Torres and J. I. Santos, Sensors, 2012, 12, 3204–3214 CrossRef CAS PubMed.
- J. F. Algorri, V. Urruchi, N. Bennis and J. M. Sanchez-Pena, Sensors, 2014, 14, 6571–6583 CrossRef CAS PubMed.
- I. A. Goncharenko and V. P. Kireenko, Meas. Tech., 2013, 56, 503–509 CrossRef.
- J. Li, S. Gauza, S.-T. Wu, T. T. Alkeskjold, J. Lægsgaard and A. Bjarklev, Mol. Cryst. Liq. Cryst., 2006, 453, 355–370 CrossRef CAS.
- M. Wang, H. Chen, X. Jing, S. Li, M. Ma, W. Zhang and Y. Zhang, Optik, 2020, 219, 165044 CrossRef CAS.
- H.-R. Kim, E. Jang and S.-D. Lee, IEEE Photonics Technol. Lett., 2006, 18, 905–907 Search PubMed.
- D. J. J. Hu, J. L. Lim, Y. Cui, K. Milenko, Y. Wang, P. P. Shum and T. Wolinski, IEEE Photonics J., 2012, 4, 1248–1255 Search PubMed.
- D. Wang, G. Chen and L. Wang, Opt. Fiber Technol., 2016, 29, 95–99 CrossRef CAS.
- C. McGinty, R. Reich, H. Clark and P. Bos, J. Appl. Phys., 2020, 127, 024504 CrossRef CAS.
- B. Drapp, D. Pauluth, J. Krause and G. Gauglitz, J. Anal. Chem., 1999, 364, 121–127 CAS.
- M. A. Bedolla Pantoja and N. L. Abbott, ACS Appl. Mater. Interfaces, 2016, 8, 13114–13122 CrossRef CAS PubMed.
- C. G. Reyes, A. Sharma and J. P. F. Lagerwall, Liq. Cryst., 2016, 43, 1986–2001 CrossRef CAS.
- J. Wang, A. Jákli and J. L. West, J. Mol. Liq., 2018, 267, 490–495 CrossRef CAS.
- D. M. Agra-Kooijman, C. Robb, Y. Guan, A. Jákli and J. L. West, Liq. Cryst., 2021, 1–8, DOI:10.1080/02678292.2021.1904522.
- Z. Liu, D. Luo and K. L. Yang, Lab Chip, 2020, 20, 1687–1693 RSC.
- K. R. Spring, M. J. Parry-Hill and M. W. Davidson, Michel-Levy Birefringence Chart.
- J. Yao, O. T. Picot, N. F. Hughes-Brittain, C. W. M. Bastiaansen and T. Peijs, Eur. Polym. J., 2016, 84, 642–651 CrossRef CAS.
- A. César, Liquid crystal mobility and PDLC memory effects, 2011 Search PubMed.
- V. Shibaev, in Polymer Science: A Comprehensive Reference, 2012, pp. 259–285, DOI: DOI:10.1016/b978-0-444-53349-4.00012-1.
- K. Morimoto, H. Tsujioka, D. Kitagawa and S. Kobatake, Bull. Chem. Soc. Jpn., 2019, 92, 1299–1304 CrossRef CAS.
- Z. Liu, D. Luo and K.-L. Yang, Soft Matter, 2019, 15, 5638–5643 RSC.
Footnote |
| † Electronic supplementary information (ESI) available: Additional DSC measurements, experimental set-up, POM images, and birefringence at different toluene vapor concentrations. See DOI: 10.1039/d1ra08030j |
| This journal is © The Royal Society of Chemistry 2021 |

