 Open Access Article
Phase engineering of cobalt hydroxide toward cation intercalation†
Jianbo
Li
a,
Zhenhua
Li
*a,
Fei
Zhan
b and
Mingfei
Shao
 *a
*a
aState Key Laboratory of Chemical Resource Engineering, Beijing University of Chemical Technology, Beijing 100029, P. R. China. E-mail: shaomf@mail.buct.edu.cn; LZH0307@mail.buct.edu.cn; Fax: +86-10-64425385; Tel: +86-10-64412131
bInstitute of High Energy Physics Institution, Chinese Academy of Sciences, Beijing 100029, P. R. China
First published on 15th December 2020
Abstract
Multi-cation intercalation in aqueous and neutral media is promising for the development of high-safety energy storage devices. However, developing a new host matrix for reversible cation intercalation as well as understanding the relationship between cation intercalation and the interlayer structure is still a challenge. In this work, we demonstrate layered cobalt hydroxides as a promising host for cation interaction, which exhibit high metal ion (Li+, Na+, K+, Mg2+ and Ca2+) storage capacities after phase transformation. Moreover, it is found that α-Co(OH)2 with an intercalated structure is more conducive to phase transition after electrochemical activation than β-Co(OH)2. As a result, the activated α-Co(OH)2 delivers four times higher capacity in multi-cation storage than activated β-Co(OH)2. Meanwhile, the α-Co(OH)2 after activation also shows an ultralong cycle life with capacity retention of 93.9% after 5000 cycles, which is also much superior to that of β-Co(OH)2 (∼74.8%). Thus, this work displays the relationship between cation intercalation and the interlayer structure of layered materials, which is important for designing multi-ion storage materials in aqueous media.
Introduction
It is known that metal-ion storage mechanisms for modern rechargeable devices, such as batteries and supercapacitors, are mainly divided into three types: alloying, conversion reaction and insertion mechanisms.1–3 Since the chemistry of reversible intercalation of lithium ions (Li+) within the interlayer of metal sulfides was explored in the 1960s, intercalation chemistry has been developed into one of the critical energy storage mechanisms.4,5 The reversible intercalation of guest ions within the interlayer of layered matrices causes the minimum damage to the main structure of the host materials and thus exhibits excellent structural stability compared to that of other energy storage mechanisms.6–8 The structure of layered materials is usually achieved via weak van der Waals bonding, electrostatic interaction and hydrogen-bonding interaction, which play a key role in the guest intercalation between the planar nanosheets.9–14 For example, graphite and layered LiMO2 (M = Co, Ni, Mn) have been extensively studied in commercial Li ion batteries as both the anode and cathode for Li+-intercalation.15–19 Recently, the reversible intercalation of other metal cations (e.g., Na+, K+, Mg2+, Ca2+, Zn2+, and Al3+) has also been attracting increasing attention to replace Li+ due to their abundant raw material reserves and low cost.20–25 However, to date, there have been only a limited number of layered materials, such as MXenes, MoS2 and Bi2O3, that show potential in hosting cations beyond Li+ due to the restricted channels and large diffusion resistance.26–28 Therefore, exploring layered materials for efficient embedding of multi-cations is promising but is still a critical challenge in this field.As typical layered materials, layered cobalt (Co)-based compounds have been the star materials in the field of metal ion storage for a long time. For example, layered lithium cobalt oxide (LiCoO2) was the earliest cathode material used in first-generation Li-ion batteries since the 1980s.29 Recently, LiCoO2 has also been used in supercapacitors with neutral aqueous electrolyte for safer energy devices.30,31 Unfortunately, it still shows poor capacity for other cations and suffers from low power density and stability in aqueous energy storage systems. Recently, our group found that the activated Co-based layered double hydroxide (LDH) with larger interlayer spacing is promising for intercalation of various cations (e.g., Li+, Na+, K+, Mg2+, Ca2+, and Zn2+) in aqueous solution.32 These studies indicate a trend that Co-based hydroxide or oxyhydroxides are suitable for cation storage in aqueous solution. It is also found that a phase transformation of hydroxide to oxyhydroxide is key for cation intercalation. However, different crystal phases for Co-based hydroxide probably give rise to different structure reconstruction processes during operation, which will largely determine their performances. Thus, it is important to study and understand the relationship between the cation intercalation and the crystal structure, which will guide us to design advanced materials for future aqueous energy devices.
Herein, we present 2D cobalt hydroxides with similar morphologies but different α- and β-crystal phase structures as models to explore their metal ion storage mechanism. Among them, α-Co(OH)2 is similar to hydrotalcite with a layered intercalation structure; β-Co(OH)2 is similar to brucite with a non-intercalation structure. All samples underwent an electrochemical activation treatment for surface reconstruction (denoted as E-α- and E-β-Co(OH)2). Interestingly, the E-α- and E-β-Co(OH)2 show definitely different cation storage performances: E-α-Co(OH)2 exhibits greatly improved performance for various metal ions (e.g., Li+, Na+, K+, Mg2+ and Ca2+) with capacitances of 191.0, 112.8, 89.2, 120 and 103.3 F g−1, respectively, which are 4 times larger than those of E-β-Co(OH)2. Meanwhile, E-α-Co(OH)2 also shows an ultralong cycle life with capacity retention of 93.9% after 5000 cycles at a high current density of 8 A g−1, which is far superior to that of E-β-Co(OH)2 (∼74.8% of the pristine value). Moreover, it is found that α-Co(OH)2 with an intercalated structure is more prone to phase transition, which is conducive to the improvement of ion storage. In contrast, with β-Co(OH)2 it is difficult to achieve phase transformation, leading to a limited capacity and relatively low stability.
Results and discussion
The α- and β-Co(OH)2 nanoplatelets were synthesized via a facile hydrothermal method (the detailed experimental process is given in the ESI†). As shown in Fig. 1a, the X-ray diffraction (XRD) pattern of α-Co(OH)2 shows a clear (003) reflection peak with the highest intensity, indicating a typical intercalation structure with an interlayer spacing of 0.78 nm, while β-Co(OH)2 exhibits a (100) reflection with a narrow interlayer spacing of 0.31 nm. The two materials are also significantly different in color with α-Co(OH)2 in green (Fig. 1b, inset) and β-Co(OH)2 in pink (Fig. 1c, inset). The morphology of the as-prepared α- and β-Co(OH)2 was studied by scanning electron microscopy (SEM). Both α-Co(OH)2 and β-Co(OH)2 exhibit a regular hexagonal plate-like structure with an adjacent-edge angle of 120° and lateral size of 2–3 μm (Fig. 1b and c, and S1a and b†). This is also confirmed by the transmission electron microscopy (TEM) images (Fig. 1di and ei). The high-resolution (HR)TEM images of two Co(OH)2 nanoplatelets show typical lattice fringes of 0.39 nm for α-Co(OH)2 (Fig. 1dii) and 0.27 nm for β-Co(OH)2 (Fig. 1eii), respectively, which correspond to the (006) and (110) crystal planes of the α- and β-phase, respectively.33–35 The selected area electron diffraction (SAED; inset in Fig. 1dii and eii) images of both α- and β-Co(OH)2 show well-defined hexagonally arranged spots, indicating the monocrystalline structure of the obtained materials. In addition, the EDX mapping results further demonstrate the uniform distribution of Co and O elements in α-Co(OH)2 and β-Co(OH)2 (Fig. 1diii and eiii).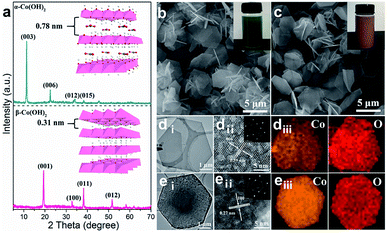 | ||
| Fig. 1 (a) XRD patterns, (b and c) SEM images, (d and e) low- and high-resolution TEM images and the corresponding EDX elemental mapping images of α-Co(OH)2 and β-Co(OH)2 (diii and eiii). | ||
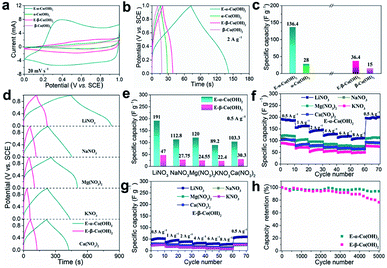
Previously, we found that the electrochemical activation (ECA) process in alkali solution could enhance the cation storage performance of LDHs.32,36 The α- and β-Co(OH)2 were also treated by the ECA strategy via a facile cyclic voltammetry (CV) process at a scan rate of 50 mV s−1 in the voltage window of 0–0.6 V in 1 M KOH (Fig. S2†). Then, the cation storage performance was further investigated in neutral LiNO3 aqueous solution. The CV curves in Fig. 2a show that the capacitances of the initial α-Co(OH)2 and β-Co(OH)2 are negligible. Interestingly, the ECA treatment can significantly enlarge the CV curves of α-Co(OH)2 (denoted as E-α-Co(OH)2), while there is just little enlargement for E-β-Co(OH)2. The galvanostatic (GV) curves in Fig. 2b show that the E-α-Co(OH)2 exhibits a capacity of 136.4 F g−1 at 2 A g−1 (Fig. 2c), which is almost 5 times larger than that of the initial α-Co(OH)2 (28 F g−1). However, there is only little improvement for E-β-Co(OH)2 from 15 F g−1 to 36 F g−1. Moreover, electrochemical impedance spectroscopy (EIS) measurement was used to investigate the resistance of α- and β-Co(OH)2 before and after the ECA process. As shown in Fig. S3,† the Nyquist plots of the EIS spectra show that the initial α- and β-Co(OH)2 electrodes exhibited similar charge transfer resistance (Rct). After the ECA process, the ion diffusion with the E-α-Co(OH)2 electrode is obviously improved, while there is just little improvement for E-β-Co(OH)2 electrode, indicating an obviously decreased resistance for the intercalation of metal ions into E-α-Co(OH)2. The above results demonstrate that the performance of Co(OH)2 is significantly influenced by the phase structure: the capacitance of E-α-Co(OH)2 is significantly better than that of E-β-Co(OH)2. In order to highlight the effect of the ECA process, Co(OH)2 with different phases was immersed into 1 M KOH solution for 24 h. The XRD and XPS results show that the immersion of Co(OH)2 with different phases does not assist in the performance improvement (Fig. S4†).
Moreover, we investigated the electrochemical storage performances of E-α-Co(OH)2 and E-β-Co(OH)2 for various cations. The findings from CV at varied scan rates and the GV technique at different charge/discharge current densities are shown in Fig. S5–S7,† indicating typical ion intercalation behavior due to obvious redox peaks for different metal ions. Fig. 2d shows the GV curves of two Co(OH)2 samples at 0.5 A g−1 in different electrolytes (NaNO3, Mg(NO3)2, KNO3, and Ca(NO3)2, respectively). The E-α-Co(OH)2 exhibits high specific capacities of 112.8, 89.2, 120 and 103.3 F g−1 for Na+, K+, Mg2+ and Ca2+, respectively, which are almost 4 times larger than those of the E-β-Co(OH)2 electrode with specific capacities of 27.75, 24.55, 22.4 and 30.3 F g−1 (Fig. 2e). As the ion radius increases, the corresponding specific capacity decreases (Li+ > Na+ > K+). High-valence metal ions (Mg2+, Ca2+) theoretically provide higher energy storage capacity than monovalent metal ions (Mg2+, Ca2+ > Li+, Na+, K+). But the specific capacity of Mg2+ and Ca2+ (120 F g−1 and 103.3 F g−1, respectively) is much lower than that of Li+ (191.0 F g−1) based on the E-α-Co(OH)2 electrode. This is probably due to the stronger electrostatic interaction between high-valence metal ions and the anions of the active component on the electrode,37–40 which hinders their diffusion and thus makes it difficult for them to freely insert into and extract from the crystal structure of materials. Besides, high-valence ions also have a strong solvation effect in the electrolyte, making it difficult for them to diffuse in ion channels.37
Fig. 2f and g show the rate capability of E-α- and E-β-Co(OH)2. E-α-Co(OH)2 exhibits high capacities of 191.0, 155.4, 136.4, 121.6 and 112.8 F g−1 for Li+ at 0.5, 1, 2, 4, and 6 A g−1, respectively. The capacity remains at 104.8 F g−1 (54.8% of the pristine value) even at a high current density of 8 A g−1 and it can be fully recovered when the current is turned back to 0.5 A g−1. The same rule applies to Na+, K+, Mg2+ and Ca2+. In contrast, E-β-Co(OH)2 shows a low specific capacity under different current densities. It should be noted that both E-α-Co(OH)2 and E-β-Co(OH)2 have higher Li+ storage capacity due to the smaller ionic radius of Li+ than other cations. It should be noted that the performances of the powder E-α-Co(OH)2 can be significantly improved by constructing a nanosheet array architecture on the electrode (Fig. S8†), which showed higher capacities of 420, 280.6, 243, 350 and 287 F g−1 for Li+, Na+, K+, Mg2+ and Ca2+, superior to most of the reported counterparts in the literature (Table S1†). The cyclability of E-α- and E-β-Co(OH)2 was further evaluated at 8 A g−1. As shown in Fig. 2h, E-α-Co(OH)2 exhibits good cycling stability with a capacity retention of 93% after 5000 cycles, indicating satisfactory stability. However, the specific capacitance of E-β-Co(OH)2 undergoes a rapid decay during cycling and only retains 74.8% of the pristine value. Furthermore, the pH of electrolyte remained neutral during the test (Fig. S9†), indicating that the charge/discharge process is mainly driven by the extraction and insertion of metal ions.
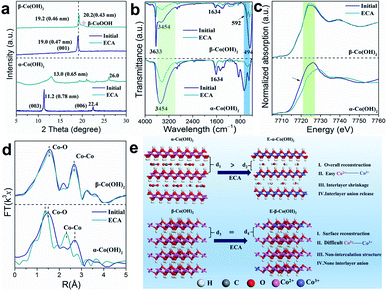
To explore the reason for the different energy storage behaviors, the crystal structure and coordination environment of the different Co(OH)2 samples was further studied. After the ECA process, the (003) reflection of α-Co(OH)2 shows a right shift from 11.2° to 13.0° along with a reduction in crystallinity (Fig. 3a). Meanwhile, the (006) peak also shifts to higher angle from 22.4° to 26.0°, indicating a great extent of phase change in α-Co(OH)2 that is similar to γ-CoOOH.41 Although it has larger interlayer spacing, the surface of the initial α-Co(OH)2 is fully covered by OH−, which has a serious repulsive effect on the cations. After the ECA process, the interlayer spacing of E-α-Co(OH)2 decreases due to the release of interlayer anions, which provides a convenient channel for cation intercalation. As for β-Co(OH)2, there is only a slight shift from 19.0° to 19.2° for the (001) peak, indicating that β-Co(OH)2 is not conducive to structure reconstruction during the ECA process. Fig. 3b shows the Fourier transform infrared (FTIR) spectra of α- and β-Co(OH)2 before and after ECA. The FTIR spectra show that the initial Co–OH bending vibration at 798 cm−1 of E-α-Co(OH)2 vanishes and an O–Co–O vibration at 568 cm−1 appears, indicating the conversion of Co(OH)2 to CoOOH. However, the β-Co(OH)2 is hard to fully activate and both Co–OH and O–Co–O peaks are observed from the FTIR spectrum. Moreover, the peaks at 3600 to 3200 cm−1 (corresponding to the stretching of the –OH) and 1634 cm−1 (corresponding to the interlayer carbonate species) decrease significantly after the ECA process, demonstrating the loss of –OH and carbonate in the E-α-Co(OH)2. Correspondingly, the amount of –OH in β-Co(OH)2 is also decreased to a certain extent. Besides, the peak intensity of –OH in α-Co(OH)2/E-α-Co(OH)2 is much higher than that of β-Co(OH)2/E-β-Co(OH)2 due to the existence of interlayer H2O, which should act as an effective spacer to stabilize the layered structure of α-Co(OH)2. In order to prove the effect of interlayer water, thermogravimetry analysis (TGA, Fig. S10a†) of α-Co(OH)2 in air was conducted, which presents the loss of intercalated water occurring at ∼150 °C. The XRD patterns of α-Co(OH)2 before and after heating at 150 °C for 2 h show that the interlayer spacing of α-Co(OH)2 slightly decreases (Fig. S10b and c†), further indicating the release of interlayer water. In the subsequent performance test, the capacity of E-α-Co(OH)2 without interlayer H2O greatly reduced (Fig. S10d and e†), suggesting that the existence of interlayer water in α-Co(OH)2 plays a vital role in the metal ion storage.
Fig. 3c shows the Co K-edge extended X-ray absorption fine structure (EXAFS) spectra of different Co(OH)2 samples. When compared with α-Co(OH)2, the white line of E-α-Co(OH)2 displays a significant right shift to higher binding energy (∼6.3 eV; similar to CoOOH), demonstrating that the valence of Co increases from 2+ to 3+. However, there is little valence change between β-Co(OH)2 and E-β-Co(OH)2. This result further proves that the intercalation structure of α-Co(OH)2 is more prone to phase transformation, which will be more conducive to the improvement of ion storage performance. The Fourier transform (FT)-EXAFS was also studied to obtain detailed bonding and coordination information on the Co site. As shown in Fig. 3d, the R-space spectra of the initial α-Co(OH)2 show typical Co–O and Co–Co bonds with peaks centred at 2.10 and 3.10 Å. After the ECA process, the positions of the Co–O and Co–Co peaks shifted significantly (2.10 to 1.90 Å and 3.10 to 2.85 Å, respectively), indicating the formation of Co3+-OOH for E-α-Co(OH)2.42–45 As for β-Co(OH)2, the R-space spectra show almost no change after ECA, which is consistent with the results of XRD and FTIR. The above results indicate that the α-Co(OH)2 with an intercalated structure is more prone to phase transition to CoOOH after the ECA process. In contrast, with β-Co(OH)2 it is difficult to achieve phase transformation and just surface reconstruction occurs (Fig. 3e).
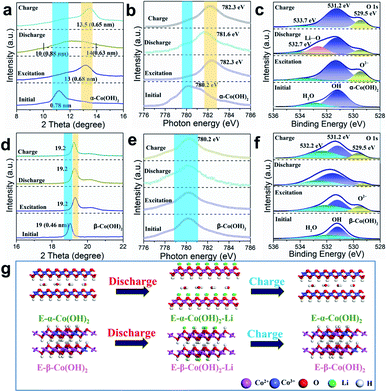
We further employed the ex situ XRD technique to investigate the structure evolution of E-α- and E-β-Co(OH)2 during the charge/discharge process in LiNO3 electrolyte. As shown in Fig. 4a, the XRD patterns of E-α-Co(OH)2 display a left shift for the (003) diffraction peak during the discharge process with the interlayer spacing expanded to 0.63–0.88 nm, which is ascribed to the intercalation of Li+ in E-α-Co(OH)2. After a subsequent charging process, the (003) peak position is fully recovered due to the extraction of Li+. In contrast, there is no obvious peak shift for E-β-Co(OH)2 (Fig. 4d), indicating that it is hard to intercalate Li+ into E-β-Co(OH)2. X-ray absorption near edge spectroscopy (XANES) spectra were recorded to obtain more detailed information on E-Co(OH)2 during the charge/discharge process to determine the real cation storage mechanism. As shown in Fig. 4b, the Co L3-edge XANES spectra of E-α-Co(OH)2 display a shift to the higher energy level after discharge, indicating a valence decrease of Co3+. During the subsequent extraction process, the valence state of Co can be recovered to the original level. This is similar to the Co 2p XPS result (Fig. S11†), indicating that the intercalation/extraction of Li+ is accompanied by the valence change of Co. As for E-β-Co(OH)2, the valence state of Co shows no significant change during the full charge/discharge cycle (Fig. 4e). Furthermore, the content of Co2+ and Co3+ in Co(OH)2 with different phases in various states is summarized in Table S2.† The above results prove that the valence change of Co is directly related to the storage capacity of Li, which effectively explains the low capacity of E-β-Co(OH)2.
As for the O element in the E-Co(OH)2 samples, both the O1s XPS spectra of E-α-Co(OH)2 and E-β-Co(OH)2 show a new peak at 529.5 eV, which is a typical O2− peak (Fig. 4c and f), indicating that the ECA process reconstructs the chemical environment of O on the surface of the E-α- and E-β-Co(OH)2. The significantly enhanced capacity of E-α-Co(OH)2 compared to that of α-Co(OH)2 mainly benefits from the formation of terminal-oxygen on the surface of α-Co(OH)2, which has strong adsorption ability toward metal ions to facilitate their storage. During the charge/discharge process, the O2− peak and a new peak at higher binding energy (532.9 eV) change reversibly in E-α-Co(OH)2 due to the (de)intercalation/interaction of Li ions. In contrast, the O2− peak in E-β-Co(OH)2 changes slightly and no new peaks are generated, suggesting its inferior lithium storage properties. Based on the above results, we can draw the following conclusions (Fig. 4g): during the ECA process, α-Co2+(OH)2 gradually undergoes phase transformation to Co3+OOH, which is accompanied by hydrogen removal to expose oxygen on the host layers of α-Co2+(OH)2 and the overflow of interlayer carbonate. The exposed oxygen provides plentiful storage sites for metal cations. In contrast, β-Co(OH)2 with the non-intercalation structure achieves phase transformation with difficulty and just generates a small amount of CoOOH structure on the surface. During the charge/discharge process, E-α-Co(OH)2 shows a reversible change of Co valence state and interlayer distance, indicating the reversible storage of cations in the interlayer. However, just surface cation storage occurs for E-β-Co(OH)2 with no changes in the interlayer distance and valence state of Co, causing limited cation storage capacitance.
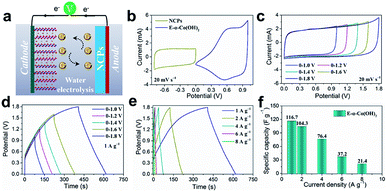
To demonstrate the practical application of the E-α-Co(OH)2, we assembled an asymmetric metal cation supercapacitor (AMCS) by using the E-α-Co(OH)2 as the cathode, N-doped carbon particles (NCPs; Fig. S12†) as the anode, and 2 M LiNO3 as the electrolyte (Fig. 5a). The storage charge (Q+ = Q−) between the two electrodes has been balanced and the mass loading of the anode was twice that of the cathode. Fig. 5b shows the CV curves of E-α-Co(OH)2 and NCPs. Among them, the E-α-Co(OH)2 shows an optimized voltage window between 0 and 1.0 V, and for the NCPs it is between −0.8 and 0 V. This guarantees that the AMCS device delivers a high charge/discharge voltage up to 1.8 V. Meanwhile, the corresponding CV curves are quasi-rectangular between 0 and 1.8 V (Fig. 5c). Fig. 5d shows nearly symmetric GV curves of the AMCS for E-α-Co(OH)2, suggesting good charge storage behaviors and high reversibility of the AMCS device at different voltages. Moreover, the CV curves of the AMCS at different voltage ranges (Fig. 5c) and various scan rates (5–100 mV s−1; Fig. S13†) show that this device can successfully work between 0 and 1.8 V, implying a rapid and reversible charge storage procedure. Based on the corresponding discharge time (Fig. 5e and f), the device delivers capacitances of 116.7, 104.3, 76.4, 37.2 and 21.4 F g−1 at current densities of 1, 2, 4, 6 and 8 A g−1, respectively. In contrast, the device with the E-β-Co(OH)2 cathode just shows a very limited capacity of 3 F g−1 at 8 A g−1, which again illustrates its poor ability for ion/charge storage (Fig. S14†). Therefore, the E-α-Co(OH)2 material in this work brings new opportunities for developing high-performance and low-cost multi-ion storage materials to meet the requirements of more secure aqueous energy storage devices.
Conclusions
In summary, Co(OH)2 with different crystal phase structures (α- and β-Co(OH)2) exhibit significant differences in cation storage after electrochemical treatment, where E-α-Co(OH)2 shows a higher capacity and more stability for metal ion storage than E-β-Co(OH)2. Based on the results of ex situ XRD analysis, XANES and XPS, we found that the α-Co(OH)2 with an intercalation structure is more prone to generating the Co–OOH phase than β-Co(OH)2, which greatly improves the cation storage performances with higher specific capacity, better rate performance, higher active site utilization and good structural stability during cycling. For practical application, the assembled full AMCS with an E-α-Co(OH)2 cathode exhibits superior capabilities, indicating great application potential in energy storage devices. This work opens up an opportunity to understand the relationship between cation intercalation and the crystal structure, which will be beneficial to design and enrich advanced multi-ion storage materials for future energy storage systems.Conflicts of interest
There are no conflicts to declare.Acknowledgements
This work was supported by the National Natural Science Foundation of China (21922501 and 21521005) and the Fundamental Research Funds for the Central Universities (XK1802-6 and XK1803-05).Notes and references
- H. W. Song, J. Su and C. X. Wang, Adv. Energy Mater., 2019, 9, 1900426 CrossRef.
- J. Su, H. W. Song and C. X. Wang, Adv. Funct. Mater., 2019, 29, 1907154 CrossRef CAS.
- Y. Mizuno, M. Okubo, E. Hosono, T. Kudo, K. Oh-ishi, A. Okazawa, N. Kojima, R. Kurono, S. Nishimura and A. Yamada, J. Mater. Chem. A, 2013, 1, 13055–13059 RSC.
- J. Rouxel, M. Danot and J. Bichon, Bull. Soc. Chim. Fr., 1971, 3930–3936 CAS.
- J. B. Goodenough and H. C. Gao, Sci. China: Chem., 2019, 62, 1555–1556 CrossRef CAS.
- H. F. Liang, Z. Cao, F. W. Ming, W. L. Zhang, D. H. Anjum, Y. Cui, L. Cavallo and H. N. Alshareef, Nano Lett., 2019, 19, 3199–3206 CrossRef CAS PubMed.
- Y. Qian, S. Jiang, Y. Li, Z. Yi, J. Zhou, J. Tian, N. Lin and Y. T. Qian, Angew. Chem., Int. Ed., 2019, 131, 18276–18283 CrossRef.
- W. H. Li, Q. L. Ning, X. T. Xi, B. H. Hou, J. Z. Guo, Y. Yang, B. Chen and X. L. Wu, Adv. Mater., 2019, 31, 1804766 CrossRef PubMed.
- J. L. Liu, T. T. Yin, B. B. Tian, B. W. Zhang, C. Qian, Z. Q. Wang, L. L. Zhang, P. Liang, Z. Chen, J. X. Yan, X. F. Fan, J. Y. Lin, X. H. Chen, Y. Z. Huang, K. P. Loh and Z. X. Shen, Adv. Energy Mater., 2019, 9, 1900579 CrossRef.
- Z. L. Xu, G. B. Yoon, K.-Y. Park, H. Park, O. Tamwattana, S. J. Kim, W. M. Seong and K. Kang, Nat. Commun., 2019, 10, 2598 CrossRef PubMed.
- S. Q. Zhao, L. B. Dong, B. Sun, K. Yan, J. Q. Zhang, S. W. Wan, F. R. He, P. Munroe, P. H. L. Notten and G. X. Wang, Small, 2020, 16, 1906131 CrossRef CAS PubMed.
- C. Zhu, X. K. Mu, P. A. van Aken, Y. Yu and J. Maier, Angew. Chem., Int. Ed., 2014, 53, 2152–2156 CrossRef CAS PubMed.
- M. L. Mao, C. Y. Cui, M. G. Wu, M. Zhang, T. Gao, X. L. Fan, J. Chen, T. H. Wang, J. M. Ma and C. S. Wang, Nano Energy, 2018, 45, 346–352 CrossRef CAS.
- X. F. Duan and Y. Xu, Acta Phys.-Chim. Sin., 2019, 35, 1039–1040 Search PubMed.
- F. X. Wu, J. Maier and Y. Yu, Chem. Soc. Rev., 2020, 49, 1569–1614 RSC.
- J. Lu, Q. Peng, W. Y. Wang, C. Y. Nan, L. H. Li and Y. D. Li, J. Am. Chem. Soc., 2013, 135, 1649–1652 CrossRef CAS PubMed.
- S. H. Jung, U.-H. Kim, J. H. Kim, S. Jun, C. S. Yoon, Y. S. Jung and Y.-K. Sun, Adv. Energy Mater., 2020, 10, 1903360 CrossRef CAS.
- M. D. Radin, J. Vinckeviciute, R. Seshadri and A. V. D. Ven, Nat. Energy, 2019, 4, 639–646 CrossRef CAS.
- Y. M. Huang, Y. H. Dong, S. Li, J. Lee, C. Wang, Z. Zhu, W. J. Xue, Y. Li and J. Li, Adv. Energy Mater., 2020, 2000997 Search PubMed.
- Z. L. Xu, G. B. Yoon, K. Y. Park, H. Park, O. Tamwattana, S. J. Kim, W. M. Seong and K. Kang, Nat. Commun., 2019, 10, 2598 CrossRef PubMed.
- L. Fan, R. F. Ma, Q. F. Zhang, X. X. Jia and B. G. Lu, Angew. Chem., Int. Ed., 2019, 58, 10500–10505 CrossRef CAS PubMed.
- Y. N. Xu, X. W. Deng, Q. D. Li, G. B. Zhang, F. Y. Xiong, S. S. Tan, Q. L. Wei, J. Lu, J. T. Li, Q. Y. An and L. Q. Mai, Chem, 2019, 5, 1194–1209 CAS.
- S. Huang, F. Wan, S. S. Bi, J. C. Zhu, Z. Q. Niu and J. Chen, Angew. Chem., Int. Ed., 2019, 58, 4313–4317 CrossRef CAS PubMed.
- X. M. Xu, M. Y. Duan, Y. F. Yue, Q. Li, X. Zhang, L. Wu, P. J. Wu, B. Song and L. Q. Mai, ACS Energy Lett., 2019, 4, 1328–1335 CrossRef CAS.
- F. Wu, H. Y. Yang, Y. Bai and C. Wu, Adv. Mater., 2019, 31, 1806510 CrossRef PubMed.
- M. R. Lukatskaya, O. Mashtalir, C. E. Ren, Y. Dall'Agnese, P. Rozier, P. L. Taberna, M. Naguib, P. Simon, M. W. Barsoum and Y. Gogotsi, Science, 2013, 341, 1502–1505 CrossRef CAS PubMed.
- M. Acerce, D. Voiry and M. Chhowalla, Nat. Nanotechnol., 2015, 10, 313–318 CrossRef CAS PubMed.
- W. Zuo, W. Zhu, D. Zhao, Y. Sun, Y. Li, J. Liu and X. W. Lou, Energy Environ. Sci., 2019, 9, 2881–2891 RSC.
- J. N. Zhang, Q. Li, C. Ouyang, X. Yu, M. Ge, X. Huang, E. Hu, C. Ma, S. Li, R. Xiao, W. Yang, Y. Chu, Y. Liu, H. Yu, X. Q. Yang, X. Huang, L. Chen and H. Li, Nat. Energy, 2019, 4, 594–603 CrossRef CAS.
- Y. N. Xu, Y. Y. Dong, X. Han, X. F. Wang, Y. J. Wang, L. F. Jiao and H. T. Yuan, ACS Sustainable Chem. Eng., 2015, 3, 2435–2442 CrossRef CAS.
- Y. N. Xu, L. Z. Ding, T. S. Zhong, X. Han, L. F. Jiao, H. T. Yuan and Y. J. Wang, J. Energy Chem., 2015, 24, 193–198 CrossRef.
- Z. H. Li, H. H. Duan, M. F. Shao, J. B. Li, D. O'Hare, M. Wei and Z. L. Wang, Chem, 2018, 4, 2168–2179 CAS.
- Y. Wang, C. X. Yang, Z. M. Li, Z. Z. Liang and G. Z. Cao, Small, 2020, 16, 2001973 CrossRef CAS PubMed.
- L. Wang, C. Lin, F. X. Zhang and J. Jin, ACS Nano, 2014, 8, 3724–3734 CrossRef CAS PubMed.
- F. Song and X. L. Hu, Nat. Commun., 2014, 5, 4477 CrossRef CAS PubMed.
- Z. H. Li, K. Liu, K. Fan, Y. S. Yang, M. F. Shao, M. Wei and X. Duan, Angew. Chem., Int. Ed., 2019, 58, 1–6 CrossRef.
- E. N. Keyzer, H. F. J. Glass, Z. G. Liu, P. M. Bayley, S. E. Dutton, C. P. Grey and D. S. Wright, J. Am. Chem. Soc., 2016, 138, 8682–8685 CrossRef CAS PubMed.
- H. D. Yoo, Y. L. Liang, H. Dong, J. H. Lin, H. Wang, Y. S. Liu, L. Ma, T. P. Wu, Y. F. Li, Q. Ru, Y. Jing, Q. Y. An, W. Zhou, J. H. Guo, J. Lu, S. T. Pantelides, X. F. Qian and Y. Yao, Nat. Commun., 2017, 8, 339 CrossRef PubMed.
- Z. Y. Li, X. K. Mu, Z. R. Zhao-Karger, T. Diemant, R. J. Behm, C. Kübel and M. Fichtner, Nat. Commun., 2018, 9, 5115 CrossRef PubMed.
- G. Liu, Q. G. Chi, Y. Q. Zhang, Q. G. Chen, C. H. Zhang, K. Zhu and D. X. Cao, Chem. Commun., 2018, 54, 9474–9477 RSC.
- R. Subbaraman, D. Tripkovic, K. C. Chang, D. Strmcnik, A. P. Paulikas, P. Hirunsit, M. Chan, J. Greeley, V. Stamenkovic and N. M. Markovic, Nat. Mater., 2012, 11, 550–557 CrossRef CAS PubMed.
- J. H. Huang, J. T. Chen, T. Yao, J. F. He, S. Jiang, Z. H. Sun, Q. H. Liu, W. R. Cheng, F. C. Hu, Y. Jiang, Z. Y. Pan and S. Q. Wei, Angew. Chem., Int. Ed., 2015, 54, 8722–8727 CrossRef CAS PubMed.
- H. Wang, E.-M. Feng, Y.-M. Liu and C.-Y. Zhang, J. Mater. Chem. A, 2019, 7, 7777–7783 RSC.
- L. Aguilera, P. C. M. Aguiar, Y. Leyet Ruiz, A. Almeida, J. Agostinho Moreira, R. R. Passos and L. A. Pocrifka, J. Mater. Sci.: Mater. Electron., 2020, 31, 3084–3091 CrossRef CAS.
- J. H. Huang, Q. H. Liu, T. Yao, Z. Y. Pan and S. Q. Wei, J. Phys.: Conf. Ser., 2016, 712, 012128 CrossRef.
Footnote |
| † Electronic supplementary information (ESI) available: Experimental section and characterization. See DOI: 10.1039/d0sc06250b |
| This journal is © The Royal Society of Chemistry 2021 |

