 Open Access Article
Metabolic mechanisms of a drug revealed by distortion-free 13C tracer analysis†
Jin Wook
Cha‡
 a,
Xing
Jin‡
b,
Sihyang
Jo
b,
Yong Jin
An
 *b and
Sunghyouk
Park
 *b
*b
aNatural Product Informatics Research Center, KIST Gangneung Institute of Natural Products, Gangneung, 25451, Korea
bNatural Product Research Institute, College of Pharmacy, Seoul National University, 1 Gwanak-ro, Gwanak-gu, Seoul 08826, Korea. E-mail: biochem.yong@gmail.com; psh@snu.ac.kr
First published on 24th February 2021
Abstract
Metabolomic isotopic tracing can provide flux information useful for understanding drug mechanisms. For that, NMR has the unique advantage of giving positional isotope enrichment information, but the current 13C 1D NMR approach suffers from low sensitivity and high overlaps. We developed a new 2D heteronuclear NMR experiment incorporating J-scaling and distortion-free elements that allows for quantitative analysis of multiplets with high sensitivity and resolution. When applied to an old chemotherapeutic drug, the approach provided a quantitative estimation of TCA-cycle turns, confirming the conventional mechanism of its mitochondrial metabolic enhancement. Additionally, the approach identified a new mechanism of the higher contribution of the pentose phosphate pathway to serine synthesis in the cytosolic compartment, possibly explaining the broad pharmacological activities of the drug. Our approach may prove beneficial in helping to find new usages or metabolic mechanisms of other drugs.
Introduction
For the last two decades, the development of metabolomics has brought about a new paradigm wherein abnormal metabolism is considered a fundamental factor underlying various diseases including cancer as well as immune and neurodegenerative diseases.1–3 Whereas metabolomics measures concentrations of metabolites, it does not always provide the flux, which is the actual indicator of the efficiency of metabolic pathways. Flux information can be obtained by isotopomer analysis using stable isotopic tracers, mostly 13C, with liquid chromatography-mass spectrometry (LC-MS)4 or nuclear magnetic resonance (NMR) spectroscopy.5 Related to the latter, magnetic resonance spectroscopy6 and hyperpolarized magnetic resonance imaging7 are being applied for flux studies. Compared with LC-MS, the merits of NMR include provision of positional information of the 13C atom from a tracer, reproducibility, and structural information of the metabolites. However, it suffers lower sensitivity, which is even more problematic for 13C-NMR that has been the major approach in NMR isotopomeric analysis.5,8,9 In addition, the 1D 13C-NMR often has insufficient resolution for the complex mixtures used in metabolomic settings. Related hyperpolarization techniques could overcome the sensitivity issue for short-term flux analysis, but long-term and detailed isotopomeric analysis remains challenging. Therefore, an approach that can yield high-sensitivity, high-resolution positional isotope enrichment information has been highly desired.A simple solution for the 13C sensitivity issue would be 1H-detected heteronuclear 2D NMR. However, there are two major hurdles for routine use of this approach. One is the poor resolution of the indirect domain due to the nature of the detection and limited experimental time. This problem has been partly addressed using non-uniform sampling (NUS),10,11 but only for qualitative estimation of metabolism. In addition, NUS does not give as linear a relationship as straightforward Fourier transform, thus incurring difficulties in quantitative analysis. Another problem is the phase distortion within 13C multiplets in routine 2D heteronuclear NMR experiments with 13C tracers;12 this prevents quantitative analysis of individual multiplets required for detailed metabolic pathway analysis. These factors have made the 2D approach rarely usable in most quantitative isotopic tracer experiments, and 13C-NMR has been employed instead, despite the disadvantages.
If properly applied, isotopomer analysis can provide valuable insights into mechanistic targets of drugs. Actually, most drugs have multiple targets, either known or unknown, as termed by “polypharmacology”,13 and finding new targets of existing drugs can lead to wider uses of those drugs. As drugs modulating metabolism have higher chances of multiple targets due to the intricately connected metabolic pathways,14,15 an efficient means of investigating metabolic drug mechanisms will certainly benefit drug usage and development.
Results and discussion
Design of a new J-scaled distortion-free 2D heteronuclear NMR experiment
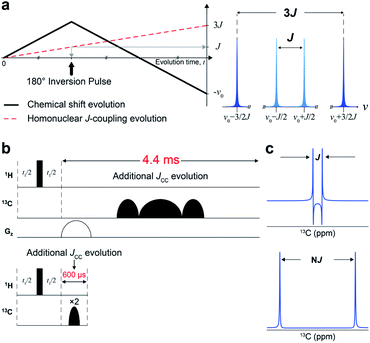
We designed a new NMR experiment that can provide quantitative metabolic assessment while addressing the problems of 2D NMR stated above. First, the low-resolution problem was addressed with J-scaling,16 which gives wider separation within multiplets (higher resolution) (Fig. 1a). As the J-scaling is used with Fourier transform, it retains the linear relationship, obviating the non-quantitative NUS approach for resolution enhancement. The second issue of phase distortion occurs due to the homonuclear JCC evolution during the long time block (∼4.4 ms) for t1-noise reduction and frequency discrimination (t1) (Fig. 1b and S1†). We, therefore, moved the gradient and long carbon pulses out of the period and used a pair of short adiabatic inversion pulses of only 300 μs duration (total 600 μs), thereby practically eliminating the deleterious JCC evolution (Fig. 1c). Optimally incorporating these elements into a 2D pulse sequence gave a new sensitive and distortion-free NMR experiment (Fig. S2†). Analytical simulation of this new experiment provided essentially distortion-free and well-resolved multiplets for the usual JCC values (30–60 Hz) (Fig. S3†).Quantitative and distortion improvement evaluation of new J-scaled HSQC
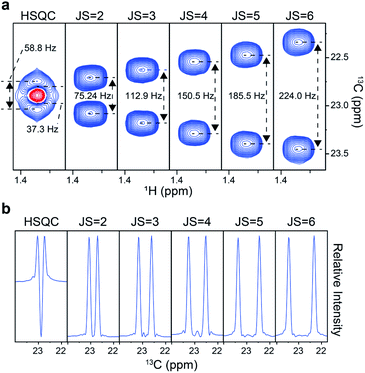
We first tested the experiment on a frequently used 13C metabolic tracer, U-13C3-lactate. A conventional 2D heteronuclear single quantum coherence (HSQC) spectrum gave a fused doublet with distorted peak shapes (Fig. 2a). In comparison, our distortion-free approach gave proportionally separated doublets according to the scaling factor, thus demonstrating the improvement in the effective resolution. Accordingly, the vertical 1D slice of the original HSQC exhibited a large negative dip in the center, whereas those from our approach exhibited a clean baseline with regular peak shapes (Fig. 2b). Therefore, it was clear that quantitative assessment of individual peaklets is possible only with those obtained with the new approach. For the optimal J-scaling factor, on one hand, a smaller value may result in insufficient separation of multiplets; on the other hand, a larger scaling factor may cause peaklet-overlaps with those from other peaks or unnecessary splitting by long-range couplings. In addition, the final resolution of the J-scaling approach is also affected by indirect time domain points, spectral width, and the magnetic field strength. For usual metabolomic isotopomer analysis in our NMR setting, the scaling factor of 6 resolved most of the important multiplets without pronounced overlaps or long-range splitting.Next, actual quantitation of isotopomers was performed. For this, a 1![[thin space (1/6-em)]](https://www.rsc.org/images/entities/char_2009.gif) :
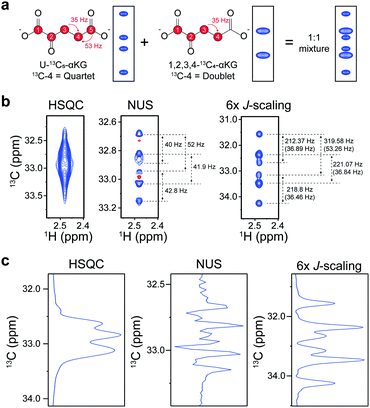
:![[thin space (1/6-em)]](https://www.rsc.org/images/entities/char_2009.gif) 1 mixture of isotopomers of alpha-ketoglutarate (αKG) (U-13C5-αKG and 1,2,3,4-13C4-αKG), an important intermediate in the TCA-cycle, was used. Each isotopomer should contribute to the final spectrum as a quartet and a doublet of C4, respectively, giving a total of 6 peaklets (Fig. 3a). The C4 doublet to quartet ratio (Q/D ratio) is an important metabolic parameter that has been conventionally obtained by 13C NMR isotopomer analysis.5 Therefore, we tried it using our 2D experiment with an order-of-magnitude-higher sensitivity and also compared it with a NUS approach that gives high resolution.10 The original HSQC could not resolve the individual peaklets, hampering any further analysis (Fig. 3b). The NUS approach, although it gave the expected 6 peaklets, exhibited negative peaks from phase distortion. In contrast, our new approach gave readily identifiable in-phase 2D peaks with the expected values of peak separation. The 1D slices of these spectra along the carbon dimension gave a clearer idea of these differences (Fig. 3c). As a quantitative estimation of the Q/D ratio, the NUS gave 1
1 mixture of isotopomers of alpha-ketoglutarate (αKG) (U-13C5-αKG and 1,2,3,4-13C4-αKG), an important intermediate in the TCA-cycle, was used. Each isotopomer should contribute to the final spectrum as a quartet and a doublet of C4, respectively, giving a total of 6 peaklets (Fig. 3a). The C4 doublet to quartet ratio (Q/D ratio) is an important metabolic parameter that has been conventionally obtained by 13C NMR isotopomer analysis.5 Therefore, we tried it using our 2D experiment with an order-of-magnitude-higher sensitivity and also compared it with a NUS approach that gives high resolution.10 The original HSQC could not resolve the individual peaklets, hampering any further analysis (Fig. 3b). The NUS approach, although it gave the expected 6 peaklets, exhibited negative peaks from phase distortion. In contrast, our new approach gave readily identifiable in-phase 2D peaks with the expected values of peak separation. The 1D slices of these spectra along the carbon dimension gave a clearer idea of these differences (Fig. 3c). As a quantitative estimation of the Q/D ratio, the NUS gave 1![[thin space (1/6-em)]](https://www.rsc.org/images/entities/char_2009.gif) :
:![[thin space (1/6-em)]](https://www.rsc.org/images/entities/char_2009.gif) 1.417, whereas our approach gave 1
1.417, whereas our approach gave 1![[thin space (1/6-em)]](https://www.rsc.org/images/entities/char_2009.gif) :
:![[thin space (1/6-em)]](https://www.rsc.org/images/entities/char_2009.gif) 1.045, much closer to the theoretical ratio of 1
1.045, much closer to the theoretical ratio of 1![[thin space (1/6-em)]](https://www.rsc.org/images/entities/char_2009.gif) :
:![[thin space (1/6-em)]](https://www.rsc.org/images/entities/char_2009.gif) 1 (Table S1†). Furthermore, the intensities of the individual Q peaklets in the NUS approach severely deviated from the uniformity with the ratio of 1.15
1 (Table S1†). Furthermore, the intensities of the individual Q peaklets in the NUS approach severely deviated from the uniformity with the ratio of 1.15![[thin space (1/6-em)]](https://www.rsc.org/images/entities/char_2009.gif) :
:![[thin space (1/6-em)]](https://www.rsc.org/images/entities/char_2009.gif) 1
1![[thin space (1/6-em)]](https://www.rsc.org/images/entities/char_2009.gif) :
:![[thin space (1/6-em)]](https://www.rsc.org/images/entities/char_2009.gif) 2.223
2.223![[thin space (1/6-em)]](https://www.rsc.org/images/entities/char_2009.gif) :
:![[thin space (1/6-em)]](https://www.rsc.org/images/entities/char_2009.gif) 1.379, whereas that of our approach were much more homogenous (1.023
1.379, whereas that of our approach were much more homogenous (1.023![[thin space (1/6-em)]](https://www.rsc.org/images/entities/char_2009.gif) :
:![[thin space (1/6-em)]](https://www.rsc.org/images/entities/char_2009.gif) 1
1![[thin space (1/6-em)]](https://www.rsc.org/images/entities/char_2009.gif) :
:![[thin space (1/6-em)]](https://www.rsc.org/images/entities/char_2009.gif) 0.887
0.887![[thin space (1/6-em)]](https://www.rsc.org/images/entities/char_2009.gif) :
:![[thin space (1/6-em)]](https://www.rsc.org/images/entities/char_2009.gif) 1.080). These results show that the distortion-free approach can yield much better quantitative estimation of isotopomer distribution. In addition, as the method provide well-resolved multiplets, it could be used during spiking procedures for easier metabolite identification with multiple reference peaklets.
1.080). These results show that the distortion-free approach can yield much better quantitative estimation of isotopomer distribution. In addition, as the method provide well-resolved multiplets, it could be used during spiking procedures for easier metabolite identification with multiple reference peaklets.
Estimation of TCA-cycle flux and effects of an old chemotherapeutic drug
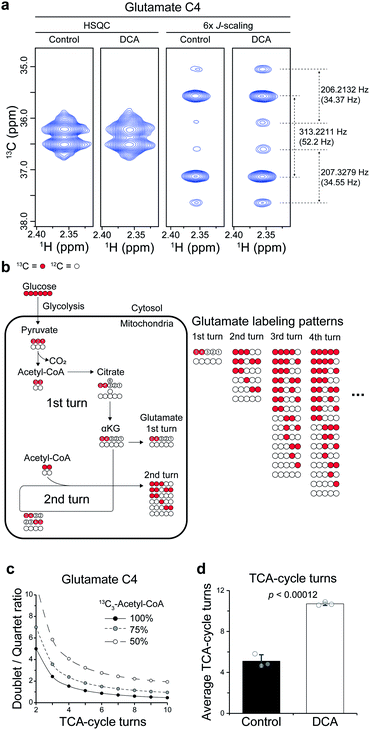
Then, we applied the approach to the mechanistic study of a drug. To that end, we treated dichloroacetate (DCA) to a leukemia cell line (L1210) and analyzed the cell extract directly without any cleanup steps. DCA is an investigational drug that has been under clinical trials in several cancers. It also has activities for seemingly unrelated diseases, such as pulmonary hypertension and amyotrophic lateral sclerosis.17 Its mechanism in cancer has been largely attributed to its inhibition of pyruvate dehydrogenase kinase (PDK), which effectively increases the flux of pyruvate into the mitochondrial TCA-cycle. However, its activities for other diverse conditions suggest that additional mechanisms may also exist.First, we investigated whether DCA actually enhances TCA-cycle flux, using the splitting patterns of glutamate C4 derived from U-13C6-glucose. The high sensitivity of our approach enabled us to obtain high-quality spectra from the complex cell extracts. The spectra exhibited a mixture of a strong doublet (from 13C-4,5; J = 52 Hz) and a quartet (from 13C-3,4,5; J = 52, 34 Hz) of glutamate generated from single and multiple turns of the TCA-cycle, respectively (Fig. 4a and b). With conventional HSQC, contrastingly, it was not possible to observe the splitting. There are calculable relationships among the doublet/quartet ratio of the C4, the TCA-cycle turns, and the 13C enrichment of acetyl-CoA that can provide quantitative estimation on average TCA-cycle turns (Fig. 4c). Based on the isotopologue abundance of acetyl-CoA (55.3% for control, 42.7% for DCA group (Fig. S4†)) and the above relationship, the effects of DCA on the average TCA-cycle turns could be obtained from the doublet/quartet ratio of the C4. This analysis showed that the TCA-cycle turns increased by approximately two-fold in leukemia cells treated with DCA (Fig. 4d). Therefore, our results support the conventional mechanism of DCA, that is, increase in TCA-cycle efficiency in more quantitative terms. Methodology-wise, an optimization for the shorter incubation time should help more accurate estimation of the TCA-cycle turns in the left region of the curves where D/Q ratio is the most sensitive to the TCA-cycle turns.
Identification of the new mechanism of DCA for serine biosynthesis
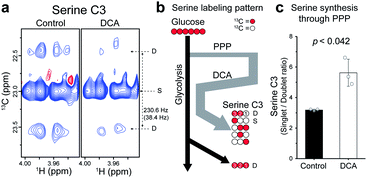
The increase in average TCA flux, though consistent with the conventional anticancer mechanism of DCA, may still not account for all of the broad-reaching pharmacological effects of DCA. Therefore, another action mechanism of DCA was investigated, by analyzing the splitting patterns of other metabolites. A surprising labeling pattern was observed for an amino acid serine with a mixture of strong singlet and weak doublet (J = 38.4 Hz) for its C3 carbon (Fig. 5a). The doublet can be easily explained by the conventional serine biosynthesis branching from glycolysis, as is clearly seen for the C3 of lactate, which is also synthesized through glycolysis (Fig. 5b and S5†). By contrast, the much stronger singlet on serine C3, absent in the lactate spectrum, suggests that a large portion of the neighboring 13C–C2 was replaced by unlabeled 12C-carbon. Based on known serine biosynthesis, the only plausible route for this carbon reshuffling is the pentose phosphate pathway (PPP) (Fig. S6†). The singlet-to-doublet ratio, therefore, should give the contribution of the PPP pathway relative to glycolysis in serine biosynthesis. The DCA treatment actually increased the singlet-to-doublet ratio by about ∼40% (Fig. 5c), indicating that DCA increases the relative contribution of PPP over glycolysis in serine synthesis. This may constitute a new action mechanism of DCA, as serine synthesis modulation recently has been linked to several diseases such as cancer, immune and neurological diseases, as noted above.18–20 Our results also show that cytosol, where PPP occurs, may be a new subcellular target compartment of DCA, distinct from the mitochondrial compartment for the conventional PDK inhibition mechanism. This new target site and mechanism may help to find new indications for DCA.Conclusions
In conclusion, we developed a high-sensitivity 2D NMR experiment that allows for quantitative analysis of multiplets for metabolic pathway analysis. Application of this to DCA not only confirmed its conventional mitochondrial TCA-enhancing mechanism but also suggested a new mechanism of higher PPP contribution to serine synthesis in cytosol. The new approach should also facilitate identification of new metabolic mechanisms of other drugs.Conflicts of interest
There are no conflicts to declare.Acknowledgements
The research was supported by the Basic Science Research Program (grant NRF-2018R1A3B1052328, to SP) funded by the Ministry of Science, Information and Communication Technology, Future Planning through the National Research Foundation of Korea and by the Korea Institute of Science & Technology—Research Program (2Z06220, to JWC), and Basic Science Research Program through the National Research Foundation of Korea funded by the Ministry of Education (NRF-2020R1A6A3A01099440, to YJA).References
- B. Faubert, A. Solmonson and R. J. DeBerardinis, Science, 2020, 368, 6487 CrossRef.
- C. Mazumdar, E. M. Driggers and L. A. Turka, Cell Metab., 2020, 31, 26–34 CrossRef CAS.
- S. Camandola and M. P. Mattson, EMBO J., 2017, 36, 1474–1492 CrossRef CAS.
- M. E. Pacold, K. R. Brimacombe, S. H. Chan, J. M. Rohde, C. A. Lewis, L. J. Y. M. Swier, R. Possemato, W. W. Chen, L. B. Sullivan, B. P. Fiske, S. Cho, E. Freinkman, K. Birsoy, M. Abu-Remaileh, Y. D. Shaul, C. M. Liu, M. Zhou, M. J. Koh, H. Chung, S. M. Davidson, A. Luengo, A. Q. Wang, X. Xu, A. Yasgar, L. Liu, G. Rai, K. D. Westover, M. G. Vander Heiden, M. Shen, N. S. Gray, M. B. Boxer and D. M. Sabatini, Nat. Chem. Biol., 2016, 12, 452–458 CrossRef CAS.
- K. D. Courtney, D. Bezwada, T. Mashimo, K. Pichumani, V. Vemireddy, A. M. Funk, J. Wimberly, S. S. McNeil, P. Kapur, Y. Lotan, V. Margulis, J. A. Cadeddu, I. Pedrosa, R. J. DeBerardinis, C. R. Malloy, R. M. Bachoo and E. A. Maher, Cell Metab., 2018, 28, 793–800 e2 CrossRef CAS.
- E. Subramani, M. Radoul, C. Najac, G. Batsios, A. R. Molloy, D. Hong, A. M. Gillespie, R. D. Santos, P. Viswanath, J. F. Costello, R. O. Pieper and S. M. Ronen, Cancer Res., 2020, 80, 5098–5108 CrossRef CAS.
- Y. Rao, S. Gammon, N. M. Zacharias, T. Liu, T. Salzillo, Y. Xi, J. Wang, P. Bhattacharya and D. Piwnica-Worms, Proc. Natl. Acad. Sci. U. S. A., 2020, 117, 22378–22389 CrossRef CAS.
- T. Mashimo, K. Pichumani, V. Vemireddy, K. J. Hatanpaa, D. K. Singh, S. Sirasanagandla, S. Nannepaga, S. G. Piccirillo, Z. Kovacs, C. Foong, Z. Huang, S. Barnett, B. E. Mickey, R. J. DeBerardinis, B. P. Tu, E. A. Maher and R. M. Bachoo, Cell, 2014, 159, 1603–1614 CrossRef CAS.
- E. A. Maher, I. Marin-Valencia, R. M. Bachoo, T. Mashimo, J. Raisanen, K. J. Hatanpaa, A. Jindal, F. M. Jeffrey, C. H. Choi, C. Madden, D. Mathews, J. M. Pascual, B. E. Mickey, C. R. Malloy and R. J. DeBerardinis, NMR Biomed., 2012, 25, 1234–1244 CrossRef CAS.
- S. Lee, H. Wen, Y. J. An, J. W. Cha, Y. J. Ko, S. G. Hyberts and S. Park, Anal. Chem., 2017, 89, 1078–1085 CrossRef CAS.
- T. V. Schlippenbach, P. J. Oefner and W. Gronwald, Sci. Rep., 2018, 8, 4249 CrossRef.
- U. Singh, S. Bhattacharya and B. Baishya, J. Magn. Reson., 2020, 311, 106684 CrossRef CAS.
- M. Schenone, V. Dancik, B. K. Wagner and P. A. Clemons, Nat. Chem. Biol., 2013, 9, 232–240 CrossRef CAS.
- X. Liu, R. R. Chhipa, I. Nakano and B. Dasgupta, Mol. Cancer Ther., 2014, 13, 596–605 CrossRef CAS.
- Y. Zheng and Y. Jiang, Mol. Cell. Pharmacol., 2015, 7, 15–20 Search PubMed.
- W. Willker, U. Flogel and D. Leibfritz, J. Magn. Reson., 1997, 125, 216–219 CrossRef CAS.
- M. O. James, S. C. Jahn, G. Zhong, M. G. Smeltz, Z. Hu and P. W. Stacpoole, Pharmacol. Ther., 2017, 170, 166–180 CrossRef CAS.
- A. C. Newman and O. D. K. Maddocks, Trends Cell Biol., 2017, 27, 645–657 CrossRef CAS.
- E. H. Ma, G. Bantug, T. Griss, S. Condotta, R. M. Johnson, B. Samborska, N. Mainolfi, V. Suri, H. Guak and M. L. Balmer, Cell Metab., 2017, 25, 345–357 CrossRef CAS.
- J. S. Metcalf, R. A. Dunlop, J. T. Powell, S. A. Banack and P. A. Cox, Neurotoxic. Res., 2018, 33, 213–221 CrossRef CAS.
Footnotes |
| † Electronic supplementary information (ESI) available. See DOI: 10.1039/d0sc06480g |
| ‡ These authors contributed equally to this work (J.W.C., and X.J.). |
| This journal is © The Royal Society of Chemistry 2021 |

