 Open Access Article
Creative Commons Attribution 3.0 Unported Licence
Ground- and excited-state dynamic control of an anion receptor by hydrostatic pressure†
Tomokazu
Kinoshita
a,
Yohei
Haketa
b,
Hiromitsu
Maeda
 *b and
Gaku
Fukuhara
 *ac
*ac
aDepartment of Chemistry, Tokyo Institute of Technology, 2-12-1 Ookayama, Meguro-ku, Tokyo 152-8551, Japan. E-mail: gaku@chem.titech.ac.jp
bDepartment of Applied Chemistry, College of Life Sciences, Ritsumeikan University, Kusatsu 525-8577, Japan. E-mail: maedahir@ph.ritsumei.ac.jp
cJST, PRESTO, 4-1-8 Honcho, Kawaguchi, Saitama 332-0012, Japan
First published on 15th April 2021
Abstract
Stimulus-responsive supramolecular architectures have become an attractive alternative to conventional ones for many applications in sensing, drug-delivery and switchable memory systems. Herein, we used an anion receptor (H: host) as a hydrostatic-pressure-manipulatable fluorescence foldamer and halide anions as chiral (binaphthylammonium) and achiral (tetrabutylammonium) ion pairs (SS or RR·X and TBA·X; X = Cl, Br), and then investigated their (chir)optical properties and molecular recognition behavior under hydrostatic pressures. The conformational changes and optical properties of H in various organic solvents were revealed by UV/vis absorption and fluorescence spectra and fluorescence lifetimes upon hydrostatic pressurization. The anion-recognition abilities of H upon interactions with SS or RR·X and TBA·X at different pressure ranges were determined by hydrostatic-pressure spectroscopy to quantitatively afford the binding constant (Kanion) and apparent reaction volume changes  . The results obtained indicate that hydrostatic pressure as well as solvation plays significant roles in the dynamic control of the present supramolecular system in the ground and excited states. This work will provide a new guideline for further developing hydrostatic-pressure-responsive foldamers and supramolecular materials.
Introduction
A large number of chemosensors, pre-organized hosts and supramolecular assemblies/polymers have been exploited in a rather long history since the great discovery of crown ethers in 1967.1–3 Today, sophisticated supramolecular materials triggered by a wide variety of external stimuli, e.g., temperature, solvent, pH or electronic excitation, have been developed to achieve “molecular machines” that can alter the molecular-level structure/function/properties.4–6 Even apart from such artificial molecular machines, the creation of stimulus-responsive supramolecular architectures is a recent great trend for some applications in chemical and apoptosis sensing,7–12 drug-delivery13–15 and switchable memory systems.16–19Hydrostatic pressure, one of the mechanical stimuli, has attracted attention for a long time since the early 1960s,20–27 since hydrostatic pressurization of object solutions can control not only ground-state thermodynamic equilibria in molecular recognition28–35 and biomolecular events36–38 but also excited-state kinetic rates in photophysics and photochemical reactions.39–42 Despite being quite an old topic, this area has come into the limelight again from the viewpoints of mechanochromic chemistry43–49 and mechanobiology37,50–52 as relatively new scientific fields, and thus presents a major challenge in current chemistry. Indeed, we have recently revealed that optical properties, molecular and biomolecular recognition behavior and photo-physical/chemical processes in solutions of various molecular, supramolecular, macromolecular and biomacromolecular systems are precisely regulated by hydrostatic pressure.53–63 Hence, these trends prompted us to newly investigate an applicable supramolecular recognition system under hydrostatic pressures.
To this end, we focus on foldamers as artificial receptors or chemosensors which are a type of synthetic oligomers that show dynamic folded and unfolded states in solutions.64 Foldamers consist of rather flexible strands and form well-organized supramolecular structures with neutral and/or anionic guest molecules, and thus may be considered as an induced-fit type receptor.65–67 In fact, Moore and Drickamer et al. demonstrated that binding constants (K) of the piperazine or terpene guest upon interactions with oligo (m-phenylene ethynylene) foldamers in polymer matrixes decreased with increasing pressure of up to 65![[thin space (1/6-em)]](https://www.rsc.org/images/entities/char_2009.gif) 000 MPa, i.e., positive reaction volumes (ΔV° > 0), revealed by the diamond anvil cell technique.68 Nevertheless, solution-state molecular recognition behavior of foldamers under hydrostatic pressures has not been examined in any detail, and hence, is still a challenge for the further evolution of supramolecular chemistry.
000 MPa, i.e., positive reaction volumes (ΔV° > 0), revealed by the diamond anvil cell technique.68 Nevertheless, solution-state molecular recognition behavior of foldamers under hydrostatic pressures has not been examined in any detail, and hence, is still a challenge for the further evolution of supramolecular chemistry.
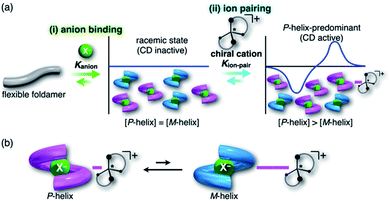
For foldamers (receptors) that show helical structures upon binding anions as a guest species,67 chirality of the helical anion complexes can be predominantly regulated by proximally locating the chiral countercation (Fig. 1a). The chirality regulation can be achieved by two crucial processes: (i) anion binding of the receptor and (ii) ion pairing with the chiral countercation. In the anion-binding step (i), anion complexes exist as equimolar amounts of M- and P-helices, resulting in the achiral racemic state without circular dichroism (CD) signs. In the ion-pairing step (ii), either of the helicities is predominantly formed upon ion-pair formation with the chiral countercation, inducing the asymmetric state with enhanced CD signs. The diastereoselective formation of helical structures is achieved by the equilibrium between ion pairs with M- and P-helical structures that show different stabilities (Fig. 1b). Such a multi-step chirality induction system can be easily regulated because the chirality induction of the foldamer is a result of the ion pair formation, which is sensitive to the solvation conditions. Therefore, the helical structures are tunable by external pressure, which influences solvation conditions.
In the present study, to thus apply the hydrostatic pressure-control concept to chemical sensing of foldamers in solutions, we chose a combination of an anion receptor (H: host) as a fluorescence foldamer and chiral ion pairs (SS or RR·X) as guests, as shown in Fig. 2a and b, and investigated their (chir)optical properties and molecular recognition behavior upon hydrostatic pressurization. This host–guest combination seems to be rather reasonable for achieving the present purpose, since we have clearly revealed the molecular recognitions at an atmospheric condition (0.1 MPa) (Fig. 2c).69,70 Also, among many outstanding anion receptors reported so far,71–75 both of them used here were spectroscopically powerful due to their colorimetric, fluorometric and optical properties. Herein, we wish to report an unprecedented dynamic supramolecular control of H in both ground and excited states, induced by hydrostatic pressure. The results obtained here and the concepts and methodology proposed in this paper provide deeper insights for constructing further smart and dynamic supramolecular architectures.
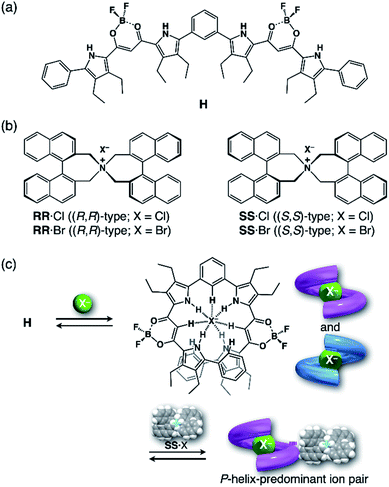 | ||
| Fig. 2 (a) Fluorescence anion receptor (H: host), (b) chiral ion pairs (SS or RR·X; X = Cl, Br) and (c) their supramolecular complexation mode. | ||
Results and discussion
Dynamic behavior of the fluorescence anion receptor (H) upon hydrostatic pressurization
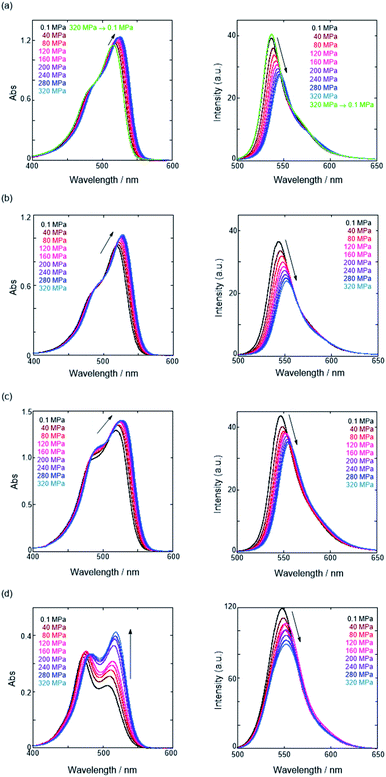
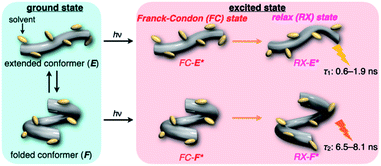
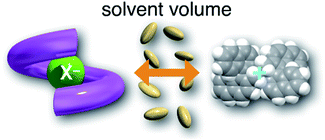
First, we investigated UV/vis absorption and fluorescence spectral changes of the anion receptor (H) in various organic solvents under hydrostatic pressures (for the detailed hydrostatic-pressure apparatus, see Fig. S1 in the ESI†). To clearly discuss microenvironmental polarity changes around H under hydrostatic pressures, in this paper, we used the ET parameter76 based on the pressure effects of solvatochromic Reichardt's dye.58 Solutions of H were prepared by dissolving in toluene, chloroform, dichloromethane and acetonitrile (ET: 33.9–45.6 kcal mol−1), and then subjected to hydrostatic-pressurized UV/vis absorption (Fig. 3, left panels), fluorescence (Fig. 3, right panels) and excitation spectroscopies (Fig. S2 in the ESI†). Each solution was adjusted to an appropriate concentration of <50 μM for avoiding high-pressure crystallization.The spectra at 0.1 MPa (green line) depressurized from 320 MPa are almost superimposable with the original spectra (black line), indicating a reversible process upon pressurization. All the UV/vis absorption spectra (Fig. 3, left) exhibited gradual bathochromic shifts and hyperchromic effects with increasing pressure, of which the former were plotted against pressure to quantitatively afford a spectral shift per unit pressure for the 0–0 absorption band (αA) listed in Table 1; see Fig. S3 in the ESI† for the plots. As the former reason, it is well-known that solvent density changes upon hydrostatic pressurization perturbate orbitals in π systems to cause pressure-induced red shifts.20,21 The latter are simply due to the increase in the effective concentration upon pressurization.21 Since the hydrostatic pressure effect on the red shift is generally observed as ca. 1 cm−1 MPa−1 in using common organic dyes,54–63 the αA values obtained in toluene, chloroform and dichloromethane are reasonably pronounced as the general hydrostatic-pressure-induced spectral change, which means that a particular conformational change in the foldamer skeleton does not occur upon pressurization. Very interestingly, only in acetonitrile, the 0–0 absorption band is quite suppressed under low pressures, compared to the 0–1 band. According to the previous mechanistic studies,69,70 the reversal phenomenon of such bands was attributable to the formation of the folded conformer (see Fig. 2c). Indeed, the spectra in acetonitrile at the low pressures are very similar to those observed upon anion recognition in which multiple hydrogen bonds form at the recognition sites (see Fig. 6a). Certainly, at 0.1 MPa, the 0–0 band at 507 nm in acetonitrile seems to be rather hypsochromically shifted compared to that at 516 nm in toluene, 519 nm in chloroform or 519 nm in dichloromethane, which also reinforces the formation of a folded, or conjugation-shortened, conformer. The relatively higher polarity solvent, i.e., acetonitrile (ET 45.6 kcal mol−1), is considered to facilitate an intrachain assembly due to the solvophobic effect.77 Hence, the H foldamer adopts the extended (E) and folded (F) conformers in the ground state, as shown in Fig. 4 (left side). Most importantly, the relative abundance of the F conformer gradually shifted to the E-rich state upon the stepwise pressurization on the basis of the 0–0/0–1 band's ratio changes as can be seen in Fig. 3d. This is consistent with the fact that larger αA values mean more remarkable conjugation perturbations in π systems by hydrostatic pressure. The pressure-dependent dynamic conformational change is highly likely that solvated molecules around the wide-surface E are released easier than the crowded F;  . It is therefore noted that the conformations in the flexible foldamer H can dynamically be controlled simply by changing hydrostatic pressure.
| Solvent | E T /kcal mol−1 | α A /cm−1 MPa−1 | α F /cm−1 MPa−1 | Δαd/cm−1 MPa−1 |
|---|---|---|---|---|
| a Empirical polarity parameter, determined using Reichardt's dye; see ref. 76. b Slope of the 0–0 absorption band. c Slope of the 0–0 fluorescence band. d Differential slope is αF − αA. e Until 160 MPa. | ||||
| Toluene | 33.9 | −1.05 | −1.01 | 0.04 |
| Chloroform | 39.1 | −0.97 | −0.85 | 0.12 |
| Dichloromethane | 40.7 | −0.96 | −0.91 | 0.05 |
| Acetonitrile | 45.6 | −1.34 | −0.91e | 0.43 |
On the other hand, all the fluorescence spectra showed gradual bathochromic shifts and quenching in intensity upon the gradual pressurization. The pressurized excitation spectra in Fig. S2† nearly overlapped with the corresponding UV/vis absorption spectrum, indicating the nonexistence of specific fluorescent species. The pressure-induced red shifts in the excited state (αF) were also calculated by plotting wavenumber changes against pressure (Fig. S4 in the ESI†) as is the case with the UV/vis absorption data (see Table 1). The degree of αF (−0.85 to −1.01 cm−1 MPa−1) is also the same as the data obtained for common fluorescence dyes,54,57,59 but the quenching behavior is somewhat puzzling. In general, fluorescence intensities of solutions of emissive dyes upon hydrostatic pressurization follow the Förster–Hoffmann equation [log(IF) = A![[thin space (1/6-em)]](https://www.rsc.org/images/entities/char_2009.gif) log(η) + B],27 where fluorescence intensity (IF) increases with pressure-induced viscosity (η) increasing due to the suppression of collisional deactivation by solvent, and thus increase. Nevertheless, the results that the fluorescence quenches were observed in all solvents against the Förster–Hoffmann's behavior can reasonably be accounted as follows. Upon electronic excitation under high pressures, the Franck–Condon state (relatively planar) generated from the ground state (Fig. 4, center) may relax to a twisted state (Fig. 4, right side). Consequently, solvent reorientation through this planar-to-twisted relaxation process may cause particular quenches by overcoming the pressure-gained viscosity benefits.
log(η) + B],27 where fluorescence intensity (IF) increases with pressure-induced viscosity (η) increasing due to the suppression of collisional deactivation by solvent, and thus increase. Nevertheless, the results that the fluorescence quenches were observed in all solvents against the Förster–Hoffmann's behavior can reasonably be accounted as follows. Upon electronic excitation under high pressures, the Franck–Condon state (relatively planar) generated from the ground state (Fig. 4, center) may relax to a twisted state (Fig. 4, right side). Consequently, solvent reorientation through this planar-to-twisted relaxation process may cause particular quenches by overcoming the pressure-gained viscosity benefits.
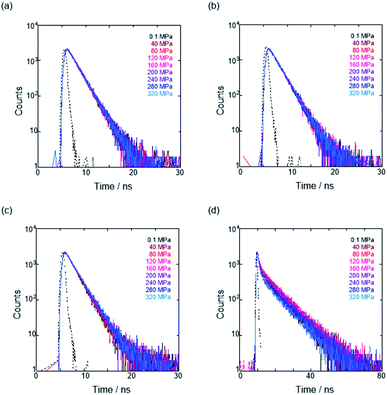
To further elucidate the origin of fluorescence excited species and the above-mentioned scenario in the excited state, fluorescence lifetimes were measured by the hydrostatic-pressure time-correlated single photon counting method (see Fig. S1 in the ESI† for the set-up). As shown in Fig. 5, the fluorescence decay profiles measured at 550 nm in toluene, chloroform and dichloromethane under high pressures showed appreciable single exponential fitting to give single excited species, indicating that the excited E conformer (E*) emits to decay with the lifetime of 1.7–1.9 ns (Table 2; see Table S1 in the ESI† for the data of all lifetimes). Intriguingly, the profiles observed at 546 nm in acetonitrile under high pressures were obviously of multiple components and reasonably fitted to a sum of two exponential functions to afford the lifetimes of 0.6–0.7 ns and 6.5–8.1 ns (Tables 2 and S1†). The lifetime results are consistent with the fact that the dynamic conformational equilibria, determined by the hydrostatic-pressure steady-state UV/vis absorption and fluorescence spectroscopies, exist. Eventually, the shorter-lived species (τ1) is attributable to E* and the longer-lived one (τ2) to F* by assuming  even in the excited states, since the relative abundance of τ1 (τ2) gradually increases (decreases) with increasing pressure. It can be, therefore, emphasized that the fluorescence foldamer's conformational and optical properties are dynamically manipulatable in both ground and excited states by external stimuli such as solvent and particularly hydrostatic pressure.
| Solvent | λ em /nm | P/MPa | τ 1 | A 1 | τ 2 | A 2 | χ 2 |
|---|---|---|---|---|---|---|---|
| a Fluorescence lifetime (τi) and relative abundance (Ai) of each component, determined by the hydrostatic-pressure single photon counting method in nondegassed solution at room temperature; λex 405 nm. b Monitoring wavelength. | |||||||
| Toluene | 550 | 0.1 | 1.8 | 1.00 | 1.2 | ||
| 160 | 1.9 | 1.00 | 1.0 | ||||
| 320 | 1.9 | 1.00 | 1.1 | ||||
| Chloroform | 550 | 0.1 | 1.9 | 1.00 | 1.1 | ||
| 160 | 1.8 | 1.00 | 1.3 | ||||
| 320 | 1.9 | 1.00 | 1.3 | ||||
| Dichloromethane | 550 | 0.1 | 1.7 | 1.00 | 1.3 | ||
| 160 | 1.8 | 1.00 | 1.0 | ||||
| 320 | 1.9 | 1.00 | 1.0 | ||||
| Acetonitrile | 546 | 0.1 | 0.7 | 0.27 | 6.5 | 0.73 | 1.2 |
| 160 | 0.6 | 0.22 | 7.7 | 0.78 | 1.1 | ||
| 320 | 0.7 | 0.38 | 7.6 | 0.62 | 1.2 | ||
Hydrostatic-pressure effects on anion recognition of the anion receptor (H) upon interactions with guests
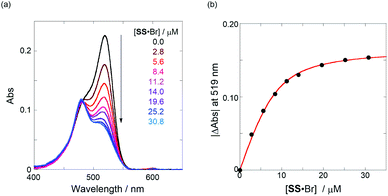
Next, we investigated the anion-recognition behavior of H in solutions upon hydrostatic pressurization by using Cl and Br anions with chiral binaphthylammonium (SS or RR; see Fig. 2b) or the tetrabutylammonium (TBA) cation as chiral or the achiral ion pair; chloroform as a good solvent was employed in this section, which can dissolve both host–guest combination well even under high pressures.The binding constant (Kanion) of the anions with H, defined in Fig. 1a, was determined at room temperature at different pressures by UV/vis absorption spectral titration. As can be seen in Fig. 6a, gradual addition of SS·Br (0–30.8 μM) to a chloroform solution of H (8.0 μM) led to a steady decrease of the 0–0 band maxima accompanied by the isosbestic point at 481 nm. Nonlinear least-squares fit of the UV/vis absorption spectral changes at 519 nm (Fig. 6b), assuming the 1![[thin space (1/6-em)]](https://www.rsc.org/images/entities/char_2009.gif) :
:![[thin space (1/6-em)]](https://www.rsc.org/images/entities/char_2009.gif) 1 stoichiometry (see the complex structure in Fig. 2c), afforded the Kanion value of 519
1 stoichiometry (see the complex structure in Fig. 2c), afforded the Kanion value of 519![[thin space (1/6-em)]](https://www.rsc.org/images/entities/char_2009.gif) 000 M−1 at 40 MPa for SS·Br. All the titration and fitting data are shown in Fig. S9–S24.† The apparent reaction volume changes
000 M−1 at 40 MPa for SS·Br. All the titration and fitting data are shown in Fig. S9–S24.† The apparent reaction volume changes  of the present host–guest complexation were assessed according to eqn (1).
 | (1) |
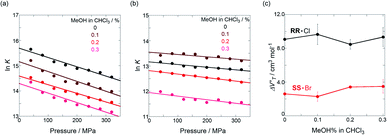
Thus, the natural logarithm of the Kanion values obtained at different pressures was plotted as a function of pressure to give good straight lines (Fig. 7 and Table 3; see Tables S2 and S3 in the ESI† for the data of all binding constants), indicating that the 1![[thin space (1/6-em)]](https://www.rsc.org/images/entities/char_2009.gif) :
:![[thin space (1/6-em)]](https://www.rsc.org/images/entities/char_2009.gif) 1 supramolecular complexation mode does not change in the pressure ranges employed (∼320 MPa). The
1 supramolecular complexation mode does not change in the pressure ranges employed (∼320 MPa). The  for the foldamer-anion complexation can be written as eqn (2):
 | (2) |
 | (3) |
 should be zero. This means that the total volume changes based on solvation
  play critical roles in the evaluation of
  in the present hydrostatic-pressurized supramolecular system.
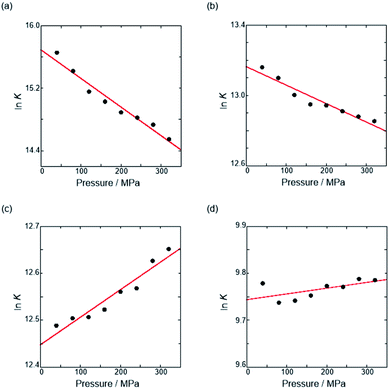 | ||
| Fig. 7 Pressure dependence of the binding constant (Kanion) in anion recognition of H with (a) RR·Cl, (b) SS·Br, (c) TBA·Cl and (d) TBA·Br in chloroform at room temperature. | ||
![[thin space (1/6-em)]](https://www.rsc.org/images/entities/char_2009.gif) :
:![[thin space (1/6-em)]](https://www.rsc.org/images/entities/char_2009.gif) 1 binding constant (Kanion) and apparent reaction volume changes
1 binding constant (Kanion) and apparent reaction volume changes  for the anion receptor (H) with some anions in CHCl3 under hydrostatic pressuresa
| Guest | P/MPa | K anion/M−1 | /cm3 mol−1 |
|---|---|---|---|
| a Measured at 298 K. | |||
| RR·Cl | 40 | (6.28 ± 4.17) × 106 | +9.1 ± 0.8 |
| 160 | (3.36 ± 1.80) × 106 | ||
| 320 | (2.08 ± 0.91) × 106 | ||
| SS·Br | 40 | (5.19 ± 0.56) × 105 | +2.6 ± 0.3 |
| 160 | (4.20 ± 0.70) × 105 | ||
| 320 | (3.82 ± 0.67) × 105 | ||
| TBA·Cl | 40 | (2.65 ± 0.28) × 105 | −1.5 ± 0.2 |
| 160 | (2.74 ± 0.29) × 105 | ||
| 320 | (3.12 ± 0.39) × 105 | ||
| TBA·Br | 40 | (1.77 ± 0.14) × 104 | −0.3 ± 0.2 |
| 160 | (1.72 ± 0.18) × 104 | ||
| 320 | (1.78 ± 0.23) × 104 | ||
The order of  for the binaphthylammonium salt was Cl− > Br− in positive. Inherently, these values originate from solvated structures that adopt solvent-dependent ion-pairing modes revealed by means of several spectroscopic analyses (Fig. 8).70 As noted below, a volumetric-expanded solvation of the solvent-shared ion pair's conformer in the
  term turned out to be the main factor controlling
  , rather than solvation of free guest ion pairs (
 ; see the effect on TBA). Certainly, the
  values for the TBA salts were quite small with the sign inversion in negative. This can reasonably be accounted for in terms of the fact that an applicable volumetric solvation of both the ion-pair complexes may be more difficult than that of free guests due to the smaller van der Waals volume and/or dipole moments of TBA compared to the binaphthylammonium cation.
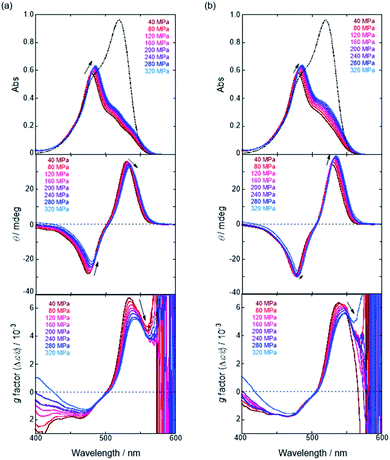
We have already demonstrated that the chiroptical properties of the optically active ion-pair complexes can be traced by means of CD spectroscopy.70 Hence, to more clearly elucidate the specific solvation effects on  under high pressures, hydrostatic-pressure CD spectroscopy (see Fig. S1d†) is a rather powerful tool for the use of the unique chiral cation. The examined concentration conditions of host–guest combinations were determined from Kanion at each pressure (Tables 3 and S3†); [H] = 34 μM, [SS·Cl] = 120 μM, [SS·Br] = 130 μM, and the guest occupancy in H was set as >99.9% under pressure conditions performed. As shown in Fig. 9, importantly, anisotropy factor (g = Δε/ε) maxima, particularly at the positive band, gradually decreased with pressurization-characteristic bathochromic shifts upon gradual pressurization despite the constant abundance (>99.9%) of each chiral complex. These results strongly indicate that the pressure-induced equilibrium in the complex conformers shifts to a chirally weakened complex as a weakly associated ion pair (Fig. 10). As seen in Fig. S25 in the ESI,† on using Cl−, a larger decrease of g values at the positive maxima (slope of −7.66 × 10⁻⁶ MPa−1) was observed compared to the use of Br− (slope of −4.77 × 10⁻⁶ MPa−1), facilitating further formation of the weakly associated ion pair upon pressurization probably due to the stronger interaction of Cl− with H. The pressure-induced formation of this volumetric-expanded conformer again reinforces the origin of the considerable differences in
  .
.
 | ||
| Fig. 10 Schematic illustration of the interconversion between tightly and weakly associated ion pairs. | ||
To finally examine pressure effects on the solvated complexes, we mixed small amounts of methanol as a solvated solvent with chloroform solutions, and then subjected to the same hydrostatic-pressure titration experiments (Fig. S13–S24†) to afford a series of Kanion and  values (Fig. 11 and Table 4). Unexpectedly, both
  values for Cl− and Br− are constant, irrespective of the methanol content of ∼0.3%, while Kanion decreased with increasing methanol concentration. This unprecedented
  behavior is highly likely to be mutual specific solvation of methanol to the complex
  and free guest
  .
.
 in CHCl3 containing MeOH (0–0.3%)a
| Guest | MeOH/% | /cm3 mol−1 |
|---|---|---|
| a Measured at 298 K; [H] = 6.0–9.4 μM. | ||
| RR·Cl | 0 | +9.1 ± 0.8 |
| 0.1 | +9.7 ± 1.2 | |
| 0.2 | +8.5 ± 0.6 | |
| 0.3 | +9.3 ± 1.1 | |
| SS·Br | 0 | +2.6 ± 0.3 |
| 0.1 | +2.3 ± 0.6 | |
| 0.2 | +3.4 ± 0.1 | |
| 0.3 | +3.5 ± 0.8 | |
Conclusions
We have demonstrated the ground- and excited-state dynamic control of the anion receptor H induced by hydrostatic pressure. The extended (E) and folded (F) conformers of H are mutually regulatable in response to solvation as well as hydrostatic pressure. Intriguingly, the optical properties based on these two conformers were very different from each other, thus leading to the creation of a hydrostatic-pressure-responsive optical molecular spring. The solvations of the supramolecular complexes play pivotal roles in the anion recognition behavior of H with achiral and chiral ion pairs, quantitatively revealed by the apparent reaction volume changes . Eventually, it is noteworthy that the strategy proposed herein, i.e., the hydrostatic-pressure control, may be extended to other foldamer and guest combinations that are difficult to sense each other or to non-lock-and-key systems.
Author contributions
G. F. initiated the project. G. F. and H. M. designed the experiments. T. K. carried out spectroscopic experiments, analyzed the data, and prepared the manuscript. Y. H. prepared the materials. All authors revised the manuscript.Conflicts of interest
There are no conflicts to declare.Acknowledgements
This work was supported by Grant-in-Aid for Scientific Research (B) (No. 19H02746 to G. F. and No. JP18H01968 to H. M.), Scientific Research (C) (No. JP19K05444 to Y. H.), and Transformative Research Areas (A) “Condensed Conjugation” (No. JP20H05863 to H. M.) from the Japan Society for the Promotion of Science (JSPS) and Japan Science and Technology Agency (JST), PRESTO (No. JPMJPR17PA) to G. F. The authors thank Dr Kazuki Urakawa, Ritsumeikan University, for the preparation of chiral ion pairs.References
- J.-M. Lehn, Angew. Chem., Int. Ed. Engl., 1988, 27, 89–112 CrossRef.
- D. J. Cram, Angew. Chem., Int. Ed. Engl., 1988, 27, 1009–1020 CrossRef.
- C. J. Pedersen, Angew. Chem., Int. Ed. Engl., 1988, 27, 1021–1027 CrossRef.
- B. L. Feringa, Angew. Chem., Int. Ed., 2017, 56, 11060–11078 CrossRef CAS PubMed.
- J.-P. Sauvage, Angew. Chem., Int. Ed., 2017, 56, 11080–11093 CrossRef CAS PubMed.
- J. F. Stoddart, Angew. Chem., Int. Ed., 2017, 56, 11094–11125 CrossRef CAS PubMed.
- S. Shinkai, M. Ikeda, A. Sugasaki and M. Takeuchi, Acc. Chem. Res., 2001, 34, 494–503 CrossRef CAS PubMed.
- L. You, D. Zha and E. V. Anslyn, Chem. Rev., 2015, 115, 7840–7892 CrossRef CAS PubMed.
- K. Singh, A. M. Rotaru and A. A. Beharry, ACS Chem. Biol., 2018, 13, 1785–1798 CrossRef CAS PubMed.
- V. Schroeder, S. Savagatrup, M. He, S. Lin and T. M. Swager, Chem. Rev., 2019, 119, 599–663 CrossRef CAS PubMed.
- G. Fukuhara, J. Inclusion Phenom. Macrocyclic Chem., 2019, 93, 127–143 CrossRef CAS.
- G. Fukuhara, J. Photochem. Photobiol., C, 2020, 42, 100340 CrossRef CAS.
- A. Kakkar, G. Traverso, O. C. Farokhzad, R. Weissleder and R. Langer, Nat. Rev. Chem., 2017, 1, 0063 CrossRef CAS PubMed.
- S. Kwon, H. Ko, D. G. You, K. Kataoka and J. H. Park, Acc. Chem. Res., 2019, 52, 1771–1782 CrossRef CAS PubMed.
- K. Park, J. Controlled Release, 2019, 300, 197–199 CrossRef CAS PubMed.
- J. Yoon and A. P. de Silva, Angew. Chem., Int. Ed., 2015, 54, 9754–9756 CrossRef CAS PubMed.
- E. Yashima, N. Ousaka, D. Taura, K. Shimomura, T. Ikai and K. Maeda, Chem. Rev., 2016, 116, 13752–13990 CrossRef CAS PubMed.
- J. S. Kahn, Y. Hu and I. Willner, Acc. Chem. Res., 2017, 50, 680–690 CrossRef CAS PubMed.
- C. Löwenberg, M. Balk, C. Wischke, M. Behl and A. Lendlein, Acc. Chem. Res., 2017, 50, 723–732 CrossRef PubMed.
- F. A. Bovey and S. S. Yanari, Nature, 1960, 186, 1042–1044 CrossRef CAS.
- W. W. Robertson, J. Chem. Phys., 1960, 33, 362–365 CrossRef CAS.
- P. C. Johnson and H. W. Offen, J. Chem. Phys., 1972, 56, 1638–1642 CrossRef CAS.
- A. M. Rollinson and H. G. Drickamer, J. Chem. Phys., 1980, 73, 5981–5996 CrossRef CAS.
- K. Hara, T. Arase and J. Osugi, J. Am. Chem. Soc., 1984, 106, 1968–1972 CrossRef CAS.
- W. Rettig, E. Gilabert and C. Rullière, Chem. Phys. Lett., 1994, 229, 127–133 CrossRef CAS.
- D. Hablot, R. Ziessel, M. A. H. Alamiry, E. Bahraidah and A. Harriman, Chem. Sci., 2013, 4, 444–453 RSC.
- T. Suhina, B. Weber, C. E. Carpentier, K. Lorincʐ, P. Schall, D. Bonn and A. M. Brouwer, Angew. Chem., Int. Ed., 2015, 54, 3688–3691 CrossRef CAS PubMed.
- G. Weber, F. Tanaka, B. Y. Okamoto and H. G. Drickamer, Proc. Natl. Acad. Sci. U. S. A., 1974, 71, 1264–1266 CrossRef CAS PubMed.
- P. M. Torgerson, H. G. Drickamer and G. Weber, Biochem, 1979, 18, 3079–3083 CrossRef CAS PubMed.
- R. K. Williams, J. Phys. Chem., 1981, 85, 1795–1799 CrossRef CAS.
- T. M. Letcher, J. D. Mercer-Chalmers and R. L. Kay, Pure Appl. Chem., 1994, 66, 419–427 CAS.
- N. S. Isaacs, P. J. Nichols, C. L. Raston, C. A. Sandova and D. J. Young, Chem. Commun., 1997, 1839–1840 RSC.
- A. Abou-Hamdan, P. Bugnon, C. Saudan, P. G. Lye and A. E. Merbach, J. Am. Chem. Soc., 2000, 122, 592–602 CrossRef CAS.
- K. Ariga, Y. Terasaka, D. Sakai, H. Tsuji and J. Kikuchi, J. Am. Chem. Soc., 2000, 122, 7835–7836 CrossRef CAS.
- R. Ruloff, U. P. Seelbach, A. E. Merbach and F.-G. Klärner, J. Phys. Org. Chem., 2002, 15, 189–196 CrossRef CAS.
- A. Krzyżaniak, J. Barciszewski, J. P. Fürste, R. Bald, V. A. Erdmann, P. Salański and J. Jurczak, Int. J. Biol. Macromol., 1994, 16, 159–162 CrossRef.
- F. Meersman, C. M. Dobson and K. Heremans, Chem. Soc. Rev., 2006, 35, 908–917 RSC.
- S. Takahashi and N. Sugimoto, Angew. Chem., Int. Ed., 2013, 52, 13774–13778 CrossRef CAS PubMed.
- T. Asano, H. Furuta and H. Sumi, J. Am. Chem. Soc., 1994, 116, 5545–5550 CrossRef CAS.
- Y. Inoue, E. Matsushima and T. Wada, J. Am. Chem. Soc., 1998, 120, 10687–10696 CrossRef CAS.
- C. Yang, T. Mori, Y. Origane, Y. H. Ko, N. Selvapalam, K. Kim and Y. Inoue, J. Am. Chem. Soc., 2008, 130, 8574–8575 CrossRef CAS PubMed.
- M. Gao, W. Zhang and L. Zhang, Nano Lett., 2018, 18, 4424–4430 CrossRef CAS PubMed.
- Y. Sagara and T. Kato, Nat. Chem., 2009, 1, 605–610 CrossRef CAS PubMed.
- A. Pucci, R. Bizzarri and G. Ruggeri, Soft Matter, 2011, 7, 3689–3700 RSC.
- Z. Chi, X. Zhang, B. Xu, X. Zhou, C. Ma, Y. Zhang, S. Liu and J. Xu, Chem. Soc. Rev., 2012, 41, 3878–3896 RSC.
- Z. Ma, Z. Wang, M. Teng, Z. Xu and X. Jia, ChemPhysChem, 2015, 16, 1811–1828 CrossRef CAS PubMed.
- Y. Sagara, S. Yamane, M. Mitani, C. Weder and T. Kato, Adv. Mater., 2016, 28, 1073–1095 CrossRef CAS PubMed.
- P. Xue, J. Ding, P. Wang and R. Lu, J. Mater. Chem. C, 2016, 4, 6688–6706 RSC.
- C. Wang and Z. Li, Mater. Chem. Front., 2017, 1, 2174–2194 RSC.
- H. Vass, S. L. Black, E. M. Herzig, F. B. Ward, P. S. Clegg and R. J. Allen, Rev. Sci. Instrum., 2010, 81, 053710 CrossRef PubMed.
- S. E. Murthy, A. E. Dubin and A. Patapoutian, Nat. Rev. Mol. Cell Biol., 2017, 18, 771–783 CrossRef CAS PubMed.
- D. Mohammed, M. Versaevel, C. Bruyère, L. Alaimo, M. Luciano, E. Vercruysse, A. Procès and S. Gabriele, Frontiers in Bioengineering and Biotechnology, 2019, 7, 162–179 CrossRef PubMed.
- A. J.-L. Ayitou, G. Fukuhara, E. Kumarasamy, Y. Inoue and J. Sivaguru, Chem.–Eur. J., 2013, 19, 4327–4334 CrossRef CAS PubMed.
- Y. Sagara, N. Tamaoki and G. Fukuhara, ChemPhotoChem, 2018, 2, 959–963 CrossRef CAS.
- T. Kosaka, S. Iwai, G. Fukuhara, Y. Imai and T. Mori, Chem.–Eur. J., 2019, 25, 2011–2018 CrossRef CAS PubMed.
- S. Yonezawa, R. Sethy, G. Fukuhara, T. Kawai and T. Nakashima, Chem. Commun., 2019, 55, 5793–5796 RSC.
- Y. Takeda, H. Mizuno, Y. Okada, M. Okazaki, S. Minakata, T. Penfold and G. Fukuhara, ChemPhotoChem, 2019, 3, 1203–1211 CrossRef CAS.
- A. Miyagawa, J. Eng, T. Okada, Y. Inoue, T. Penfold and G. Fukuhara, ACS Omega, 2020, 5, 897–903 CrossRef CAS PubMed.
- H. Mizuno, M. Kitamatsu, Y. Imai and G. Fukuhara, ChemPhotoChem, 2020, 4, 502–507 CrossRef CAS.
- K. Nakasha and G. Fukuhara, ACS Appl. Polym. Mater., 2020, 2, 2303–2310 CrossRef CAS.
- A. Miyagawa, T. Kinoshita, Y. Zheng, M. Harada, G. Fukuhara and T. Okada, J. Phys. Chem. B, 2020, 124, 7263–7271 CrossRef CAS PubMed.
- A. Miyagawa, H. Yoneda, H. Mizuno, M. Numata, T. Okada and G. Fukuhara, ChemPhotoChem, 2021, 5, 118–122 CrossRef CAS.
- M. Fukuchi, K. Oyama, H. Mizuno, A. Miyagawa, K. Koumoto and G. Fukuhara, Langmuir, 2021, 37, 820–826 CrossRef CAS PubMed.
- D. H. Appella, L. A. Christianson, I. L. Karle, D. R. Powell and S. H. Gellman, J. Am. Chem. Soc., 1996, 118, 13071–13072 CrossRef CAS.
- D. J. Hill, M. J. Mio, R. B. Prince, T. S. Hughes and J. S. Moore, Chem. Rev., 2001, 101, 3893–4011 CrossRef CAS PubMed.
- Y. Ferrand and I. Huc, Acc. Chem. Res., 2018, 51, 970–977 CrossRef CAS PubMed.
- E. A. John, C. J. Massena and O. B. Berryman, Chem. Rev., 2020, 120, 2759–2782 CrossRef CAS PubMed.
- A. Zhu, M. J. Mio, J. S. Moore and H. G. Drickamer, J. Phys. Chem. B, 2001, 105, 12374–12377 CrossRef CAS.
- Y. Hekata and H. Maeda, Chem.–Eur. J., 2011, 17, 1485–1492 CrossRef PubMed.
- Y. Haketa, Y. Bando, K. Takaishi, M. Uchiyama, A. Muranaka, M. Naito, H. Shibaguchi, T. Kawai and H. Maeda, Angew. Chem., Int. Ed., 2012, 51, 7967–7971 CrossRef CAS PubMed.
- K. P. McDonald, Y. Hua, S. Lee and A. H. Flood, Chem. Commun., 2012, 48, 5065–5075 RSC.
- S. J. Butler and D. Parker, Chem. Soc. Rev., 2013, 42, 1652–1666 RSC.
- J. Cai and J. L. Sessler, Chem. Soc. Rev., 2014, 43, 6198–6213 RSC.
- N. Busschaert, C. Caltagirone, W. V. Rossom and P. A. Gale, Chem. Rev., 2015, 115, 8038–8155 CrossRef CAS PubMed.
- S. Kubik, Acc. Chem. Res., 2017, 50, 2870–2878 CrossRef CAS.
- C. Reichardt and T. Welton, Solvents and Solvent Effects in Organic Chemistry, Wiley-VCH, Weinheim, 2011 Search PubMed.
- J. C. Nelson, J. G. Saven, J. S. Moore and P. G. Wolynes, Science, 1997, 277, 1793–1796 CrossRef CAS PubMed.
Footnote |
| † Electronic supplementary information (ESI) available: Photographs of the hydrostatic-pressure spectroscopic apparatus, excitation spectra, pressure-induced wavenumber and g factor changes, fluorescence lifetime decays, UV/vis absorption titration data under hydrostatic pressures and NMR data of the anion receptor and chiral binaphthylammonium salts. See DOI: 10.1039/d1sc00664a |
| This journal is © The Royal Society of Chemistry 2021 |

