 Open Access Article
The key role of the latent N–H group in Milstein's catalyst for ester hydrogenation†
John
Pham
 ,
Cole E.
Jarczyk
 ,
Eamon F.
Reynolds
 ,
Sophie. E.
Kelly
 ,
Thao
Kim
 ,
Tianyi
He
 ,
Jason M.
Keith
 * and
Anthony R.
Chianese
 *
*
Department of Chemistry, Colgate University, 13 Oak Drive, Hamilton, New York 13346, USA. E-mail: jkeith@colgate.edu; achianese@colgate.edu
First published on 24th May 2021
Abstract
We previously demonstrated that Milstein's seminal diethylamino-substituted PNN-pincer–ruthenium catalyst for ester hydrogenation is activated by dehydroalkylation of the pincer ligand, releasing ethane and eventually forming an NHEt-substituted derivative that we proposed is the active catalyst. In this paper, we present a computational and experimental mechanistic study supporting this hypothesis. Our DFT analysis shows that the minimum-energy pathways for hydrogen activation, ester hydrogenolysis, and aldehyde hydrogenation rely on the key involvement of the nascent N–H group. We have isolated and crystallographically characterized two catalytic intermediates, a ruthenium dihydride and a ruthenium hydridoalkoxide, the latter of which is the catalyst resting state. A detailed kinetic study shows that catalytic ester hydrogenation is first-order in ruthenium and hydrogen, shows saturation behavior in ester, and is inhibited by the product alcohol. A global fit of the kinetic data to a simplified model incorporating the hydridoalkoxide and dihydride intermediates and three kinetically relevant transition states showed excellent agreement with the results from DFT.
Introduction
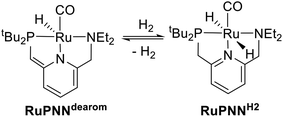
Catalytic transformations relying on metal–ligand-cooperative hydrogenation or dehydrogenation of polar substrates have seen a dramatic expansion in development over the past decade and a half, following the disclosure by Milstein and co-workers of the PNN-pincer–ruthenium complex RuPNNdearom (Scheme 1), shown to be active under relatively mild conditions for the hydrogenation of esters to alcohols,1 as well as the reverse reaction, the acceptorless dehydrogenative coupling (ADC) of primary alcohols to esters.2 This complex has since been applied to a wide range of mechanistically related transformations.3 In the original reports, the dearomatized complex RuPNNdearom was shown to react reversibly with hydrogen at room temperature to give the rearomatized dihydride complex RuPNNH2. Based on this observation, a mechanism was proposed that involved this heterolytic cleavage of hydrogen as a key step in catalytic ester hydrogenation.In the years since the initial reports on RuPNNdearom, many researchers have studied the effect of catalyst structure on activity in ester hydrogenation, and several highly optimized catalysts have been discovered that give more than 10![[thin space (1/6-em)]](https://www.rsc.org/images/entities/char_2009.gif) 000 turnovers at full substrate conversion.4 Common to almost all of these elite catalysts is an N–H functional group on the ligand. In some cases, the N–H group was demonstrated to be essential for high catalytic activity through the synthesis of control ligands where N–H was replaced with N–Me, N–Bn, or O.4a,c,e In many cases, minimum-energy pathways involving deprotonation of the N–H group have been identified through density functional theory,4c,f,h,i,5 although recent computational work has suggested that in some cases, the N–H group may function in catalysis as a hydrogen-bond donor without being deprotonated on the catalytic cycle.5b,6 Although many of the most highly active catalysts for ester hydrogenation feature an N–H functional group, several structural motifs lacking an N–H group have also been reported. In particular, several ruthenium catalyst variants featuring dialkylamino side groups like RuPNNdearom have shown activity.4d,7
000 turnovers at full substrate conversion.4 Common to almost all of these elite catalysts is an N–H functional group on the ligand. In some cases, the N–H group was demonstrated to be essential for high catalytic activity through the synthesis of control ligands where N–H was replaced with N–Me, N–Bn, or O.4a,c,e In many cases, minimum-energy pathways involving deprotonation of the N–H group have been identified through density functional theory,4c,f,h,i,5 although recent computational work has suggested that in some cases, the N–H group may function in catalysis as a hydrogen-bond donor without being deprotonated on the catalytic cycle.5b,6 Although many of the most highly active catalysts for ester hydrogenation feature an N–H functional group, several structural motifs lacking an N–H group have also been reported. In particular, several ruthenium catalyst variants featuring dialkylamino side groups like RuPNNdearom have shown activity.4d,7
During mechanistic studies of our previously reported7c,d,8 CNN-pincer–ruthenium catalysts for ester hydrogenation, we made a surprising observation: precatalysts featuring NEt2 or NiPr2 side groups underwent an unexpected dehydroalkylation reaction, releasing an equivalent of ethane or propane early on in catalytic reactions.9 The observation of catalytic induction periods concomitant with the release of alkane established that dehydroalkylation was a necessary step in formation of the active catalyst. Milstein's catalyst RuPNNdearom, which features an NEt2 side group, also showed an induction period for ester hydrogenation, and released ethane concomitantly with the onset of catalytic activity. By heating our CNN- and Milstein's PNN-pincer precatalysts in the presence of tricyclohexylphosphine, we were able to trap the products of dehydroalkylation as five-coordinate ruthenium(0) complexes, where the dialkylamino side group was transformed to an imine functionality (PNN variant shown in Scheme 2). RuPNNimine, the ruthenium(0) derivative of RuPNNdearom, is dramatically more active as a precatalyst for ester hydrogenation than its precursor, and is by some measures the most efficient catalyst currently known for ester hydrogenation, giving in excess of 10![[thin space (1/6-em)]](https://www.rsc.org/images/entities/char_2009.gif) 000 catalytic turnovers at room temperature with no added base. Several catalysts have been reported to operate at4d,10 or near4b,c,5a,11 room temperature, but require significant quantities of strongly basic additives such as NaOtBu and KOtBu. Conversely, several catalysts operate without the need for added base, but require temperatures of 80 °C or higher.1,5g,12
000 catalytic turnovers at room temperature with no added base. Several catalysts have been reported to operate at4d,10 or near4b,c,5a,11 room temperature, but require significant quantities of strongly basic additives such as NaOtBu and KOtBu. Conversely, several catalysts operate without the need for added base, but require temperatures of 80 °C or higher.1,5g,12
To further probe the catalyst speciation under operating conditions, we monitored the reaction of RuPNNimine with hydrogen at room temperature. Under 10 bar H2, RuPNNimine converts quantitatively to the dihydride complex RuPNNHEt, involving a net hydrogenation of the imine functional group and a net oxidative addition of H2 to the ruthenium center (Scheme 2). As RuPNNHEt contains a ruthenium hydride and N–H group, we proposed9 that it may be an active catalytic intermediate in reactions initiated by RuPNNimine and RuPNNdearom, operating by a metal–ligand-cooperative mechanism analogous to that proposed for other elite N–H-containing catalysts.
The discovery of the dehydroalkylative activation of RuPNNdearom has potentially broad mechanistic implications. Because we have demonstrated that RuPNNdearom is not a kinetically competent intermediate and must undergo dehydroalkylation prior to being catalytically active for ester hydrogenation, it is unlikely that the originally proposed mechanism1 is correct. Three reports in the literature apply density functional theory to predict the mechanism of ester hydrogenation or the reverse ADC, catalyzed by RuPNNdearom.13 Since these studies rely on the catalytic intermediacy of RuPNNdearom or RuPNNH2, they too are unlikely to be correct. More broadly, RuPNNdearom has been applied as a catalyst for a wide range of related hydrogenation and dehydrogenation reactions, including amine–alcohol coupling,3a–d couplings of amines3e or alcohols3f with esters, organic carbonate hydrogenation,3g carbon dioxide hydrogenation,3h and amide α-alkylation with alcohols.3i All of these transformations are conducted at or above 100 °C, where the dehydroalkylation reaction occurs rapidly (t½ = 6 min at 100 °C). As such, it is possible that RuPNNdearom is inactive prior to dehydroalkylation in these systems as well, which may call into question the DFT studies of these transformations.13a,14
Kinetic studies have the potential to validate or falsify the findings from computation, as they show conclusively what species are consumed or released on the pathway from the turnover-frequency-determining intermediate (TDI) to the turnover-frequency-determining-transition state (TDTS).15 For example, recent kinetic investigations of metal-catalyzed hydroformylation16 and ketone hydrogenation17 have provided deep insight into the underlying reaction mechanisms. Although catalytic ester hydrogenation and its microscopic reverse, ADC, have been studied intensively through computational methods, detailed experimental mechanistic investigations, especially kinetic studies, are scarce. In studies of an iridium–bipyridine catalyst system, Brewster, Sanford, and Goldberg determined the dependence of turnover number at low conversion on the concentrations of catalyst, hydrogen, and ester.12h However, as reactions were not monitored over time, this study did not probe for potential activation of catalyst observed as an induction period, and did not probe for potential product inhibition. Filonenko, Pidko and coworkers reported time-course studies of ester hydrogenation catalyzed by CNC-pincer–ruthenium complexes, but did not determine the detailed dependences of the rate on concentrations.4e O and Morris also reported time-course studies for ester hydrogenation catalyzed by ruthenium complexes of NHC–amine ligands, but also did not determine a rate law.5a
In this paper, we describe a computational and experimental mechanistic study of ester hydrogenation catalyzed by RuPNNimine. We report the crystallographic characterization of the key dihydride intermediate RuPNNHEt, and the synthesis and characterization of the ruthenium-hydrido-alkoxide RuPNNHOEt, which represents the catalytic resting state and TDI. Detailed kinetic studies show an induction period at room temperature during which RuPNNimine is converted to the active form, and after which the reaction shows first-order dependence on [catalyst] and [hydrogen], first-order saturation behavior in [ester], and a transition from inverse second-order to inverse-first-order inhibition by the product alcohol. All of this kinetic behavior, as well as the overall rate of reaction, is consistent with the minimum-energy pathway calculated using density functional theory.
Computational mechanistic analysis
Background
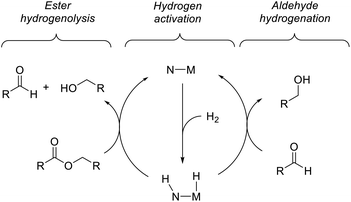
Previous computational studies of the mechanism of ester hydrogenation catalyzed by transition-metal complexes with a pendant N–H functional group have converged on a bicyclic pathway,4c,f,h,i,5 which can be separated into three linear sequences (Scheme 3). In the hydrogen-activation sequence, the H–H bond is cleaved heterolytically, placing a hydride on the metal center and a proton on the basic nitrogen center. In ester hydrogenolysis, these hydrogen atoms are transferred to the ester substrate, and cleavage of the C–O bond facilitated by the catalyst produces an aldehyde intermediate and one product alcohol molecule. In the aldehyde-hydrogenation sequence, the intermediate aldehyde is reduced to alcohol by the hydrogenated form of the catalyst. In one important variation on this scheme, it is possible that the nitrogen remains protonated throughout catalysis if an exogenous alkoxide base participates in hydrogen cleavage directly.5b,6We chose ethyl acetate as an appropriate model ester for computational study, for several reasons: (1) its use is well-precedented in both experimental and computational work; (2) it is small enough to minimize issues resulting from a large number of potential conformations; (3) it is large enough to appropriately model the steric interactions of common ester substrates with the catalyst. In particular, we expected the energetics of ethyl acetate hydrogenation to closely mimic those of hexyl hexanoate, which we employed in the kinetic studies described below.
Consideration of plausible resting states
We began our study by comparing the relative free energies of plausible catalyst resting states, in each case considering the effect of hydrogen-bonded product ethanol molecules (Scheme 4). Dihydride species g, g1, and g2 were identified, and we found a small (<2.0 kcal mol−1) effect of binding to ethanol on the standard-state free energy. The calculated structure of g very closely matches the crystal structure of RuPNNHEt, described below. We found that unsaturated intermediates c, c1, and c2, related to the dihydride compounds by formal loss of H2, were approximately 4–5 kcal mol−1 higher in energy than their dihydride counterparts. We also considered hydridoalkoxide species a1 and a2. Although the “free” species a1 is similar in energy to its unsaturated counterpart c1, the hydridoalkoxide a2 with an additional hydrogen-bonded ethanol molecule is much more stable than c2, and is identified as the catalyst resting state. As described below, the calculated structure of a2 closely matches the crystal structure of RuPNNHOEt, and the experimental kinetics are consistent with a2 as the catalyst resting state.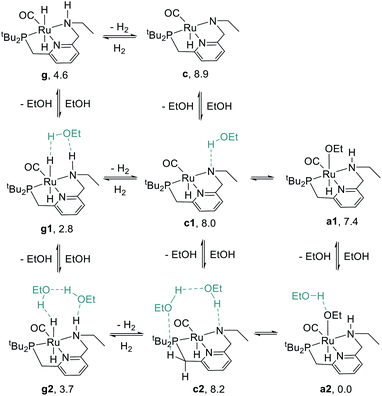 | ||
| Scheme 4 Species considered as plausible resting states. Energies given represent standard-state free energies in kcal mol−1 at 298.15 K relative to a2. | ||
Pathway for hydrogen activation
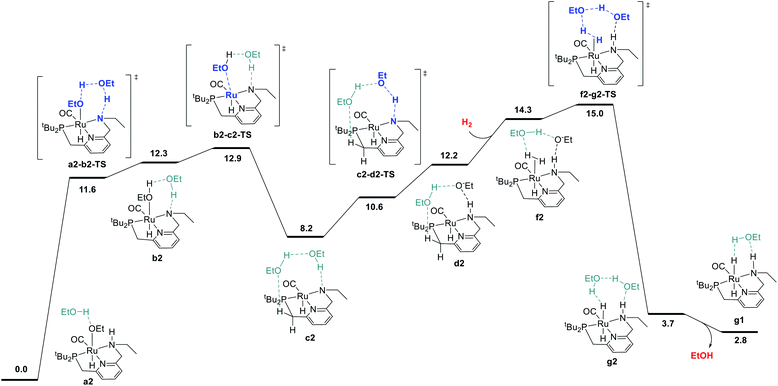
We began by probing a range of possible pathways for the activation of H2, informed by the rich history of prior work on related reactions. Our search for the MEP for H2 activation covered metal–ligand-cooperative heterolytic cleavage involving the N–H functional group, as proposed by Noyori and co-workers for their seminal carbonyl hydrogenation catalysts,18 both with and without explicit ethanol molecules to serve as proton shuttles. Noyori-type mechanisms for H2 activation have been identified for a range of catalysts for ester hydrogenation or ADC.4c,f,h,i,5a,c–j,6d We also carefully searched for pathways involving cooperative activation of H2 through the ruthenium center and an ethoxide anion, which Dub et al. showed can bypass the deprotonation of the N–H group on the pincer ligand.5b,6 Lastly, we exhaustively examined pathways for H2 activation involving deprotonated CH2 linkers on the pincer ligand, as originally proposed by Milstein and coworkers,1 and identified by DFT in many studies.13a,14a–e,g,19Fig. 1 shows the pathway we identified with the lowest overall barrier, which we describe as a “proton brigade” because of the involvement of two ethanol molecules in the stepwise cleavage of the H–H bond. Beginning with the resting state a2, whose experimental characterization is described in the next section, a double proton transfer through a2-b2-TS (ref. 20) gives the N-deprotonated species b2 with a neutral ethanol molecule coordinated to Ru. Then, this ethanol dissociates to give the unsaturated species c2, which transfers a proton back to nitrogen to give d2 before binding H2 in the σ-complex f2, in which the nitrogen is protonated and an ethoxide anion is stabilized by two hydrogen bonds. Then, H2 is cleaved through the proton-shuttle transition state f2-g2-TS, resulting in the dihydride species g2 (with two associated ethanol molecules) or g1 (with one associated ethanol). Although this pathway does involve temporary deprotonation of nitrogen between a2 and d2, the reformation of the N–H bond is not concerted with H2 cleavage. We also located a pathway connecting a2 to d2 where the N–H bond remains intact (Fig. S1†), and a pathway connecting c2 to f2 where hydrogen coordination occurs before proton transfer to nitrogen (Fig. S2†), both with slightly higher barriers.
The MEP identified for hydrogen activation requires passing through f2-g2-TS at 15.0 kcal mol−1. Notably, this proton-brigade pathway relies on the inclusion of two explicit ethanol molecules, both for the low overall barrier and for the stepwise proton-shuttle mechanisms. For comparison, we calculated analogous pathways involving only one ethanol molecule as proton shuttle and involving no ethanol molecules. These pathways, both concerted, are described in detail in the ESI (Fig. S3†), and were found to proceed through higher overall barriers of 18.6 and 25.3 kcal mol−1, respectively.
We also searched exhaustively for pathways involving the activation of H2 mediated by deprotonated CH2 linkers of the pincer ligand, both with and without explicit ethanol molecules as proton shuttles. These pathways, described in detail in the ESI,† would implicate dearomatized species similar to RuPNNdearom as key intermediates in catalysis. All mechanisms of this nature were found to proceed through higher barriers for H2 cleavage, with a lowest identified barrier of 25.6 kcal mol−1 for mechanisms involving the NCH2 linker and 23.7 kcal mol−1 for the PCH2 linker. In summary, our work shows that the presence of the N–H functional group is essential for activation of hydrogen with a low barrier. The N–H group is temporarily deprotonated in our MEP, but a pathway where the N–H group remains protonated and instead serves to stabilize intermediates and transition states through hydrogen bonding is energetically similar, and cannot be excluded by DFT. Pathways involving deprotonation of CH2 linkers have significantly higher barriers and can be excluded.
Pathway for ester hydrogenolysis
The ester hydrogenolysis portion of the catalytic cycle involves the hydrogenation of the carbonyl functional group and cleavage of the C–O bond, ultimately releasing one product alcohol molecule and an aldehyde intermediate. Prior work on many systems has identified the transfer of hydride from the metal to the carbonyl carbon as a key initial step, which generates a hemiacetaloxide intermediate. Two principal pathways for cleavage of the C–OEt bond have emerged, which have been shown to have similar barriers for related catalysts. These pathways differ by the coordination of either the aldehyde oxygen4c,f,i,5d,f,h,6d or the alkoxide oxygen4h,5a,h,i,6d,21 to Ru during C–O cleavage. In our system, we find these mechanisms to have nearly identical barriers, as described below. The pathway shown in Fig. 4 is an example of the former mechanism. Beginning from the dihydride intermediate g1, the ester replaces the hydrogen-bonded alcohol molecule to give the reactant complex h, which transfers hydride from Ru to C to give the C–H σ-complex i, where the hemiacetaloxide oxygen is stabilized by hydrogen-bonding to the N–H. Then, proton transfer from N to O gives j,20 which rearranges to place the hydroxyl oxygen on Ru in k, followed by reprotonation of nitrogen and subsequent hydrogen bond formation to give the Ru-bound hemiacetaloxide complex m. Then, cleavage of the C–O bond, concerted with proton transfer from N back to O, gives n, a loosely-bound complex of the product ethanol and intermediate acetaldehyde. Replacement of the aldehyde with another ethanol molecule gives c2, which connects back to the hydrogen activation pathway in Fig. 1 and completes the first hydrogenation cycle.The ester hydrogenolysis pathway shown above proceeds through a highest barrier of 17.4 kcal mol−1, which is the free energy of the intermediate species n. Notably, intermediates k and n and transition states k-l-TS and m-n-TS all have essentially identical free energies of 17.0–17.4 kcal mol−1. Thus, flux through this sequence is limited by both the cleavage of the O–H bond in k (essentially barrierless in the forward direction) and the cleavage of the C–O bond in m (essentially barrierless in the reverse direction).20
We also identified a different pathway for C–O cleavage, with a nearly identical overall barrier of 18.1 kcal mol−1, which directly places the newly formed ethoxide rather than the aldehyde on ruthenium (Fig. S8†). Similar to the transformation identified by Hasanayn and termed a hydride-alkoxide metathesis,21 this pathway would predict identical kinetic behavior as the one shown below in Fig. 2. In the process of establishing the twin minimum-energy pathways described in Fig. 2 and S8,† we characterized diastereomeric sequences where the ester initially coordinates to Ru through the opposite face, and pathways involving an explicit ethanol molecule. As described in detail in the ESI,† we found slightly higher overall barriers for the diastereomeric pathways (Fig. S10 and S12†) and similar overall barriers for pathways involving an explicit ethanol molecule (Fig. S11 and S14†). We also calculated a ruthenium-free pathway for the conversion of the hemiacetal to ethanol and acetaldehyde (Fig. S15†), and find a much higher barrier of 36.4 kcal mol−1, in line with previous work.6d,14h In summary, we find that ester hydrogenolysis proceeds in our system by well-precedented mechanisms for ruthenium–pincer catalysts possessing an N–H group, and that the decomposition of the hemiacetal is mediated by the ruthenium–pincer catalyst.
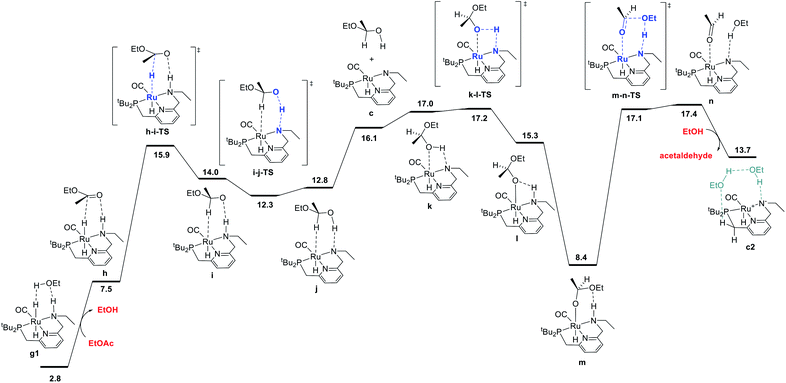 | ||
| Fig. 2 MEP for hydrogenolysis of ethyl acetate to acetaldehyde and ethanol, accompanied by conversion of dihydride intermediate g1 into unsaturated intermediate c2, which connects back to the hydrogen-activation pathway shown in Fig. 1. Note that the standard-state free energy of 13.7 kcal mol−1 reported here for c2 corresponds to release of acetaldehyde and binding of ethanol from n, whereas the free-energy of 8.2 kcal mol−1 reported for c2 in Fig. 1 is calculated against the ethyl acetate and dihydrogen reactants. | ||
Pathway for aldehyde hydrogenation
The final portion of the catalytic cycle involves hydrogenation of the aldehyde intermediate to give the second equivalent of alcohol product. This sequence, as mediated by a ruthenium hydride complex with a pendent N–H functional group on the ligand, has been studied extensively through DFT in the context of ester hydrogenation, but also has a longer history dating back to the original Noyori catalysts, which were highly efficient for aldehyde and ketone hydrogenation.18 For ester hydrogenation catalysts, the aldehyde hydrogenation step is generally found to have a lower barrier than the ester hydrogenolysis step, which along with the thermodynamic instability of the aldehyde with respect to reactants, is consistent with the lack of buildup of aldehyde in catalytic reactions. For our catalytic system, we identified the pathway shown in Fig. 3, beginning with coordination of the aldehyde to form r. This is followed by stepwise transfer of hydride and proton to the substrate from the ruthenium and nitrogen centers, respectively, giving intermediates s and t. Dissociation of the C–H σ-complex gives c1, which connects back to the hydrogen activation pathway.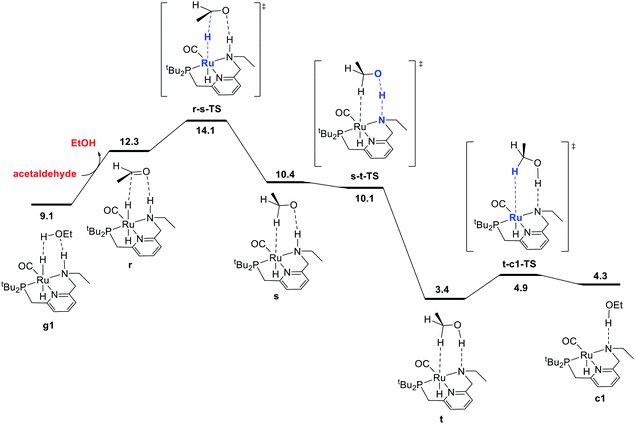 | ||
| Fig. 3 MEP for hydrogenation of acetaldehyde to ethanol, accompanied by conversion of dihydride intermediate g1 into unsaturated intermediate c1, which connects back to the hydrogen-activation pathway shown in Fig. 1. For consistency in this energy diagram, the free energy of intermediate g1 (9.1 kcal mol−1) is calculated based on the organic intermediates ethanol, acetaldehyde, and one molecule of hydrogen, whereas the free energy of 2.8 kcal mol−1 shown in Fig. 1 and 4 is based on the organic reactants ethyl acetate and two molecules of hydrogen. This presentation ensures that free energy changes within each figure are correct (e.g. the standard-state free energy change on substituting ethanol for acetaldehyde in converting from g1 to r is 3.2 kcal mol−1 as shown in this figure). | ||
In some recent studies,6,13c,22 proton transfer from the ligand to the alkoxide oxygen was calculated to have a higher barrier than proton transfer from an exogenous alcohol molecule, which enables the construction of a pathway for hydrogenation where the ligand N–H group (or CH2 linker) is never deprotonated. Pathways like this may have been missed in earlier work because of the optimization of structures without a solvent model, which can favor concerted proton/hydride transfer pathways and disfavor ion-pair intermediates such as s. In our work, conducting geometry optimizations using a toluene continuum solvent model allowed the identification of the intermediate s. As proton transfer from N to O through s-t-TS is barrierless20 and strongly exergonic in our system, we did not search extensively for additional pathways for conversion of the aldehyde to ethanol.
Summary and predicted kinetics
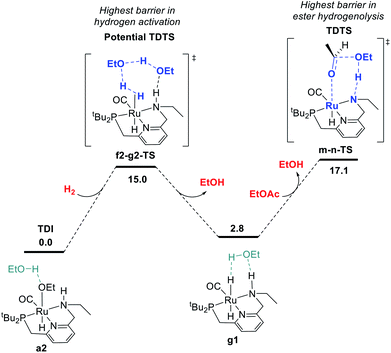
In summary, we have identified MEPs for hydrogen activation, ester hydrogenolysis, and aldehyde hydrogenation in ester hydrogenation catalyzed by RuPNNHEt, which forms in situ from RuPNNimine as we have shown experimentally.9Fig. 4 shows a simplified energy diagram depicting key intermediates and transition states relevant in predicting the kinetics of hydrogenation through the energetic span model.15 The hydrido-alkoxide complex a2 is predicted to be the turnover-frequency-determining intermediate (TDI). The highest-energy transition states in the hydrogen activation and ester hydrogenolysis sequences are f2-g2-TS and m-n-TS, respectively. Although intermediate n is calculated to be higher than m-n-TS by 0.3 kcal mol−1,20 we have used m-n-TS in our kinetic analysis for consistent application of transition-state theory to calculate rate constants. The 2.1 kcal mol−1 free-energy difference between f2-g2-TS and m-n-TS is likely within the error of the DFT method, especially considering the changes in molecularity involved: between a2 and f2-g2-TS, a hydrogen molecule is consumed, and between f2-g2-TS and m-n-TS, two ethanol molecules are released and ethyl acetate is consumed.The energetic span model allows a prediction of the rate of catalysis based on the free-energy difference between the TDI and the TDTS, which is an effective barrier for catalytic turnover.15 Taking our DFT results at face value, the TDTS is m-n-TS when the reactants, EtOAc and H2, as well as the product EtOH, are at their standard states of 1 M. In this scenario, the energetic span is 17.1 kcal mol−1, which is qualitatively consistent with a catalytic system that turns over rapidly at room temperature. The predicted rate law, based on the species consumed and released between the TDI and TDTS, is represented by eqn (1). In our experimental kinetic analysis described below, we have taken the above simplified model as a starting point, and additionally we find saturation behavior at high [ester], consistent with a switch to f2-g2-TS as TDTS under these conditions.
 | (1) |
Effect of explicit ethanol on kinetics
Motivated by past work showing the key involvement of protic solvent in heterolytic hydrogen cleavage23 and by the complicated dependence of our catalytic rate on alcohol concentration (as described below), we examined the effect of including explicit ethanol molecules in the hydrogen activation and ester hydrogenolysis pathways described above. The complete pathways are included in the ESI.†Fig. 5 shows a summary of the effect of explicit ethanol molecules on the free energies of key intermediates and transition states that determine the kinetics. Taking the computed free energies at face value, several predictions can be made about the kinetics. First, the hydrido-alkoxide intermediate a2 interacts strongly with an ethanol molecule from solution, so the “free” complex a1 does not represent a significant fraction of the resting catalyst speciation, even at very low ethanol concentration. Second, the minimum-energy pathway for hydrogen activation goes through f2-g2-TS and includes two ethanol molecules as a “proton brigade”, although a pathway through e1-g1-TS, with only one ethanol molecule as a proton shuttle, is only 3.6 kcal mol−1 higher. Third, as the energies of g, g1, and g2 – the dihydride intermediates with 0, 1, and 2 ethanol molecules included – are above the energy of a2 and below the energies of the transition states, their specific energies and relative ordering are not kinetically relevant. Last, ester hydrogenolysis proceeds through a very similar free-energy barrier whether an explicit ethanol molecule is included (m1-n1-TS, 17.4 kcal mol−1) or not (m-n-TS, 17.1 kcal mol−1). This model formed the basis for our kinetic analysis, described below.Synthesis of proposed intermediates
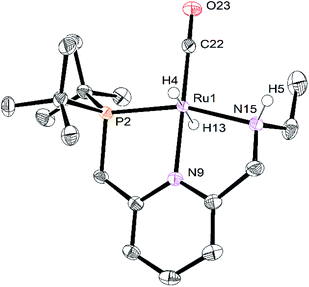
The crystals of RuPNNHEt formed by the method described above were suitable for characterization by X-ray crystallography. Fig. 6 shows the molecular structure in the solid state. As was concluded based on our previous spectroscopic characterization,9RuPNNHEt features a nearly octahedral ruthenium(II) center bound to two hydride ligands, carbon monoxide, and a PNN-pincer ligand with an aromatic pyridine fragment flanked by CH2P(tBu)2 on one side and CH2NHEt on the other. The structure is closely analogous to that of RuPNNH2 as recently reported by Gusev,13c except for the change from NEt2 to NHEt. The mechanism of double hydrogenation from RuPNNimine to give RuPNNHEt is not obvious, and is the subject of an ongoing experimental and computational study.
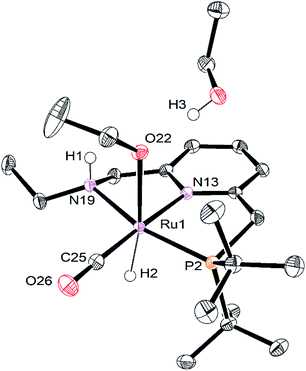
Single crystals of RuPNNHOEt suitable for X-ray crystallography were obtained by slow evaporation of a pentane solution containing a small amount of ethanol. Although crystals could be reproducibly obtained in this manner, the instability of RuPNNHOEt in the absence of an excess of ethanol coupled with its high solubility in solvents with a wide range of polarities have thus far prevented its bulk isolation as a solid. Fig. 7 shows the structure of RuPNNHOEt. In the solid state, the ethoxide ligand is syn to the N–H group, which is pseudo-axial and is 2.21 Å from the ethoxide oxygen, indicating a weak intramolecular hydrogen bond. A molecule of ethanol is present in the asymmetric unit, and the O–H hydrogen interacts with the ethoxide oxygen through hydrogen-bonding with a distance of 1.73 Å. The solid-state geometric parameters for RuPNNHOEt are remarkably similar to the computationally optimized structure a2, which was the lowest-energy hydrido-alkoxide conformation we were able to locate that included one explicit ethanol molecule.
The rapid conversion of RuPNNHEt to RuPNNHOEt at room temperature is consistent with our DFT study above. This transformation is the reverse of the hydrogen activation shown in Fig. 1, which is predicted to proceed in the reverse direction with a free-energy barrier of 12.1 kcal mol−1, proceeding from g1 through f2-g2-TS. The complete formation of RuPNNHOEt from RuPNNHEt suggested that, as predicted by computation, the alkoxide species might be more stable under catalytic conditions, and would hence represent the resting state and TDI. To confirm this, we placed a solution of RuPNNHOEt formed in situ from RuPNNHEt and ethanol under 10 bar H2 in a high-pressure NMR tube. No conversion back to the dihydride species was observed, consistent with the prediction from computation that RuPNNHOEt is the dominant resting state throughout the catalytic reaction.
Kinetics
As we noted in the introduction, DFT studies of catalytic ester hydrogenation are widespread but kinetic studies are rare. Because the computed mechanism and energies make clear predictions about the kinetics, the latter provide an important check on the former. Based on our computed mechanism, the following predictions can be made. First, because hydrogen activation occurs between the TDI and TDTS, the reaction should be first-order in hydrogen. If a dihydride intermediate such as g1 were more stable than the intermediate preceding hydrogen activation (a2 in our work), the reaction would follow zero-order kinetics in hydrogen. Second, because an ester molecule is consumed between the TDI and TDTS, the reaction should be first-order in ester. If the barrier for hydrogen activation were much higher than the barrier for ester hydrogenolysis, the reaction would follow zero-order kinetics in ester. If these two barriers are similar in energy, saturation behavior is possible. Third, because alcohol product is released between the TDI and TDTS, the reaction should be inhibited by the buildup of alcohol. The precise dependence of the rate on [alcohol] is not unambiguously predicted by computation, because of the multiple pathways available as shown in Fig. 5 above. Lastly, and very importantly, the overall rate of reaction should be approximately consistent with the overall barrier predicted by DFT, which is 17.1 kcal mol−1 in our system.Although the hydrogenation of ethyl acetate to ethanol was ideal for our computational study and for the isolation of the hydrido-alkoxide intermediate RuPNNHOEt, we chose to conduct detailed kinetic studies using hexyl hexanoate as substrate, because both the ester reactant and alcohol product have very low volatilities at room temperature, which minimizes the possibility of evaporation of reactant or product at any point during the setup, reaction, or analysis. As both RuPNNHEt and RuPNNHOEt were unstable in solution, we conducted kinetic studies using RuPNNimine as precatalyst. We previously determined that isopropyl alcohol was an ideal solvent for obtaining high catalytic rates and turnover numbers in practical ester hydrogenation catalyzed by RuPNNimine,9 but we decided to conduct kinetic studies in toluene for two reasons: (1) the RuPNNimine precatalyst is only sparingly soluble in isopropyl alcohol, posing difficulties with the preparation of stock solutions and occasionally causing clogging in the stainless-steel tubing used for removing aliquots from the reaction mixture; and (2) as described below, the hexanol product was found to inhibit turnover, and the analysis of this observed product inhibition was most straightforward if no other alcohols were present in solution.
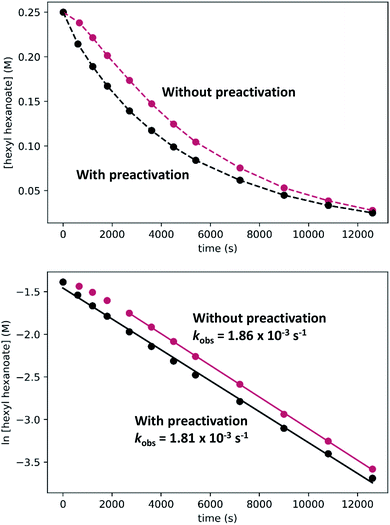
In kinetic experiments, we monitored the conversion of hexyl hexanoate to 1-hexanol at 25 °C by gas chromatography, with tetradecane as an internal standard. We began with the standard conditions shown in Scheme 7, then varied the initial concentrations of RuPNNimine, hexyl hexanoate, and hexanol, as well as the hydrogen pressure in independent experiments. The plots labeled “without preactivation” in Fig. 8 shows a typical kinetic trace under our standard conditions. Over approximately the first 45 minutes of the reaction, the rate increases, after which apparent pseudo-first-order consumption of ester is observed, as the plot of ln[ester] vs. time is linear after this point. During the 45 minute induction period, aliquots are dark purple, indicating the presence of the strongly absorbing precatalyst RuPNNimine, and become pale yellow as the precatalyst is converted to the resting state, which we propose is a hydrido-hexyloxide species analogous to RuPNNHOEt.
To determine if the observed induction period can be explained by the activation of RuPNNimine with hydrogen, we conducted a preactivation experiment where we first pressurized a solution of RuPNNimine with hydrogen (20 bar) for 90 minutes, which results in formation of the dihydride complex RuPNNHEt.9 Then, the hexyl hexanoate substrate was transferred into the pressure reactor and its conversion to 1-hexanol was monitored at 25 °C. As the plots labeled “with preactivation” in Fig. 8 demonstrate, the reaction follows apparent first-order kinetics without an induction period, giving a nearly identical kobs value to what is observed without pre-activation of the catalyst. Importantly, this experiment rules out the possibility that sigmoidal kinetics come from acceleration of the reaction by the product alcohol, as proposed by O and Morris for their catalyst.5a We also attempted to use RuPNNHEt directly as a precatalyst, but partial decomposition prior to the introduction of hydrogen pressure hindered our attempts to obtain reliable kinetic data. Because it was much more operationally convenient to assemble kinetic experiments in parallel without a catalyst preactivation step, we elected to conduct further kinetic trials using RuPNNimine as the precatalyst, using only the data after the 45 minute induction period to develop the kinetic model for the activated catalyst.
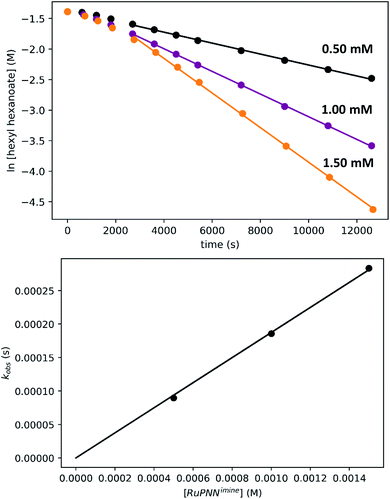
To determine the partial order in catalyst concentration under the standard conditions, we repeated the experiment with a range of initial concentrations of RuPNNimine (Fig. 9). The same initial induction period followed by pseudo-first-order behavior was observed, and kobs was taken as the slope of the linear portion of the plot of ln[ester] vs. time. A plot of kobsvs. [RuPNNimine]0 is linear with an intercept of zero, indicating that the reaction is first-order in [ruthenium] after the induction period is complete.
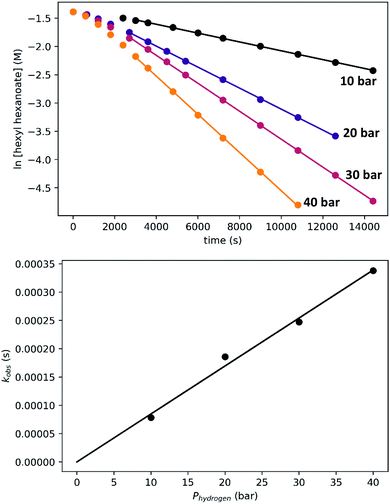
To determine the partial order in hydrogen, we repeated the standard experiment varying the hydrogen pressure (Fig. 10). In all experiments, a constant hydrogen pressure was maintained as aliquots were removed. Again, kobs was determined based on the linear portion of the plot of ln[ester] vs. time, and again a plot of kobsvs. hydrogen pressure gave a line with an intercept of zero, indicating that the reaction is first-order in hydrogen under these conditions.
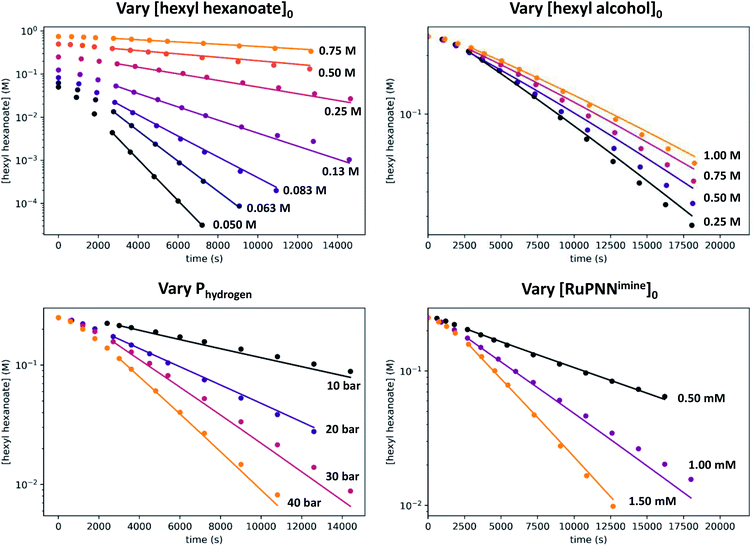
We then repeated the experiment with initial ester (hexyl hexanoate) concentrations varied over a wide range from 0.05 M to 0.75 M. At high [ester]0, we observed a change from pseudo-first-order to pseudo-zero-order behavior, consistent with saturation kinetics. When [ester]0 is 0.25 M or less, apparent first-order kinetic behavior is observed in each individual experiment, but kobs increases dramatically at lower [ester]0, consistent with inhibition by the product 1-hexanol. Although it may be counterintuitive that pseudo-first-order kinetic behavior in [ester] is observed when the buildup of alcohol product inhibits the reaction, in our system the increasing product inhibition is roughly cancelled out by saturation in [ester], resulting in apparent first-order behavior in each experiment. To directly probe for inhibition by the product hexanol, we repeated the experiment with a range of initial 1-hexanol concentrations, and we found that the rate decreases as [hexanol]0 is increased, consistent with product inhibition.
To deconvolute the effects of saturation in [ester] and inhibition by the product alcohol, we developed a numerical model of the reaction progress using the program Copasi.25 Numerical modeling is seeing increased use in the analysis of kinetics in catalytic systems.16b,26 When used in combination with DFT, kinetic modeling offers the potential to validate mechanisms and refine the energies predicted by DFT.16b,26e In developing our model, we included the data after the 45 minute induction period from a total of 18 kinetic experiments, where the initial ester, alcohol, and ruthenium concentrations were varied, as well as the hydrogen pressure. Our model takes the standard-state free energies of the kinetically relevant intermediates and transition states as inputs (see Fig. 5 above), and computes the time course for ester hydrogenation, given the initial concentrations of ruthenium catalyst (a2), hexyl hexanoate, hexanol, and hydrogen. Hydrogen concentration, calculated from its known solubility in toluene at 25 °C and the appropriate pressure,27 was held fixed in the model. Because the activity coefficients of alcohols are known to vary significantly over the range of 0 to 1.0 M in non-polar solvents,28 we used the activity of 1-hexanol rather than its molarity, as estimated following a model developed by Li and coworkers for 1-hexanol in benzene.29
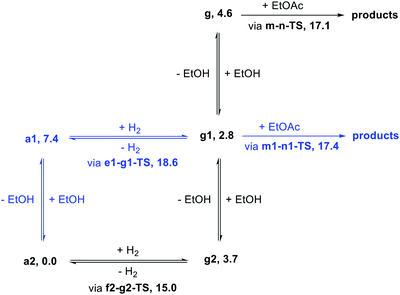
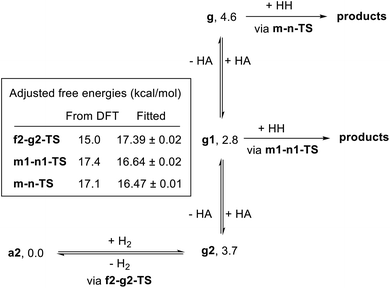
In attempting to reproduce the kinetic data with our model, we set the relative free energy of a2 to zero and compared a range of scenarios adjusting the remaining energies, in an attempt to achieve the best overall fit while including the smallest number of adjustable parameters. We found no better fit by allowing the free energies of a1, e1-g1-TS, g2, g1, or g to be adjusted. On the other hand, allowing adjustment of f2-g2-TS, m-n-TS, and m1-n1-TS was essential to obtaining a good global fit. Further, entirely excluding the pathway through e1-g1-TS had no detrimental effect on the fit. Our optimized model is depicted in Fig. 11, and the global fit to the kinetic data is shown in Fig. 12. The free energies of the dihydride species g, g1, and g2 were taken from the DFT results and held constant. The free energies of the transition states f2-g2-TS, m-n-TS, and m1-n1-TS were allowed to vary; fitted values are shown in Fig. 11.
Overall, the kinetic data are very well-reproduced by this simplified model, with minimal adjustment of the free energies obtained from DFT. Interestingly, the free energy of the hydrogen activation transition state f2-g2-TS was adjusted upward by 2.4 kcal mol−1, while the energies of the ester hydrogenolysis transition states were adjusted downward by 1.2 and 1.4 kcal mol−1, indicating that the standard-state activation barrier for hydrogen cleavage is the higher of the two, in contrast to the prediction from DFT. The model correctly reproduces the first-order dependence on hydrogen pressure, the first-order dependence on [Ru], and the saturation kinetics in [ester]. The inclusion of two similar-barrier pathways for ester hydrogenolysis allows a transition from second-order inhibition by alcohol at low [alcohol] to first-order inhibition at higher [alcohol], consistent with the data. Importantly, the relatively small adjustment of the transition-state energies, less than 3 kcal mol−1 in each case, indicates that the barriers from DFT calculations are consistent with overall rate of the catalytic reaction. The above model satisfactorily reproduces the effect of [hexanol] on the rate of reaction essentially by assuming strong hydrogen bonding to the resting state a2 and weaker interaction with the transition states for ester hydrogenation. However, we do not claim that this model fully accounts for the behavior of the alcohol in the system, which likely includes medium polarity effects and more complicated interactions with the reacting species.
Effect of added isopropyl alcohol
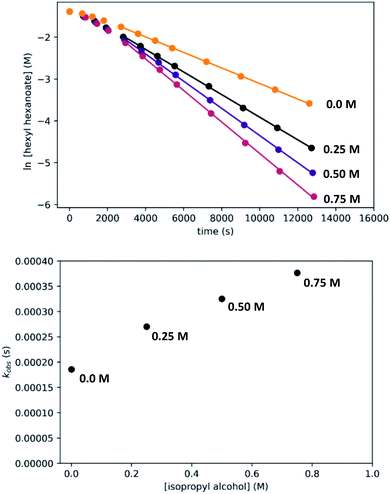
Although we have conducted the above kinetic experiments in toluene, we determined previously9 that isopropyl alcohol was an ideal solvent for the reaction, giving rates approximately 2–3 times faster than toluene and THF. To probe the accelerating effect of isopropyl alcohol further, we repeated our standard kinetic experiment with varying amounts of isopropyl alcohol added, up to 0.75 M. For comparison, pure isopropyl alcohol is 13.1 M. As shown in Fig. 13, we observe moderate but clear acceleration of the reaction with added isopropyl alcohol, consistent with our prior findings and in contrast with the inhibiting effect of added 1-hexanol. Although we have not tried to probe this effect further, it likely originates from a different balance of stabilization of the resting state and transition-states by the two alcohols, potentially through specific interactions and/or medium polarity effects. For example, the activity coefficient of 1-hexanol is expected to decrease with increasing [isopropyl alcohol], which should reduce 1-hexanol inhibition and accelerate the catalytic reaction. We note that the detailed rate dependence determined above for hexyl hexanoate, especially the effect of the alcohol, does not necessarily extend to the hydrogenation of all other esters.Disproportionation of aldehydes to esters
As Gusev has reported recently,30 catalysts for ester hydrogenation that produce an aldehyde intermediate can also be active for the catalytic disproportionation of aldehydes to esters, which effectively operates by running the ester hydrogenolysis pathway in reverse and the aldehyde hydrogenation pathway in the forward direction. Rearranging the pathways in Fig. 2 and 3 gives the MEP shown in Fig. S16 in the ESI,† with an overall barrier of 12.9 kcal mol−1. Therefore, our calculations predict that aldehyde disproportionation should be rapid at room temperature. To test this prediction, we dissolved 1-hexanal in benzene-d6 with 0.2 mol% RuPNNHEt at room temperature, and monitored by 1H NMR. After 10 minutes, the aldehyde was completely consumed and hexyl hexanoate was the major product (Scheme 8). Further studies of this disproportionation reaction are in progress.Discussion
We previously demonstrated that the ubiquitous RuPNNdearom is not kinetically competent as a catalyst for ester hydrogenation, instead converting from an inactive precatalytic form with an NEt2 side group to an active form RuPNNHEt, which features an NHEt group that is essential for catalytic activity.9 In this work, we have presented a plausible minimum-energy pathway, identified through computation and validated experimentally through kinetic characterization and isolation of two key intermediates, RuPNNHEt and RuPNNHOEt. Our computations demonstrate that the N–H functional group plays a key role in the exceptional room-temperature activity of this catalyst. The N–H group is deprotonated and re-protonated in our MEPs for hydrogen activation, ester hydrogenolysis, and aldehyde hydrogenation, although in the first two cases we identified nearly isoenergetic pathways where the N–H group acts only as a hydrogen-bond donor without being deprotonated. A thorough search for alternative pathways where a CH2 linker is involved in hydrogen activation identified a minimum barrier of 23.7 kcal mol−1, compared to 15.0 in our MEP.Because of the widespread application of RuPNNdearom in catalytic transformations and the corresponding widespread study of its reactivity by DFT prior to our disclosure of its facile dehydroalkylative activation, this system provides a unique case study in how the application of DFT in the absence of complementary experimental data can lead to the proposal of incorrect reaction mechanisms. Three studies we are aware of report a complete pathway for ester hydrogenation catalyzed by RuPNNdearom. In 2017, Zhang and coworkers reported a mechanism for the hydrogenation of ethyl benzoate catalyzed by RuPNNdearom.13b In their work, RuPNNdearom was identified as the resting state, and the highest barrier occurred in ester hydrogenolysis, giving an energetic span of 27.2 kcal mol−1. In 2011, Wang and coworkers reported a study comparing the activity of RuPNNdearom for the acceptorless dehydrogenative coupling (ADC) of alcohols to give esters against the coupling of amines and alcohols to give amides, rationalizing the preference for the latter pathway over the former.13a Reversing the ADC process predicts an overall energetic span of 38.5 kcal mol−1 for ester hydrogenation, from a dihydride resting state after hydrogen activation to a proton-transfer TDTS along the ester hydrogenolysis pathway. In 2020, Gusev reported a revised mechanism for ester hydrogenation and the reverse ADC, aided by the experimental identification of a hydridoalkoxide species as the proposed resting state.13c In that study, the energetic span from the hydridoalkoxide TDI to the TDTS, a Hasanayn-like21 hydride-alkoxide metathesis transition state, was 31.8 kcal mol−1.
As all three of the above studies rely on the on-cycle intermediacy of either RuPNNdearom, RuPNNH2, or both, the proposed mechanisms cannot be correct, as we have shown that RuPNNdearom, which converts rapidly to RuPNNH2 under hydrogen pressure,1 is inactive in ester hydrogenation prior to undergoing dehydroalkylation.9 With our present demonstration that the experimental free-energy barrier to catalytic turnover is only 17.4 kcal mol−1, the computed pathways above can also be excluded because the barriers they predict are implausibly high. Although it is not always explicitly stated, a common filter for the plausibility of reaction mechanisms calculated by DFT or other quantum-chemistry methods is a qualitative agreement of the overall reaction barrier with the observed rate of reaction. When detailed kinetic information is not available, reaction barriers must be estimated knowing only the catalyst loading, reaction time, and temperature. In the case of ester hydrogenation catalyzed by RuPNNdearom, Milstein's initial disclosure reported a turnover number of 100 in 4 h at 115 °C.1 If one assumes that catalyst induction is rapid and the turnover frequency is constant over the reaction time course, an overall barrier (energetic span) of 26.7 kcal mol−1 can be estimated. However, the barrier for turnover can be substantially overestimated if the catalyst undergoes a slow activation followed by very rapid turnover, as we showed is the case for this system.9 This overestimation makes the above mechanisms, especially those proposed by Gusev and Zhang, appear plausible even though they predict barriers that are much higher than the actual barrier for catalytic turnover.
It is worth revisiting a broader implication of the findings we report here. As we described in the introduction, the majority of elite catalysts for ester hydrogenation and the reverse ADC of alcohols feature an N–H group with a key role in promoting catalysis. In this work and in a prior study,9 we demonstrated that Milstein's catalyst RuPNNdearom and NEt2-substituted CNN-pincer analogs developed in our group7d are initially inactive, and must convert to an NHEt form to be catalytically active. Recently, Khaskin, Gusev, and coworkers22 have shown that the same is true for a related bipyridyl PNN-pincer catalyst originally reported by Milstein and coworkers.31 In this case, a pyridine ring is hydrogenated to a piperidine, again providing a latent N–H functional group with a key role in catalysis. Before these reports, initial proposals1,2,31 and many computational studies13a,14 pointed to the reversible deprotonation of a CH2 linker as a key step in catalysis, but these proposals should potentially be reevaluated in light of the new findings. Importantly, our work does not completely rule out the potential involvement of CH2 linkers in other processes. It is experimentally known that the addition of H2 to RuPNNdearom occurs reversibly at room temperature (Scheme 1).1 Our calculations (Fig. S7†) indicate that this process has a barrier of 23.7 kcal mol−1 under the conditions of ester hydrogenation, which is too high to account for the fast room-temperature turnover the activated catalyst exhibits in this process, but could be accessible at a higher temperature in a different process. We are continuing to probe these possibilities in computational and experimental studies of related catalytic transformations.
Conclusion
We previously demonstrated that Milstein's pincer–ruthenium catalyst for ester hydrogenation and related reactions is activated by dehydroalkylation to give the active form, which contains an NH functional group that is essential for catalysis.9 In this work, we have presented a detailed computational and experimental study of the mechanism of ester hydrogenation catalyzed by this activated form, and conclude that participation of the N–H functional group is key in hydrogen activation, ester hydrogenolysis, and aldehyde hydrogenation. The catalyst speciation, the overall rate of reaction, and the dependence of the rate on the concentrations of reactants and products determined by experiment are in agreement with the mechanism predicted by DFT.Author contributions
J. Pham: kinetic experiments, Copasi modeling, writing of manuscript. C. Jarczyk: DFT calculations, synthesis. E. Reynolds: DFT calculations, synthesis. S. Kelly: DFT calculations. T. Kim: DFT calculations. T. He: kinetic experiments, synthesis, DFT calculations. J. Keith: funding acquisition, supervision of computational work, review and editing of manuscript. A. Chianese: conceptualization, funding acquisition, and supervision; writing, review, and editing of manuscript.Conflicts of interest
The authors declare no competing financial interest.Acknowledgements
We thank the National Science Foundation (CHE-1665144 and CHE-1954924) for support of the research project, and (CHE-1726308) for the acquisition of an upgraded NMR spectrometer.References
- J. Zhang, G. Leitus, Y. Ben-David and D. Milstein, Angew. Chem., Int. Ed., 2006, 45, 1113–1115 CrossRef CAS.
- J. Zhang, G. Leitus, Y. Ben-David and D. Milstein, J. Am. Chem. Soc., 2005, 127, 10840–10841 CrossRef CAS.
- (a) C. Gunanathan, Y. Ben-David and D. Milstein, Science, 2007, 317, 790–792 CrossRef CAS PubMed; (b) B. Gnanaprakasam, E. Balaraman, Y. Ben-David and D. Milstein, Angew. Chem., Int. Ed., 2011, 50, 12240–12244 CrossRef CAS PubMed; (c) H. Zeng and Z. Guan, J. Am. Chem. Soc., 2011, 133, 1159–1161 CrossRef CAS PubMed; (d) J. W. Rigoli, S. A. Moyer, S. D. Pearce and J. M. Schomaker, Org. Biomol. Chem., 2012, 10, 1746–1749 RSC; (e) B. Gnanaprakasam and D. Milstein, J. Am. Chem. Soc., 2011, 133, 1682–1685 CrossRef CAS PubMed; (f) B. Gnanaprakasam, Y. Ben-David and D. Milstein, Adv. Synth. Catal., 2010, 352, 3169–3173 CrossRef CAS; (g) E. Balaraman, C. Gunanathan, J. Zhang, L. J. W. Shimon and D. Milstein, Nat. Chem., 2011, 3, 609–614 CrossRef CAS PubMed; (h) C. A. Huff and M. S. Sanford, ACS Catal., 2013, 3, 2412–2416 CrossRef CAS; (i) M. B. Chaudhari, G. S. Bisht, P. Kumari and B. Gnanaprakasam, Org. Biomol. Chem., 2016, 14, 9215–9220 RSC.
- (a) L. A. Saudan, C. M. Saudan, C. Debieux and P. Wyss, Angew. Chem., Int. Ed., 2007, 46, 7473–7476 CrossRef CAS PubMed; (b) D. Spasyuk and D. G. Gusev, Organometallics, 2012, 31, 5239–5242 CrossRef CAS; (c) D. Spasyuk, S. Smith and D. G. Gusev, Angew. Chem., Int. Ed., 2013, 52, 2538–2542 CrossRef CAS PubMed; (d) W. Li, J.-H. Xie, M.-L. Yuan and Q.-L. Zhou, Green Chem., 2014, 16, 4081–4085 RSC; (e) G. A. Filonenko, M. J. B. Aguila, E. N. Schulpen, R. van Putten, J. Wiecko, C. Müller, L. Lefort, E. J. M. Hensen and E. A. Pidko, J. Am. Chem. Soc., 2015, 137, 7620–7623 CrossRef CAS PubMed; (f) D. Spasyuk, C. Vicent and D. G. Gusev, J. Am. Chem. Soc., 2015, 137, 3743–3746 CrossRef CAS PubMed; (g) X. Tan, Q. Wang, Y. Liu, F. Wang, H. Lv and X. Zhang, Chem. Commun., 2015, 51, 12193–12196 RSC; (h) X. Tan, Y. Wang, Y. Liu, F. Wang, L. Shi, K. H. Lee, Z. Lin, H. Lv and X. Zhang, Org. Lett., 2015, 17, 454–457 CrossRef CAS; (i) Z. Wang, X. Chen, B. Liu, Q.-B. Liu, G. A. Solan, X. Yang and W.-H. Sun, Catal. Sci. Technol., 2017, 7, 1297–1304 RSC.
- (a) W. W. N. O and R. H. Morris, ACS Catal., 2013, 3, 32–40 CrossRef CAS; (b) T. Otsuka, A. Ishii, P. A. Dub and T. Ikariya, J. Am. Chem. Soc., 2013, 135, 9600–9603 CrossRef CAS PubMed; (c) S. Chakraborty, P. O. Lagaditis, M. Förster, E. A. Bielinski, N. Hazari, M. C. Holthausen, W. D. Jones and S. Schneider, ACS Catal., 2014, 4, 3994–4003 CrossRef CAS; (d) T. Chen, H. Li, S. Qu, B. Zheng, L. He, Z. Lai, Z.-X. Wang and K.-W. Huang, Organometallics, 2014, 33, 4152–4155 CrossRef CAS; (e) K. Junge, B. Wendt, H. Jiao and M. Beller, ChemCatChem, 2014, 6, 2810–2814 CrossRef CAS; (f) S. Qu, H. Dai, Y. Dang, C. Song, Z.-X. Wang and H. Guan, ACS Catal., 2014, 4, 4377–4388 CrossRef CAS; (g) S. Werkmeister, K. Junge, B. Wendt, E. Alberico, H. Jiao, W. Baumann, H. Junge, F. Gallou and M. Beller, Angew. Chem., Int. Ed., 2014, 53, 8722–8726 CrossRef CAS PubMed; (h) X. Chen, Y. Jing and X. Yang, Chem.–Eur. J., 2016, 22, 1950–1957 CrossRef CAS; (i) D. G. Gusev, ACS Catal., 2016, 6, 6967–6981 CrossRef CAS; (j) R. van Putten, E. A. Uslamin, M. Garbe, C. Liu, A. Gonzalez-de-Castro, M. Lutz, K. Junge, E. J. M. Hensen, M. Beller, L. Lefort and E. A. Pidko, Angew. Chem., Int. Ed., 2017, 56, 7531–7534 CrossRef CAS.
- (a) P. A. Dub, N. J. Henson, R. L. Martin and J. C. Gordon, J. Am. Chem. Soc., 2014, 136, 3505–3521 CrossRef CAS PubMed; (b) P. A. Dub and J. C. Gordon, Dalton Trans., 2016, 45, 6756–6781 RSC; (c) P. A. Dub, B. L. Scott and J. C. Gordon, J. Am. Chem. Soc., 2017, 139, 1245–1260 CrossRef CAS PubMed; (d) D. J. Tindall, M. Menche, M. Schelwies, R. A. Paciello, A. Schafer, P. Comba, F. Rominger, A. S. K. Hashmi and T. Schaub, Inorg. Chem., 2020, 59, 5099–5115 CrossRef CAS PubMed.
- (a) C. del Pozo, M. Iglesias and F. Sánchez, Organometallics, 2011, 30, 2180–2188 CrossRef CAS; (b) Y. Sun, C. Koehler, R. Tan, V. T. Annibale and D. Song, Chem. Commun., 2011, 47, 8349–8351 RSC; (c) D. Kim, L. Le, M. J. Drance, K. H. Jensen, K. Bogdanovski, T. N. Cervarich, M. G. Barnard, N. J. Pudalov, S. M. M. Knapp and A. R. Chianese, Organometallics, 2016, 35, 982–989 CrossRef CAS; (d) L. Le, J. Liu, T. He, D. Kim, E. J. Lindley, T. N. Cervarich, J. C. Malek, J. Pham, M. R. Buck and A. R. Chianese, Organometallics, 2018, 37, 3286–3297 CrossRef CAS.
- L. Le, J. Liu, T. He, J. C. Malek, T. N. Cervarich, J. C. Buttner, J. Pham, J. M. Keith and A. R. Chianese, Organometallics, 2019, 38, 3311–3321 CrossRef CAS.
- T. He, J. C. Buttner, E. F. Reynolds, J. Pham, J. C. Malek, J. M. Keith and A. R. Chianese, J. Am. Chem. Soc., 2019, 141, 17404–17413 CrossRef CAS PubMed.
- E. Fogler, J. A. Garg, P. Hu, G. Leitus, L. J. W. Shimon and D. Milstein, Chem.–Eur. J., 2014, 20, 15727–15731 CrossRef CAS PubMed.
- (a) S. Takebayashi and S. H. Bergens, Organometallics, 2009, 28, 2349–2351 CrossRef CAS; (b) I. Carpenter, S. C. Eckelmann, M. T. Kuntz, J. A. Fuentes, M. B. France and M. L. Clarke, Dalton Trans., 2012, 41, 10136–10140 RSC; (c) J. A. Fuentes, S. M. Smith, M. T. Scharbert, I. Carpenter, D. B. Cordes, A. M. Z. Slawin and M. L. Clarke, Chem.–Eur. J., 2015, 21, 10851–10860 CrossRef CAS PubMed; (d) O. Ogata, Y. Nakayama, H. Nara, M. Fujiwhara and Y. Kayaki, Org. Lett., 2016, 18, 3894–3897 CrossRef CAS.
- (a) W. Kuriyama, Y. Ino, O. Ogata, N. Sayo and T. Saito, Adv. Synth. Catal., 2010, 352, 92–96 CrossRef CAS; (b) J. Zhang, E. Balaraman, G. Leitus and D. Milstein, Organometallics, 2011, 30, 5716–5724 CrossRef CAS; (c) D. Spasyuk, S. Smith and D. G. Gusev, Angew. Chem., Int. Ed., 2012, 51, 2772–2775 CrossRef CAS PubMed; (d) C. Ziebart, R. Jackstell and M. Beller, ChemCatChem, 2013, 5, 3228–3231 CrossRef CAS; (e) S. Chakraborty, H. Dai, P. Bhattacharya, N. T. Fairweather, M. S. Gibson, J. A. Krause and H. Guan, J. Am. Chem. Soc., 2014, 136, 7869–7872 CrossRef CAS PubMed; (f) T. vom Stein, M. Meuresch, D. Limper, M. Schmitz, M. Holscher, J. Coetzee, D. J. Cole-Hamilton, J. Klankermayer and W. Leitner, J. Am. Chem. Soc., 2014, 136, 13217–13225 CrossRef CAS PubMed; (g) T. J. Korstanje, J. I. van der Vlugt, C. J. Elsevier and B. de Bruin, Science, 2015, 350, 298–302 CrossRef CAS PubMed; (h) T. P. Brewster, N. M. Rezayee, Z. Culakova, M. S. Sanford and K. I. Goldberg, ACS Catal., 2016, 6, 3113–3117 CrossRef CAS; (i) N. A. Espinosa-Jalapa, A. Nerush, L. J. W. Shimon, G. Leitus, L. Avram, Y. Ben-David and D. Milstein, Chem.–Eur. J., 2017, 23, 5934–5938 CrossRef CAS PubMed; (j) J. Yuwen, S. Chakraborty, W. W. Brennessel and W. D. Jones, ACS Catal., 2017, 7, 3735–3740 CrossRef; (k) A. Anaby, M. Schelwies, J. Schwaben, F. Rominger, A. S. K. Hashmi and T. Schaub, Organometallics, 2018, 37, 2193–2201 CrossRef CAS.
- (a) H. Li, X. Wang, F. Huang, G. Lu, J. Jiang and Z.-X. Wang, Organometallics, 2011, 30, 5233–5247 CrossRef CAS; (b) H. Wang, C. Liu and D. Zhang, Mol. Catal., 2017, 440, 120–132 CrossRef CAS; (c) D. G. Gusev, Organometallics, 2020, 39, 258–270 CrossRef CAS.
- (a) G. Zeng and S. Li, Inorg. Chem., 2011, 50, 10572–10580 CrossRef CAS PubMed; (b) H. Li, M. Wen and Z.-X. Wang, Inorg. Chem., 2012, 51, 5716–5727 CrossRef CAS PubMed; (c) X. Yang, ACS Catal., 2012, 2, 964–970 CrossRef CAS; (d) D. Cho, K. C. Ko and J. Y. Lee, Organometallics, 2013, 32, 4571–4576 CrossRef CAS; (e) F. Hasanayn, A. Baroudi, A. A. Bengali and A. S. Goldman, Organometallics, 2013, 32, 6969–6985 CrossRef CAS; (f) F. Hasanayn and H. Harb, Inorg. Chem., 2014, 53, 8334–8349 CrossRef CAS PubMed; (g) L. Li, M. Lei, L. Liu, Y. Xie and H. F. Schaefer, Inorg. Chem., 2018, 57, 8778–8787 CrossRef CAS; (h) S. Shu, M. Huang, J. Jiang, L.-B. Qu, Y. Liu and Z. Ke, Catal. Sci. Technol., 2019, 9, 2305–2314 RSC.
- S. Kozuch and S. Shaik, Acc. Chem. Res., 2010, 44, 101–110 CrossRef PubMed.
- (a) C. Kubis, M. Sawall, A. Block, K. Neymeyr, R. Ludwig, A. Borner and D. Selent, Chemistry, 2014, 20, 11921–11931 CrossRef CAS; (b) E. N. Szlapa and J. N. Harvey, Chem.–Eur. J., 2018, 24, 17096–17104 CrossRef CAS; (c) A. C. Brezny and C. R. Landis, ACS Catal., 2019, 9, 2501–2513 CrossRef CAS.
- (a) H. Nakatsuka, T. Yamamura, Y. Shuto, S. Tanaka, M. Yoshimura and M. Kitamura, J. Am. Chem. Soc., 2015, 137, 8138–8149 CrossRef CAS PubMed; (b) S. Nakane, T. Yamamura, S. K. Manna, S. Tanaka and M. Kitamura, ACS Catal., 2018, 8, 11059–11075 CrossRef CAS.
- R. Noyori and T. Ohkuma, Angew. Chem., Int. Ed., 2001, 40, 40–73 CrossRef CAS PubMed.
- (a) X. Yang and M. B. Hall, J. Am. Chem. Soc., 2010, 132, 120–130 CrossRef CAS PubMed; (b) K. S. Sandhya and C. H. Suresh, Organometallics, 2011, 30, 3888–3891 CrossRef CAS; (c) C. Ma, S. Piccinin and S. Fabris, ACS Catal., 2012, 2, 1500–1506 CrossRef CAS; (d) K. S. Sandhya, G. S. Remya and C. H. Suresh, Inorg. Chem., 2015, 54, 11150–11156 CrossRef CAS PubMed.
- In several cases, transition states were calculated to have a lower free energy than a connected intermediate species. In each case, we have verified that the intermediate is lower in energy on the optimzed electronic energy surface. See the Computational Methods section for details.
- F. Hasanayn and A. Baroudi, Organometallics, 2013, 32, 2493–2496 CrossRef CAS.
- L. N. Dawe, M. Karimzadeh-Younjali, Z. Dai, E. Khaskin and D. G. Gusev, J. Am. Chem. Soc., 2020, 142, 19510–19522 CrossRef CAS PubMed.
- N. E. Smith, W. H. Bernskoetter and N. Hazari, J. Am. Chem. Soc., 2019, 141, 17350–17360 CrossRef CAS PubMed.
- A. Kumar, N. von Wolff, M. Rauch, Y. Q. Zou, G. Shmul, Y. Ben-David, G. Leitus, L. Avram and D. Milstein, J. Am. Chem. Soc., 2020, 142, 14267–14275 CrossRef CAS.
- S. Hoops, S. Sahle, R. Gauges, C. Lee, J. Pahle, N. Simus, M. Singhal, L. Xu, P. Mendes and U. Kummer, Bioinformatics, 2006, 22, 3067–3074 CrossRef CAS.
- (a) L. Artús Suàrez, Z. Culakova, D. Balcells, W. H. Bernskoetter, O. Eisenstein, K. I. Goldberg, N. Hazari, M. Tilset and A. Nova, ACS Catal., 2018, 8, 8751–8762 CrossRef; (b) Y. Yu, Y. Zhu, M. N. Bhagat, A. Raghuraman, K. F. Hirsekorn, J. M. Notestein, S. T. Nguyen and L. J. Broadbelt, ACS Catal., 2018, 8, 11119–11133 CrossRef CAS; (c) M. Jaraíz, J. E. Rubio, L. Enríquez, R. Pinacho, J. L. López-Pérez and A. Lesarri, ACS Catal., 2019, 9, 4804–4809 CrossRef; (d) J. A. Rogers and B. V. Popp, Organometallics, 2019, 38, 4533–4538 CrossRef CAS; (e) R. Perez-Soto, M. Besora and F. Maseras, Org. Lett., 2020, 22, 2873–2877 CrossRef CAS PubMed; (f) K.-A. Green and J. M. Hoover, ACS Catal., 2019, 10, 1769–1782 CrossRef.
- E. Brunner, J. Chem. Eng. Data, 1985, 30, 269–273 CrossRef CAS.
- (a) C. B. Kretschmer and R. Wiebe, J. Am. Chem. Soc., 1949, 71, 1793–1797 CrossRef CAS; (b) J. Guzman, A. Teja and W. Kay, Fluid Phase Equilib., 1981, 7, 187–195 CrossRef CAS.
- Y. Xu, H. Li, C. Wang, L. Ma and S. Han, Ind. Eng. Chem. Res., 2005, 44, 408–415 CrossRef CAS.
- (a) S. A. Morris and D. G. Gusev, Angew. Chem., Int. Ed., 2017, 56, 6228–6231 CrossRef CAS PubMed; (b) D. G. Gusev and D. M. Spasyuk, ACS Catal., 2018, 8, 6851–6861 CrossRef CAS.
- E. Balaraman, B. Gnanaprakasam, L. J. W. Shimon and D. Milstein, J. Am. Chem. Soc., 2010, 132, 16756–16758 CrossRef CAS PubMed.
- C. F. Macrae, P. R. Edgington, P. McCabe, E. Pidcock, G. P. Shields, R. Taylor, M. Towler and J. van de Streek, J. Appl. Cryst., 2006, 39, 453–457 CrossRef CAS.
Footnote |
| † Electronic supplementary information (ESI) available: Computational and experimental methods. Alternative pathways calculated by DFT and table of computed energies, images of NMR spectra for RuPNNHOEt, details of kinetic modeling (PDF). Atomic coordinates (XYZ) for all computed molecular structures, compiled as one file readable by the free program Mercury32 (compiled.xyz). Animations (GIF) for the imaginary vibrational modes of all calculated transition states (TS animations.zip). Copasi model (model.cps) and kinetic data in the format accepted by Copasi (data.txt). CCDC 2057608 and 2057609. For ESI and crystallographic data in CIF or other electronic format see DOI: 10.1039/d1sc00703c |
| This journal is © The Royal Society of Chemistry 2021 |

