 Open Access Article
Creative Commons Attribution 3.0 Unported Licence
Electrochemical oxidation of molecular nitrogen to nitric acid – towards a molecular level understanding of the challenges†
Megha
Anand
 ,
Christina S.
Abraham
 and
Jens K.
Nørskov
 *
*
Center for Catalysis Theory, Technical University of Denmark, Fysikvej Building 311, 2800 Kongens Lyngby, Denmark. E-mail: jkno@dtu.dk
First published on 9th April 2021
Abstract
Nitric acid is manufactured by oxidizing ammonia where the ammonia comes from an energy demanding and non-eco-friendly, Haber–Bosch process. Electrochemical oxidation of N2 to nitric acid using renewable electricity could be a promising alternative to bypass the ammonia route. In this work, we discuss the plausible reaction mechanisms of electrochemical N2 oxidation (N2OR) at the molecular level and its competition with the parasitic oxygen evolution reaction (OER). We suggest the design strategies for N2 oxidation electro-catalysts by first comparing the performance of two catalysts – TiO2(110) (poor OER catalyst) and IrO2(110) (good OER catalyst), towards dinitrogen oxidation and then establish trends/scaling relations to correlate OER and N2OR activities. The challenges associated with electrochemical N2OR are highlighted.
Introduction
Nitric acid is an industrially important compound. It is largely used to make nitrate-based fertilizers that are essential for food production from plants.1,2 Without the use of fertilizers it would be impossible to feed the 8 billion human population on earth. Nitric acid used as a basis for nitrate fertilizers is manufactured by oxidizing ammonia using the Ostwald process (Fig. 1), and the ammonia used here comes primarily from the Haber–Bosch (HB) process (N2 + 3H2 → 2NH3).3,4 Unfortunately this process requires harsh reaction conditions (P ∼ 150 atm and T ∼ 700 K) and it is highly energy intensive, using ∼1% of the total global energy consumption. The process has a high carbon-footprint since one of the reactants, H2, comes primarily from the steam reforming process where fossil resources react with water to form H2 and CO2 (Fig. 1). Approximately 1.9 metric tons of CO2 is formed per metric ton of NH3 produced which contributes significantly to the climate change.5,6 Hence, it is highly desirable to bypass the ammonia route and develop a direct and sustainable method for N2 fixation such as alternative routes to nitric acid formation.7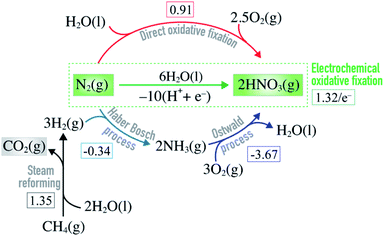 | ||
| Fig. 1 Equations showing how nitric acid is manufactured on industrial scale by combining steam reforming, Haber–Bosch and Ostwald processes. Direct and electrochemical oxidative N2 fixation are alternative routes to nitric acid formation. The square brackets contain the free energy of each reaction (in eV) at standard conditions.8 | ||
Direct oxidation of molecular nitrogen provides a moderately endothermic approach to produce nitrogen oxides and, ultimately, nitric acid (Fig. 1).9,10 The reaction is however extremely slow at ambient conditions11 – a good thing in general, since it helps maintain low concentration of NOx and nitric acid in our ecosystem. Only very high temperatures or plasmas enable reasonable reaction rates.12–19
Electrochemical oxidative fixation of molecular nitrogen (Fig. 1) appears to be a very attractive approach to drive the endothermic reaction at ambient conditions, where the electricity needed can come from the renewable energy sources making the process sustainable. The reaction has an equilibrium potential of 1.32 eV and previous reports suggest that at pHs above 1.3, the formation of nitrate ions is thermodynamically favoured over the parasitic oxygen evolution reaction for a wide range of potentials.6
There is a general lack of natural or artificial electro-catalysts for dinitrogen oxidation.20 Recently, a few experimental reports emerged suggesting Pd-decorated MXenes and several oxides as potential electrocatalysts for nitrogen oxidative fixation.21–24 There are numerous reports of oxide photo-catalysts for the N2 oxidation reaction, prominent among these is TiO2, but there is also a great deal of controversy in that field, see ref. 10 for a recent thorough review.
In the present paper, we aim at contributing to the theoretical framework for understanding the electrochemical dinitrogen oxidation reaction (N2OR). The goal is to provide design strategies for N2OR electro-catalysts both in terms of reaction rates and selectivity towards N2 oxidation relative to water oxidation (the oxygen evolution reaction, OER). Building on the work of Medford et al.,25,26 we first discuss the role of a catalyst in terms of stabilization of key intermediates on the basis of a set of density functional theory (DFT) computations. We contrast two catalysts, a good OER catalyst, IrO2, and a poor OER catalyst, TiO2. We then identify several possible rate- and selectivity-determining elementary steps and evaluate the corresponding activation energies.
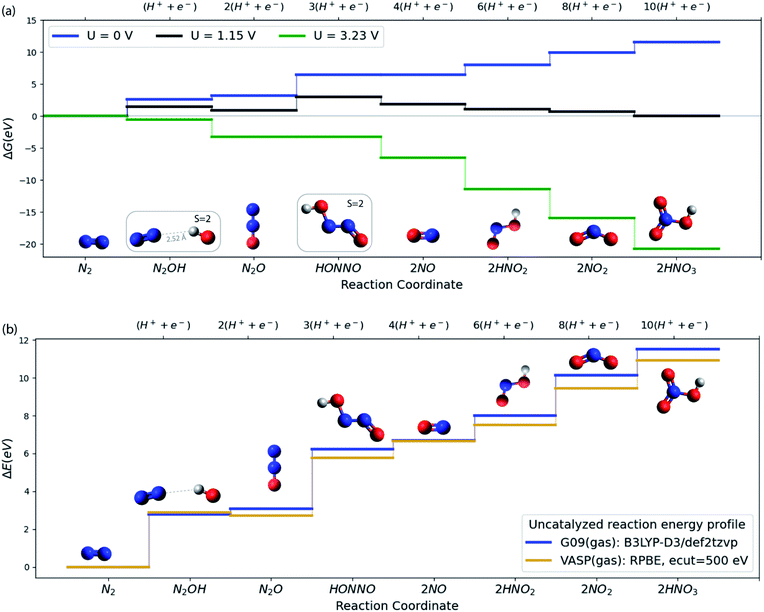
As a starting point, consider in Fig. 2a the free energy diagram for a set of intermediates defining the simplest possible pathway for N2 oxidation in solution. At the SMD(H2O)/B3LYP-D3/def2tzvp level of theory used here (see ESI†/Computational methods section for details), the free energy for this 10-electron electrochemical reaction is 11.5 eV in reasonable agreement with experiment (12.7 eV) when N2(g), H2(g) and H2O(g) are used as the references at standard conditions.8 The energetics and the characteristics of the intermediates all agree well with other DFT functionals and experiment as discussed in the ESI.†Fig. 2a illustrates well the difficulty of oxidizing N2, and the ease of the opposite reaction, reduction of nitrate to form N2.27,28 Applying a positive potential can reduce the thermodynamic barriers for N2OR, but a very high limiting potential of 3.23 V (vs. RHE) is needed in order for all reaction steps to become exergonic.
We now turn to discuss the ways in which a catalyst can facilitate the reaction. We will discuss solid catalysts deposited on an electrode. To this end we need a calculational scheme that can treat semi-infinite solid surfaces. We use VASP29–32 with the RPBE exchange–correlation functional,33 which is known to provide the best treatment of adsorption properties on solid surfaces34 (see ESI†/Computational methods section for details). Fig. 2b compares the gas phase energies of reaction intermediates of the uncatalyzed reaction obtained using the RPBE functional in VASP and the B3LYP-D3 functional in Gaussian 09. For the present purposes, the two functionals provide very similar descriptions of the N2OR process. In the following sections, we base our treatment of the electrochemical steps on the RPBE functional. We include entropic terms in the harmonic approximation, (see ESI† for details) in the calculation of the free energies but ignore solvation effects at the surface. We have tested this by studying the electrochemical interface between stoichiometric, defect-free (110) rutile TiO2 and explicitly adsorbed water in order to investigate how the presence of water influences the adsorption of the N2OR intermediates. We find almost no change in the N2OR adsorbate binding energy with the inclusion of explicit water molecules (see ESI†/Solvation section for more details).
We then consider the reaction over two transition metal oxide surfaces, IrO2 and TiO2, both in the rutile structure and in both cases, we consider the (110) facets. Both materials are stable under highly oxidizing conditions, for IrO2 at least up to potentials of interest for the oxygen evolution reaction.9,35–38 Here we focus on the path to producing NO, since the steps following that are relatively facile even at the equilibrium potential, as shown in Fig. 2a. Fig. 3a and b show the free energy diagram for two pathways for the two surfaces. Path 1 is the one we studied in solution (Fig. 2a), while the new path 2, starts with water oxidation to form adsorbed OH as first discussed by Medford and co-workers.26 The formation of adsorbed OH is less endergonic than the first oxidation step of N2 to form adsorbed N2OH for both surfaces. We therefore concentrate on path 2 in the following sections.
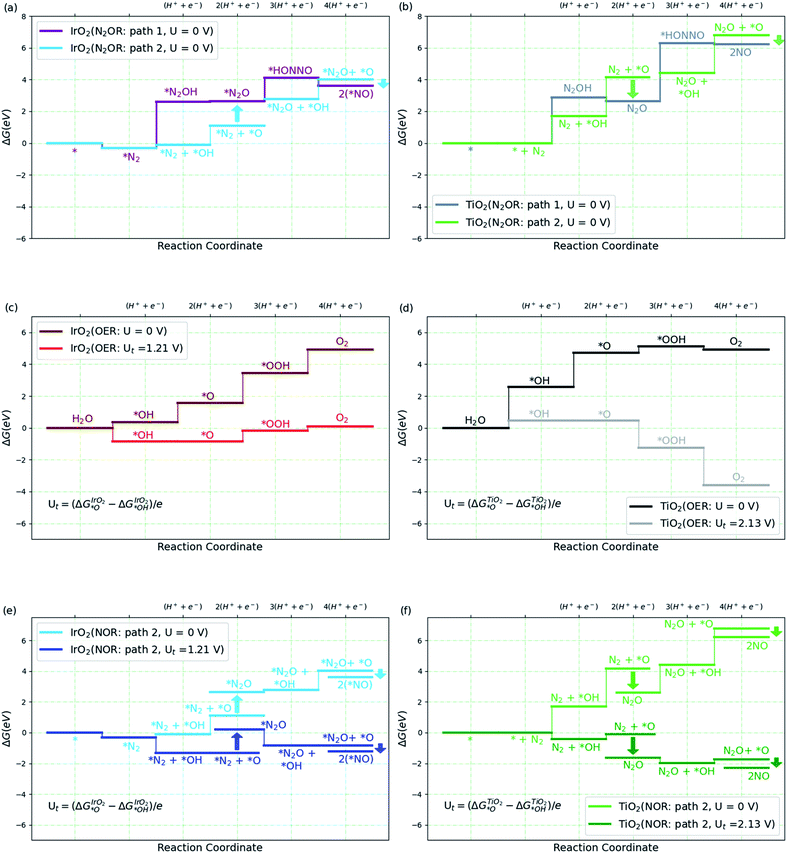 | ||
| Fig. 3 (a and b) Free energy diagram for N2 to NO formation through path 1 and path 2 on IrO2(110) and TiO2(110). (c and d) Free energy diagram for oxygen evolution reaction (OER) on high *O covered IrO2(110) and high *OH covered TiO2(110) surfaces at two different potentials, U and Ut volts, where Ut is defined in the plot (see ESI† for coverage details). (e and f) Free energy diagram for N2 to NO formation via path 2 on IrO2(110) and TiO2(110) at U and Ut volts. The label 2(*NO) refers to 2 times the NO–IrO2(110) system. All the relative free energies (ΔG) are evaluated with respect to N2(g), H2(g) and H2O(l). | ||
Adsorbed OH (or *OH) can react with N2 involving a proton and electron transfer to form N2O (*OH + N2 → N2O + H+ + e−). Alternatively, *OH can be oxidized further to form adsorbed O, which can react in two ways. It can form O2 by direct recombination or react with water in an electrochemical process to form adsorbed OOH and, after another electron and proton transfer, O2, Fig. 3c and d. This is the usual oxygen evolution reaction. Alternatively, the adsorbed O can react with N2 in a non-electrochemical process *O + N2 → *N2O, and further, *O + N2O → 2*NO (=*N2O2) (Fig. 3e and f). It can be seen that, as expected, OER is much more facile than N2OR for IrO2. Indeed, for IrO2, *N2O is considerably less stable than *O + *N2 making the N2OR reaction very slow, while OER becomes facile thermochemically at potentials above 1.5 V. On TiO2, on the other hand, the adsorbed O is so unstable, that N2O formation is highly exergonic. We therefore discuss TiO2 in more detail below.
Most of the reaction steps in Fig. 3e and f involve proton transfers from oxygen to water (in acidic conditions). Such barriers have been found to be very small, of the order 0.2 eV, in studies of water oxidation.39 We expect the highest barriers to be associated with the activation of N2. For the N2OR path 2, there are two possible rate determining steps to form N2O, the electrochemical pathway, *OH + N2 → N2O + H+ + e− or the purely chemical pathway, *O + N2 → N2O. In the following, we explore the chemical pathway, including the next chemical step, *O + N2O → N2O2 → 2*NO.
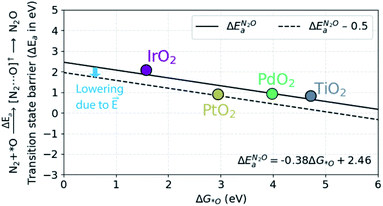
Fig. 4a shows the calculated activation energy for the reaction *O + N2 → N2O over a TiO2(110) surface. A value of 0.84 eV is found at this level of theory. Outside an electrode surface we need to include electric field effects. It can be seen in Fig. 3f that we need to apply a potential of Ut = (ΔGO − ΔGOH)/e in order for adsorbed O to become thermodynamically stable at the surface. For TiO2, this value is Ut = 2.13 V. If we assume a width of 3 Å for the Helmholtz layer outside the electrode,40 this corresponds to a field strength of the order of E ∼ Ut/d ∼ 0.7 V Å−1, depending on the value of the potential of zero charge of the system. In Fig. 4b we show the energy of adsorbed O and the transition state of N2O formation as a function of field strength outside a TiO2(110) surface. Clearly *O is strongly destabilized while the transition state is stabilized at positive fields. For TiO2, the net effect is a reduction of the activation energy of the order 0.5 eV. Finally, in order to evaluate the activation free energy, we need to include the loss of gas phase entropy of N2 during the reaction. This would add an energy of the order of 0.6 eV to the free energy barrier for the reaction (see ESI† for more details). The net free energy barrier is thus of the order 1 eV according to this very rough estimate.
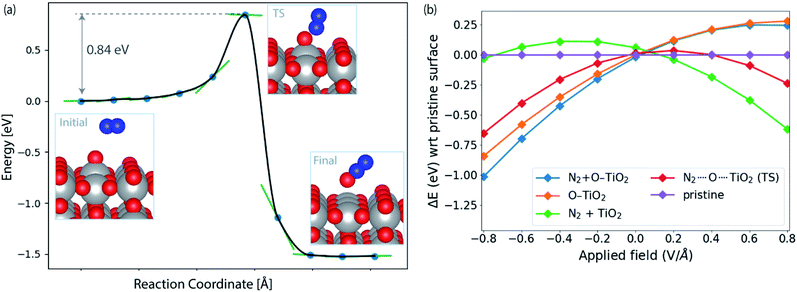 | ||
| Fig. 4 (a) Reaction pathway and barrier for *O + N2 → N2O formation on TiO2(110). (b) Influence of applied field on the energies of initial (N2 + O–TiO2) and transition state (N2⋯O⋯TiO2) with respect to the pristine slab (TiO2(110)). The orange and green lines correspond to the initial structure (N2 + O–TiO2) with N2 and *O removed from the surface, respectively. See ESI† for details of field computations. | ||
An activation free energy of the order 1 eV should give a measurable N2OR rate unless the selectivity is low. Based on the model developed in ref. 39 to estimate the activation energy for OER over TiO2, the activation energy for oxygen evolution is considerably low. Even given the crudeness of the estimate of the free energy barrier for N2OR, this result strongly suggests that N2OR through the direct chemical reaction of N2 and N2O with adsorbed O is difficult over TiO2. We cannot rule out that the alternative electrochemical process, *OH + N2 → N2O + H+ + e−, will work. That is beyond the present work. We find similar activation barrier of 0.77 eV for the N2O2 formation (*O + N2O → N2O2).
In order to understand the trends in the chemical N2O formation barrier we show in Fig. 5 the variation in the activation energy to form N2O with the O adsorption energy including additional oxide surface models. There is a strong linear scaling such that a weaker O adsorption bond gives a lower activation energy. A more facile N2OR process would therefore require a catalyst binding O even weaker than TiO2. The problem is that such a material would still have low activation energy for OER according to the model in ref. 39.
A more promising strategy towards a high selectivity may be to impede the electrochemical oxygen evolution (OER) step relative to the chemical N2OR steps. This can be accomplished by limiting the access to either proton acceptors or electron acceptors (holes). Limited access to proton acceptors can be accomplished by using a non-aqueous solvent with few proton acceptors. A similar strategy has already been used successfully to increase the selectivity of electrochemical N2 reduction (where the parasitic reaction is hydrogen evolution).41–44 Limited access to holes can for instance be achieved by limiting conductivity to the surface. For TiO2 this could be achieved by controlling the thickness of a non-conducting TiO2 film on the electrode surface.45 Limited access to holes could be what is achieved in photochemical N2OR. We note that any lowering of the electrochemical rates will of course lower the overall rate since the first N2OR steps are electrochemical.
Conclusions
In conclusion, we provide a molecular level understanding of the challenges associated with the electrochemical nitrogen oxidation reaction. We analyse the possibility of N2OR on an excellent OER catalyst, IrO2(110) and a poor OER catalyst TiO2(110). Obviously OER supersedes N2OR on IrO2 and TiO2 turns out be a borderline N2OR catalyst. We suggest ways to suppress OER in order to promote N2OR on oxide surfaces.Author contributions
J. K. N. and M. A. conceptualised the paper. M. A. performed all the computations except the aqueous stability computations which were done by C. S. A. All authors contributed towards writing the manuscript.Conflicts of interest
There are no conflicts to declare.Acknowledgements
This work was supported by the Toyota Research Institute and V-Sustain: The VILLUM Centre for the Science of Sustainable Fuels and Chemicals (9455) from VILLUM FONDEN.Notes and references
- J. M. Modak, Haber Process for Ammonia Synthesis, Resonance, 2002, 69–77 CrossRef CAS.
- T. Kandemir, M. E. Schuster, A. Senyshyn, M. Behrens and R. Schlögl, The Haber–Bosch Process Revisited: On the Real Structure and Stability of “Ammonia Iron” under Working Conditions, Angew. Chem., Int. Ed., 2013, 52, 12723–12726 CrossRef CAS PubMed.
- K. Wang, D. Smith and Y. Zheng, Electron-driven heterogeneous catalytic synthesis of ammonia: current states and perspective, Carbon Resour. Convers., 2018, 1, 2–31 CrossRef.
- A. Valera-Medina, H. Xiao, M. Owen-Jones, W. I. David and P. J. Bowen, Ammonia for power, Prog. Energy Combust. Sci., 2018, 69, 63–102 CrossRef.
- R. Schlögl, Catalytic synthesis of ammonia – a “never-ending story”?, Angew. Chem., Int. Ed., 2003, 42, 2004–2008 CrossRef PubMed.
- J. G. Chen, et al. Beyond fossil fuel-driven nitrogen transformations, Science, 2018, 360 Search PubMed.
- J. Baltrusaitis, Sustainable Ammonia Production, ACS Sustainable Chem. Eng., 2017, 5, 9527 CrossRef CAS.
- D. D. Wagman, W. H. Evans, V. B. Parker, R. H. Schumm, I. Halow, S. M. Bailey, K. L. Churney and R. L. Nuttall, The NBS tables of chemical thermodynamics properties: selected values for inorganic and C1 and C2 organic substances in SI units, J. Phys. Chem. Ref. Data, 1982, 111–518 Search PubMed.
- M. Pourbaix, Atlas of electrochemical equilibria in aqueous solutions, Tex: National Association of Corrosion Engineers, Houston, Texas, 1974, p. 500 Search PubMed.
- A. J. Medford and M. C. Hatzell, Photon-driven nitrogen fixation: current progress, thermodynamic considerations, and future outlook, ACS Catal., 2017, 7, 2624–2643 CrossRef CAS.
- G. Charlot, L'analyse qualitative et les réactions en solution, 1957, pp. 315–321 Search PubMed.
- Y. Wang, A. W. Desilva, G. C. Goldenbaum and R. R. Dickerson, Nitric oxide production by simulated lightning – dependence on current energy and pressure, J. Geophys. Res., 1998, 103, 19149–19159 CrossRef CAS.
- B. S. Patil, Q. Wang, V. Hessel and J. Lang, Plasma N2-fixation: 1900–2014, Catal. Today, 2015, 256, 49–66 CrossRef CAS.
- N. Cherkasov, A. O. Ibhadon and P. Fitzpatrick, A review of the existing and alternative methods for greener nitrogen fixation, Chem. Eng. Process., 2015, 90, 24–33 CrossRef CAS.
- X. Fan, S. Kang, J. Li and T. Zhu, Formation of nitrogen oxides (N2O, NO, and NO2) in typical plasma and plasma-catalytic processes for air pollution control, Water, Air, Soil Pollut., 2018, 229, 351–363 CrossRef.
- Y. He, Z. Chen, Z. Li, G. Niu and J. Tang, Non-thermal plasma fixing of nitrogen into nitrate: solution for renewable electricity storage?, Front. Optoelectron., 2018, 11, 92–96 CrossRef.
- S. Li, J. A. M. Jimenez, V. Hessel and F. Gallucci, Recent progress of plasma-assisted nitrogen fixation research: a review, Processes, 2018, 6, 248–273 CrossRef CAS.
- P. Lamichhane, R. Paneru, L. N. Nguyen, J. S. Lim, P. Bhartiya, B. C. Adhikari, S. Mumtaz and E. H. Choi, Plasma-assisted nitrogen fixation in water with various metals, React. Chem. Eng., 2020, 5, 2053–2057 RSC.
- Z. Liu, Y. Tian, G. Niu, X. Wang and Y. Duan, Direct Oxidative Nitrogen Fixation from Air and H2O by a Water Falling Film Dielectric Barrier Discharge Reactor at Ambient Pressure and Temperature, ChemSusChem, 2021, 14, 1507–1511 CrossRef CAS PubMed.
- Y. Wang, Y. Yu, R. Jia, C. Zhang and B. Zhang, Electrochemical synthesis of nitric acid from air and ammonia through waste utilization, Natl. Sci. Rev., 2019, 6, 730–738 CrossRef CAS.
- W. Fang, C. Du, M. Kuang, M. Chen, W. Huang, H. Ren, J. Xu, A. Feldhoff and Q. Yan, Boosting efficient ambient nitrogen oxidation by a well-dispersed Pd on MXene electrocatalyst, Chem. Commun., 2020, 56, 5779–5782 RSC.
- C. Dai, Y. Sun, G. Chen, A. C. Fisher and Z. J. Xu, Electrochemical Oxidation of Nitrogen towards Direct Nitrate Production on Spinel Oxides, Angew. Chem., 2020, 59, 9418–9422 CrossRef CAS PubMed.
- M. Kuang, et al. Efficient Nitrate Synthesis via Ambient Nitrogen Oxidation with Ru-Doped TiO2/RuO2 Electrocatalysts, Adv. Mater., 2020, 2002189–2002196 CrossRef CAS PubMed.
- S. Han, C. Wang, Y. Wang, Y. Yu and B. Zhang, Electrosynthesis of nitrate via the oxidation of nitrogen on tensile strained palladium porous nanosheets, Angew. Chem., Int. Ed., 2021, 133, 1–6 CrossRef.
- B. M. Comer, Y.-H. Liu, M. B. Dixit, K. B. Hatzell, Y. Ye, E. J. Crumlin, M. C. Hatzell and A. J. Medford, The Role of Adventitious Carbon in Photo-Catalytic Nitrogen Fixation by Titania, J. Am. Chem. Soc., 2018, 140, 15157–15160 CrossRef CAS PubMed.
- B. M. Comer and A. J. Medford, Analysis of Photocatalytic Nitrogen Fixation on Rutile TiO2(110), ACS Sustainable Chem. Eng., 2018, 6, 4648–4660 CrossRef CAS.
- V. Rosca, M. Duca, M. T. De Groot and M. T. M. Koper, Nitrogen Cycle Electrocatalysis, Chem. Rev., 2009, 109, 2209–2244 CrossRef CAS PubMed.
- M. Duca and M. T. M. Koper, Powering denitrification: the perspectives of electrocatalytic nitrate reduction, Energy Environ. Sci., 2012, 5, 9726–9742 RSC.
- J. Hafner and G. Kresse, Ab Initio Molecular Dynamics for Liquid Metals, Phys. Rev. B: Condens. Matter Mater. Phys., 1993, 47, 558–561 CrossRef PubMed.
- J. Hafner and G. Kresse, Ab Initio Molecular-Dynamics Simulation of the Liquid-Metal-Amorphous-Semiconductor Transition in Germanium, Phys. Rev. B: Condens. Matter Mater. Phys., 1994, 49, 14251–14269 CrossRef PubMed.
- G. Kresse and J. Furthmüller, Efficiency of Ab Initio Total Energy Calculations for Metals and Semiconductors Using a Plane-Wave Basis Set, Comput. Mater. Sci., 1996, 6, 15–50 CrossRef CAS.
- G. Kresse and J. Furthmüller, Efficient Iterative Schemes for Ab Initio Total-Energy Calculations Using a Plane-Wave Basis Set, Phys. Rev. B: Condens. Matter Mater. Phys., 1996, 54, 11169–11186 CrossRef CAS PubMed.
- B. Hammer, L. Hansen and J. K. Nørskov, Improved adsorption energetics within density functional theory using revised Perdew–Burke–Ernzerhof functionals, Phys. Rev. B: Condens. Matter Mater. Phys., 1999, 59, 7413–7421 CrossRef.
- J. Wellendorff, K. T. Lundgaard, A. Møgelhøj, V. Petzold, D. D. Landis, J. K. Nørskov, T. Bligaard and K. W. Jacobsen, Density functionals for surface science: exchange–correlation model development with Bayesian error estimation, Phys. Rev. B: Condens. Matter Mater. Phys., 2012, 85, 235149–235172 CrossRef.
- D.-S. Kong and J.-X. Wu, An Electrochemical Study on the Anodic Oxygen Evolution on Oxide Film Covered Titanium, J. Electrochem. Soc., 2008, 155, C32 CrossRef CAS.
- S. Cherevko, S. Geiger, O. Kasian, N. Kulyk, J. P. Grote, A. Savan, B. R. Shrestha, S. Merzlikin, B. Breitbach, A. Ludwig and K. J. Mayrhofer, Oxygen and hydrogen evolution reactions on Ru, RuO2, Ir, and IrO2 thin film electrodes in acidic and alkaline electrolytes: a comparative study on activity and stability, Catal. Today, 2016, 262, 170–180 CrossRef CAS.
- S. Geiger, O. Kasian, M. Ledendecker, E. Pizzutilo, A. M. Mingers, W. T. Fu, O. Diaz-Morales, Z. Li, T. Oellers, L. Fruchter, A. Ludwig, K. J. Mayrhofer, M. T. Koper and S. Cherevko, The stability number as a metric for electrocatalyst stability benchmarking, Nat. Catal., 2018, 1, 508–515 CrossRef CAS.
- Z. Wang, X. Guo, J. Montoya and J. K. Nørskov, Predicting aqueous stability of solid with computed Pourbaix diagram using SCAN functional, npj Comput. Mater., 2020, 160, 1–7 CrossRef.
- C. F. Dickens, C. Kirk and J. K. Nørskov, Insights into the electrochemical oxygen evolution reaction with ab initio calculations and microkinetic modeling: beyond the limiting potential volcano, J. Phys. Chem. C, 2019, 123, 18960–18977 CrossRef CAS.
- G. S. Karlberg, J. Rossmeisl and J. K. Nørskov, Estimations of electric field effects on the oxygen reduction reaction based on the density functional theory, Phys. Chem. Chem. Phys., 2007, 9, 5158 RSC.
- A. Tsuneto, A. Kudo and T. Sakata, Efficient Electrochemical Reduction of N2 to NH3 catalyzed by Lithium, Chem. Lett., 1993, 851–854 CrossRef CAS.
- A. Tsuneto, A. Kudo and T. Sakata, Lithium-mediated electrochemical reduction of high pressure N2 to NH3, J. Electroanal. Chem., 1994, 367, 851–854 CrossRef.
- S. Z. Andersen, M. J. Statt, V. J. Bukas, S. G. Shapel, J. B. Pedersen, K. Krempl, M. Saccoccio, D. Chakraborty, J. Kibsgaard, P. C. K. Vesborg, J. Nørskov and I. Chorkendorff, Increasing stability, efficiency, and fundamental understanding of lithium-mediated electrochemical nitrogen reduction, Energy Environ. Sci., 2020, 13, 4291–4300 RSC.
- N. Lazouski, M. Chung, K. Williams, M. L. Gala and K. Manthiram, Non-aqueous gas diffusion electrodes for rapid ammonia synthesis from nitrogen and water-splitting derived hydrogen, Nat. Catal., 2020, 3, 463–469 CrossRef CAS.
- V. Viswanathan, K. L. Pickrahn, A. C. Luntz, S. F. Bent and J. K. Nørskov, Nanoscale limitations in metal oxide electrocatalysts for oxygen evolution, Nano Lett., 2014, 14, 5853–5857 CrossRef CAS PubMed.
Footnote |
| † Electronic supplementary information (ESI) available. See DOI: 10.1039/d1sc00752a |
| This journal is © The Royal Society of Chemistry 2021 |

